Francisco I BastosI
Cynthia B CunhaI Mariana A HackerI,II
Grupo de Estudos em
População, Sexualidade e Aids*
I Laboratório de Informações em Saúde. Instituto de Comunicação e Informação Científi ca e Tecnológica em Saúde. Fundação Oswaldo Cruz. Rio de Janeiro, RJ, Brasil
II Laboratório de Hanseníase do
Departamento de Micobacterioses. Instituto Oswaldo Cruz. Fundação Oswaldo Cruz. Rio de Janeiro, RJ, Brasil
* (Study Group on Population, Sexuality and AIDS) members: Elza Berquó, Francisco Inácio Pinkusfeld Bastos, Ivan França Junior, Regina Barbosa, Sandra Garcia, Vera Paiva, Wilton Bussab.
Correspondence: Francisco I. Bastos
Laboratório de Informações em Saúde Instituto de Comunicação e Informação Científi ca e Tecnológica em Saúde Fundação Oswaldo Cruz
Av. Brasil, 4.365 - Pavilhão Haity Moussatché 21040-900 Rio de Janeiro, RJ, Brasil E-mail: bastos@cict.fi ocruz.br
Received: 7/31/2007 Reviewed: 11/2/2007 Approved: 12/18/2007
Signs and symptoms associated
with sexually transmitted
infections in Brazil, 2005
ABSTRACT
OBJECTIVE: Sexually transmitted infections (STIs) are a major determinant of population disease burden worldwide. The objective of the study was to assess self-reported morbidity associated to STIs according to gender.
METHODS: The study data were obtained from a 2005 study consisting of a multistage probabilistic sample of 5,040 respondents, aged 16–65 years, living in urban areas in Brazil. These data were compared with those from a previous 1998 study. Bivariate analyses were carried out using Pearson’s chi-square test and simple linear regression followed by logistic regression.
RESULTS: In both men and women, the variables: previous HIV testing, personal belief in unfaithful love, and number of sexual partners in a lifetime were signifi cantly associated to STIs. In women only, the covariates: low family income, living in the Mid-West, Southeast and South regions, and reporting of physical violence were independently associated to STIs. In men, the variables associated were: age group (35 years or more), living in the South region and in the state of São Paulo, and self-perceived HIV infection risk.
CONCLUSIONS: Signs and symptoms associated to STIs have strong gender differences in the general population and education interventions should be specifi cally targeted to either men or women.
DESCRIPTORS: Sexually Transmitted Diseases, epidemiology. Acquired Immunodefi ciency Syndrome, Epidemiology. Morbidity Surveys. Sexual and Reproductive Health. Brazil. Cross-sectional Studies.
INTRODUCTION
In diverse settings worldwide and particularly in developing countries, sexually transmitted infections (STIs) are a major determinant of population disease burden.8,17 They comprise a complex set of infections caused by several different
microorganisms, with very specifi c clinical presentations and natural histories, and therefore further investigation is needed on basic concepts.
Although many STI cases remain asymptomatic for extended periods, this does not prevent an eventual pro-gression to more severe disease forms such as infertility, chronic pelvic pain and different cancers as well. This characteristic long asymptomatic course of STIs has been described by Eng & Butler8 (1997) as a “hidden
epi-demic,” and their actual magnitude and severity can only be verifi ed through population-based studies combining survey questionnaire data and laboratory testing.
STDs are determining cofactors of HIV infection and transmission, playing a crucial role in the dynamics of HIV spread worldwide.1,22 They are a particularly
important public health concern due to the severity of cancers secondary to the two sexually transmitted virus infections: hepatitis B virus (HBV) infection, which may lead to liver cirrhosis, liver failure and cancer; and human papillomavirus (HPV) infection, which is asso-ciated to several different cancers, notably cervical and anal cancer, and has been recently described as causing tonsil cancer and other head and neck cancers.16
Varying STD prevalences, incidence and morbidity rates may be a result of biological predisposition to acquire certain infections/diseases, sexual behaviors determining increased or reduced infection risk, diverse social and cultural environment of both men and women (which also includes gender inequalities and/or unequal access to material and non-material resources such as education and adequate income), the availability of preventive actions for health maintenance and promo-tion and access to health services.10,20
In particular, women are more susceptible to HIV-1 infection due to hormonal changes; physiology and ecology of their vaginal fl ora; higher prevalence of other STDs;21 sexual and affective mixing patterns
usually involving the interaction of younger women with older male partners (who have higher background prevalences for different STIs in diverse settings);14
besides restraints against the use and maintenance of protective measures in situations of marked gender inequality and even violence.11
Population-based studies have been scarce in Brazil and they fulfi ll three main purposes: a) to support the implementation of strategies for management and treatment of major clinical syndromes associated with STDs;18 b) to support public policies, epidemiological
studies and mathematical modeling on HIV/AIDS given that STIs/STDs comprise major cofactors for sexual HIV spread;1,22 and c) to provide markers potentially
associated to the prevalence of sexual risk behaviors in baseline and follow-up studies.22
The objective of the present study was to assess self-reported morbidity of major STDs and their variables associated according to gender.
METHODS
The analyses refer to fi ndings of the survey “ Compor-tamento Sexual e Percepções da População Brasileira sobre HIV/Aids”a (Sexual behavior and perceptions of
the Brazilian population regarding HIV/AIDS), carried out in 2005, and compared to a similar survey carried out in 1998.b Data were obtained through a multistage
probabilistic sample comprising 5,040 subjects aged between 16 and 65 years who were living in large metropolitan areas in Brazil and collected through the administration of individual standardized question-naires. A similar survey was carried out in 1998 in a sample of 2,416 subjects. The survey methods and sampling are detailed elsewhere.3
Both surveys included representative samples of Brazilian urban population drawn from microregions defi ned by the Instituto Brasileiro de Geografi a e Estatística (Brazilian Institute of Geography and Sta-tistics, IBGE). A four-step stratifi ed sampling resulted in three strata in capital cities and census tracts, private households and individuals aged between 16 and 65 years were successively drawn in all microregions studied. Data that were analyzed are from post-strata, defi ned based on a weighing process that corrects the probability of inclusion of any household in the sample, as described by Bussab.3
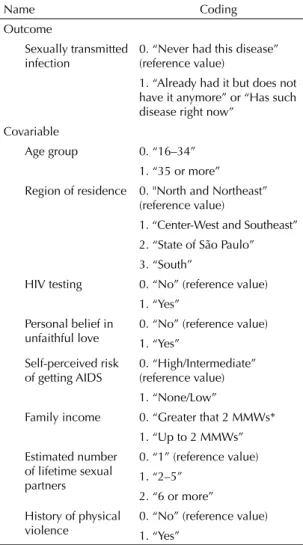
The questionnaire on STDs included questions ad-dressing self-reported signs and symptoms suggestive of STDs (perceived illness) and history of STDs based on the diagnosis conveniently communicated by an accredited health provider (physician or biomedical provider) (Table 1).
Bivariate analyses were fi rst conducted using Pearson’s chi-square test for categorical variables and simple linear regression for discrete or continuous variables, checking whether angular coeffi cient was signifi cantly greater than zero. This was intended to select potential risk factors for STDs in the logistic regression model. Analyses were carried out according to gender, at a 10% signifi cance level in bivariate analyses and at 5% signifi cance level in the logistic regression model. A more conservative signifi cance level was set because it was a large comprehensive population-based sample. Variables selected for the analysis are displayed in Table 1. Since the study data have a complex structure, the “svy” command of Stata 8.0 was used as it allows to incorporating weighted estimates for complex samples into variance estimates.
Additional analyses were conducted excluding the symptom “vaginal discharge” since, strictly speaking, it is recognizably non-specifi c and weakly associated to STDs.19
a Survey conducted by the Centro Brasileiro de Análise e Planejamento (Cebrap) and the Brazilian Ministry of Health.
The project of the survey “Comportamento Sexual e Percepções da População Brasileira Sobre HIV/Aids” was approved by the Ethics Committee of Faculdade de Saúde Pública of Universidade de São Paulo.
RESULTS
The comparison between 2005 and 1998 surveys data showed an increased proportion of respondents who reported knowledge on one or two STDs. In regard to the most common STDs such as AIDS, gonorrhea and syphilis (the latter two usually known as “classic bacterial STDs”), the proportion of respondents who reported any knowledge increased to 8.8%, 42.5% and 67.4%, respectively. Yet, prior knowledge on these diseases was already pronounced, i.e., 90.7%, 62.1% and 47.6% reported any knowledge on AIDS, gonorrhea and syphilis, respectively, in 1998.
As for Chlamydia, hepatitis B, lymphogranuloma venereum and HPV infection, while they were seldom reported in the 1998 survey, an increased proportion of respondents were able to identify these conditions from a list in the 2005 survey (Figure 1).
Table 2 shows respondents’ signs and symptoms poten-tially associated to STIs, stratifi ed by sociodemographic and behavioral characteristics, reported in 2005. The proportion of subjects who reported having none of the signs and symptoms inquired (discharge, ulcers, wounds or genital warts) was signifi cantly lower among women (40.8%) than men (84.4%).
The proportions of respondents who reported never having any STD signs and symptoms were 76.8% and 67.7% in those aged 16–19 and 20–24 years, respec-tively. This proportion ranged between 54% and 62% in the other age groups.
Of those who attended elementary and middle school, 61.7% and 64.7%, respectively, reported never having any STD signs and symptoms, compared to 53.5% (p=0.0001) among those with higher schooling. In addition, 16.2% of men and 66.4% of women with university/graduate schooling reported (urethral or vaginal) discharge.
In the analysis stratifi ed by family income, the propor-tions of respondents who reported never having any STDs was similar in all strata studied (p=0.2989), 57.6% in those with family income less than one monthly minimum wage (MMW) and 58.3% in those with income greater than 10 MMWs.
The proportion of those who reported never having any STD signs and symptoms was 78.9% in single respon-dents, 49.4% in separated and widowed and 53.8% in those either married or living with a partner and the difference was statistically signifi cant (p<0.000). It was also found a higher proportion of those who reported having no sexual intercourse in the 12 months prior to the interview compared to those who reported sexual intercourse during this same period. However, the difference was not statistically signifi cant (61.1% vs. 59.6%; p=0.572).
The proportion of respondents who reported no signs and symptoms was lower among those living in Mid-West (52.8%) and Northeast cities (59.8%), compared to those living in other Brazilian regions. These differ-ences were statistically signifi cant (p=0.007).
Table 3 shows the covariates selected in the bivariate analysis as potentially associated to STDs according to gender. The prevalence of self-reported STDs was 26% in men over 35 years of age. In women, STDs were mostly reported (20.6%) in those aged between 25 and 44 years. In both men and women, higher prevalences of self-reported STDs were seen in those over 35 years of
Table 1. Description of variables associated to the prevalence
of self-reported sexually transmitted diseases.* Brazil, 2005.
Name Coding
Outcome
Sexually transmitted infection
0. “Never had this disease” (reference value)
1. “Already had it but does not have it anymore” or “Has such disease right now”
Covariable
Age group 0. “16–34”
1. “35 or more”
Region of residence 0. "North and Northeast”
(reference value)
1. “Center-West and Southeast” 2. “State of São Paulo” 3. “South”
HIV testing 0. “No” (reference value)
1. “Yes” Personal belief in
unfaithful love
0. “No” (reference value) 1. “Yes”
Self-perceived risk of getting AIDS
0. “High/Intermediate” (reference value) 1. “None/Low”
Family income 0. “Greater that 2 MMWs*
1. “Up to 2 MMWs” Estimated number
of lifetime sexual partners
0. “1” (reference value) 1. “2–5”
2. “6 or more” History of physical
violence
0. “No” (reference value) 1. “Yes”
MMWs: monthly minimum wages
age (20.9%) while 14.5% prevalence was seen in those aged between 16 and 34 years (Table 3).
Higher prevalence of self-reported STDs was found among those with income less than 2 MMWs, 21.5%
in women, 22.4% in men, and 21.8% in both men and women. In those with family income over 10 MMWs, the prevalences were around 20.0% and very similar in all categories.
Table 2. Self-reported prevalence of conditions associated to STDs. Brazil, 2005.
Variable
Reported symptoms Urethral
discharge (men)
Vaginal discharge (women)
Genital ulcers or
wounds Genital warts
Did not have any of these problems
Male 13.6 - 1.2 1.2 84.4
Female - 58.6 3.6 1.4 40.8
p-value <0.000 0.632 <0.000
Age (years)
16–19 3.6 44.0 0.5 0.9 76.8
20–24 5.7 56.8 2.6 1.1 67.7
25–34 9.7 66.0 1.9 1.1 59.3
35–44 20.1 63.7 4.1 1.9 54.1
45–54 20.0 55.6 3.1 1.4 58.0
55–65 21.1 48.8 1.8 1.3 62.0
p-value <0.000 <0.000 0.004 0.595 <0.000
Schooling
Elementary 14.7 57.2 2.4 1.2 61.7
Middle 10.4 56.0 2.3 1.3 64.7
University/graduate 16.2 66.4 3.7 1.4 53.5
p-value 0.027 0.009 0.227 0.813 <0.000
Family income (MMWs)
Up to 1 18.1 55.0 2.7 1.1 57.6
More than 1 up to 2 12.0 54.3 1.7 0.9 63.0
More than 2 up to 3 8.7 59.1 2.2 1.6 63.4
More than 3 up to 5 13.5 60.7 3.0 1.3 61.1
More than 5 up to 10 15.1 60.6 2.5 0.9 63.1
More than 10 16.9 63.7 4.6 2.3 58.3
p-value 0.061 0.191 0.110 0.512 0.299
Marital status
Single 7.1 49.0 1.5 0.9 78.9
Married 17.3 60.8 3.0 1.3 58.2
Separated/widowed 16.9 58.1 2.5 1.9 49.4
Living with a partner 17.2 65.4 3.5 1.8 53.8
p-value <0.000 <0.000 0.014 0.326 <0.000
Sexually active in the last 12 months?
Yes 14.7 62.8 2.8 1.4 59.6
No 6.0 49.9 1.9 1.9 61.1
p-value 0.005 <0.000 0.258 0.424 0.572
Region of residence
North 17.1 34.6 1.9 1.3 72.7
Northeast 19.7 56.5 2.3 1.4 59.8
South 11.4 48.7 3.9 1.5 65.4
Southeast 10.0 63.2 2.6 1.3 61.7
Center-West 23.4 64.2 0.3 1.3 52.8
Male and female respondents living in North/North-east, Center-West/Southeast cities showed higher prevalences of self-reported STDs (22.9% and 18.7%, respectively) than all the strata (men, women and both men and women) of people living in the South (15.8%).
The lowest STD prevalences were found in women living in the Center-West/Southeast (15.5%) and South regions (13.8%).
In all groups (men, women and both), STD prevalence was often higher in those who reported having more
Table 3. Prevalence of self-reported STDs according to selected covariables. Brazil, 2005.
Variable Male % Total n Female % Total n Both men and
women % Total n
Age group
16–34 10.2* 1080 18.9 1014 14.5* 2152
35 or more 26.1 1128 16.5 1335 20.9 2507
Family income
Up to 2 MMWs 22.4** 522 21.5** 677 21.8* 1228
Greater than 2 MMWs 17.1 1686 15.9 1672 16.6 3431
Region of residence
North/Northeast 23.4** 573 22.8** 612 22.9* 1220
Center-West/Southeast 22.0 681 15.5 706 18.7 1422
State of São Paulo 10.4 649 16.9 671 13.6 1342
South 17.4 305 13.8 360 15.8 676
Number of sexual partners in the last 12 months
None 11.1** 134 14.3* 334 13.5* 478
1 17.8 1608 17.3 1914 17.6 3612
2 or more 22.3 465 32.2 101 23.9 570
Number of partners with age difference greater than or equal to 10 years
None 16.3* 1637 17.0** 1622 16.7* 3338
1 or more 28.3 436 22.7 393 25.5 843
Estimated number of lifetime sexual partners
1 2.6* 133 13.4* 1107 12.4* 1271
2–5 7.9 535 19.0 957 15.2 1535
6 or more 23.8 1395 33.0 240 25.0 1663
Category of sexual partner
Steady partner only 19.8 1468 18.0** 1801 18.9** 3351
Steady and/or occasional partners 17.9 534 28.5 118 19.5 662
No sexual partners in the last 12 months 10.9 135 13.9 353 13.2 497
Occasional/steady partner: condom use (always)
No 20.0** 1602 16.5** 1977 18.1 3652
Yes 14.1 601 23.7 360 17.7 989
HIV testing
No 16.8** 1546 15.6** 1372 16.2* 2975
Yes 22.1 655 20.6 965 21.1 1666
Personal belief in unfaithful love
No 17.2** 1633 16.4* 2004 16.8* 3717
Yes 22.5 535 24.2 322 23.1 879
Self-perceived risk of AIDS
High/Intermediate 23.9 216 24.1** 273 23.5* 509
None/low 17.7 1978 16.6 2033 17.2 4094
History of physical violence
No 17.6** 2007 16.1* 2016 16.8* 4103
Yes 25.5 200 26.7 332 26.4 552
lifetime sexual partners as well as when greater age difference was seen between the respondent and their partner, though it was gender-related. Higher STD prevalence was found in women who reported having had two or more sexual partners in the 12 months prior to the interview. In men, the covariate associated to higher STD prevalence was an age difference to their sexual partner greater than or equal to 10 years. Those who had six or more sexual partners in their lifetime reported higher rates of STDs, 33.0% among women and 23.8% among men.
With respect to occasional and steady partners in the 12 months prior to the interview, women (28.5%) more often reported STDs compared to men (17.9%) and both men and women (19.5%). Of all respondents who reported not having sexual intercourse in the 12 months prior to the interview, men showed lower prevalences of self-reported STDs (10.9%) compared to women and both men and women (around 14%).
Previous HIV testing was less frequently reported by women (20.6%) and both men and women (21.1%) compared to men (22.1%).
Respondents were asked to self-assess their risk of acquiring AIDS as high, intermediate or low/no risk. In both men and women, 23.5% self-perceived their risk of acquiring AIDS as high. A signifi cant difference in prevalence of self-reported STDs was found in both men (p=0.0495) and women (p=0.0076) who reported high risk (23.9% vs. 24.1%, respectively).
Table 4 summarizes estimates of the logistic regression model for men and women. The variables independently associated to STDs were as follows: older age in men (adjusted odds ratio [OR] 3.60; 95% CI: 2.62;4.95); family income less than 2 MMWs in women (adjusted OR 1.47; 95% CI: 1.06;2.02); HIV testing in men and women (adjusted OR 1.52; 95% CI: 1.10;2.09 and 1.35; 95% CI: 1.02;1.79, respectively); personal belief in unfaithful love in men and women (OR 1.49; 95% CI: 1.05; 2.10 and 1.51; 95% CI: 1.05; 2.16, respec-tively); estimated number of lifetime sexual partners in men (OR 8.38; 95% CI: 3,14;22,32) and in women (OR 2.49; 95% CI: 1.67; 3.70) for a cut-off value “six or more lifetime partners”; and physical violence in women (OR 1.62; 95% CI: 1.17; 2.25).
Some covariates showed either an independent or in-verse association to STDs (protective variables): region of residence, where the comparison category was those living in the North and Northeast regions with those “living in the state of São Paulo” (OR 0.35; 95% CI: 0.23;0.53), among men. For those living in the South, estimated OR were 0.63 (95% CI: 0.43;0.92) among men, and 0.52 (95% CI: 0.34;0.79) among women. A comparison of those living in Center-West and Southeast cities showed OR 0.63 (95% CI: 0.41;0.98) among women.
The variable “self-assessment of AIDS as low/no risk” was associated to STDs (OR 0.54; 95% CI: 0.34;0.86) in men.
The variables “condom use with an occasional or steady partner,” “number of partners with age difference greater than or equal to 10 years,” and “category of sexual part-ner in the 12 months prior to the interview” were not signifi cantly associated to self-reported STD prevalence in any of the study analyses. However, these variables are related to information over different time periods.
DISCUSSION
Although the present study does not allow to assessing an actual STD prevalence as it is based on self-reported information, it can reasonably be assumed that, to a certain extent, self-reported morbidity is consistent to the respondents’ STD history. However, asymptomatic infections have to be ruled out and information bias have to be taken into account as respondents tend to underreport information related to subjects that may cause embarrassment to them.9,15 Information bias can
show major gender-related differences. Further studies would be needed for better understanding this phe-nomenon which could provide more in-depth analysis despite not being as comprehensive. A more in-depth
Table 4. Models for self-reported STDs. Brazil, 2005.
Covariable OR (95% CI)
Male Female
Age group 35 years or more 3.60
(2.62;4.95)
1.01 (0.79;1.29) Family income up to 2
MMWs
1.29 (0.93;1.78)
1.47 (1.06;2.02) Region of residence
Center-West and Southeast
0.80 (0.56;1.13)
0.63 (0.41;0.98)
State of São Paulo 0.35
(0.23;0.53)
0.72 (0.46;1.11)
South 0.63
(0.43;0.92)
0.52 (0.34;0.79)
HIV testing 1.52
(1.10;2.09)
1.35 (1.02;1.79) Personal belief in unfaithful
love
1.49 (1.05;2.10)
1.51 (1.05;2.16) Self-assessment of risk of
AIDS as none or low
0.54 (0.34;0.86)
0.78 (0.53;1.14) Estimated number of lifetime
sexual partners
2–5 2.83
(0.98;8.19)
1.32 (0.99;1.76)
6 or more 8.38
(3.14;22.32)
2.49 (1.67;3.70)
History of physical violence 1.56
(0.97;2.52)
analysis could be achieved through the application of comprehensive instruments, as well as through qualita-tive studies linked to epidemiological data.
STD and related conditions were more often reported among those with higher schooling and family income. Similar fi ndings were reported in a survey on AIDS/ STDs by the Instituto Brasileiro de Opinião Pública e Estatística (Brazilian Institute of Public Opinion and Statistics, IBOPE), commissioned by the Brazilian Ministry of Health, and conducted between January 26 and 29, 2003. The IBOPE survey comprised a representative sample of Brazilian sexually active population aged 14 years or more.a Among those who
reported any sex organ/urinary condition, 38% had elementary schooling, 43% middle schooling and 45% had university/graduate schooling.
Factors such as failure/inability of translating a set of signs and symptoms into a STD diagnosis, and de-manding care and potentially diffi cult access to health providers once the empirical diagnosis of STD has been made seem to be more common among poor and less educated populations. These factors could explain the fact that STDs were more frequently reported among those with higher schooling and family income.
As a result, on one hand, there would be an inconsis-tency between STD clinical and laboratory diagnosis and, on the other hand, self-perception and diagnostic designation by the very individuals affected and health providers caring for them. This situation is mediated by one’s ability to self-diagnose these conditions, the
demand for and actual access to health services and capacity of these services to accurately diagnose these conditions. This inconsistency can and should be re-verted through health education interventions, increased access to health services and training of health providers in the diagnosis and adequate management of STDs.
Inconsistency related to high prevalence of vaginal discharge is remarkable in both community settings and health services providing care to these patients, despite its poor correlation with actual STD manifestations.19
In contrast, severe gynecological infections can have an asymptomatic or oligosymptomatic progress over the years in a considerable proportion of women, causing severe complications such as chronic pelvic infections in the medium and long run.6
Clinical and laboratory research studies conducted in Brazil have showed confl icting objective results, i.e., higher rates of STDs in poor populations. In a study conducted in 24 reference centers in Brazil, Rodrigues et al23 reported higher rates of syphilis in
3,047 puerperal women with family income lower than 1 MMW compared to other puerperal women in the study sample.
Similarly, in a study assessing STD prevalence in a sample comprising 200 women aged 14–29 years who attended an HIV testing service in the city of Rio de Janeiro, it was found an 8% prevalence of HIV infec-tion, 6.5% of syphilis, 8% of Chlamydia and 9.5% of gonorrhea. HIV infection was statistically associated to low schooling.5
Figure. Proportion of respondents who reported knowledge on sexually transmitted diseases. Brazil, 1998 and 2005.
0 20 40 60 80 100
%
90.7 98.7
AIDS
62.1 88.5
Chlamydia
2.1 12.2
Syphilis
1998 2005
2.2 14.1
Gonorrhea
21.4 57.1
Genital herpes
22.2 41.2
Genital warts/HPV 47.6
79.7
Lymphogranuloma venereum
16.3 55.5
Chancroid
11.1 72.9
Hepatitis B
A study carried out in Salvador, Northeastern Brazil,7
compared STD prevalence between women who attend-ed family planning clinics, public school students and people living in low-income communities. Women who attended family planning clinics had higher schooling and lower STD prevalence compared to those women in the other two groups.
In the present study, the prevalence of self-reported STDs was signifi cantly higher among women, corrobo-rating the fi ndings of IBOPE survey on AIDS/STDs that found that 21% of men compared to 62% of women had already had a sex organ/urinary condition.a
Tanfer et al,23 in 1995, based on two US national
re-search studies, showed that, after controlling for sexual behavior and care with one’s own health, STD self-re-porting varies according to gender, race and socioeco-nomic condition. These authors have also emphasized the importance of number of lifetime sexual partners and socioeconomic condition for the occurrence of STDs.24 In the present study, a signifi cant difference was
evidenced in the “number of lifetime sexual partners” between men and women, and this covariate was of greater magnitude when men reported having had six or more partners in their lifetime.
In the fi nal logistic model, the covariate “region of residence” was independently associated to STDs both in men and women. However, it showed a greater effect on men living in the South region and women living in the state of São Paulo. The association between re-gion of residence and STDs was not further discussed due to the lack of additional studies that would allow comparisons between Brazilian regions.
The covariates “lower family income” and “history of physical violence” had a stronger impact among wom-en, confi rming, as pointed out by Quinn & Overbaugh21
(2005), that poverty/inadequate income and violence can be social determinants of women’s vulnerability globally. These factors act together with other key aspects such as sexual and cultural behavior practices that promote discrimination and inequality.11
Additionally, the covariate “age group” was found to be associated to higher rates of STDs, especially among men. Bradner & Lindberg2 (2000) compared
the fi ndings of a national longitudinal study on male adolescents in the United States with subjects followed
up since the age of 15, and found that non-adolescent males were less likely to receive prevention education on AIDS or STDs when compared to adolescents.
“Self-perceived AIDS risk” and “HIV testing” were significantly associated to STD reporting, mostly among men. Although these covariates can be consid-ered markers of risk perception, perception of vulner-ability is not always a motivation for engaging in safe behavior.13
A 2002 population-based health survey comprising subjects aged 20 years or more living in the metro-politan area of Pelotas, Southern Brazil, assessed STD symptom prevalence and associated factors. It was found 13.5% STD prevalence, which was higher among
younger women and those with lower schooling.4
The present study and Carret et al4 fi ndings are
consis-tent regarding higher prevalence of STD symptoms in women; however they contrast with respect to higher prevalence of symptoms among those younger and less educated, which was found in the Pelotas study. These discrepancies could be explained by different population samples (Brazilian urban population vs. urban popula-tion of a medium-size city), different approaches and instruments (questionnaire applied by an interviewer vs. self-applied questionnaires) and even data analyses following distinct weighing criteria and adjustments.4
In a study carried out in Salvador,7 Northeast
Bra-zil, men reported STDs at a higher rate than women recruited in similar settings. As in the present study, however, male respondents were less likely to report symptoms that would be associated to STDs.
The present study did not fi nd any association between sexual behaviors and practices in the 12 months prior to the interview and self-reported STDs. Such an as-sociation can be commonly found in cross-sectional studies, especially those based on information obtained at different time periods. While being more compre-hensive and representative, national surveys do not allow to exploring the dynamics of behavioral changes during the lifetime of subjects and their partners. The implementation and integrated analysis of in-depth comprehensive ethnographic or epidemiological studies are key strategies for better understanding the subtleties of human sexuality and potential risks to sexual and reproductive health.
1. Boily MC, Anderson RM. Human immunodefi ciency virus transmission and the role of other sexually transmitted diseases. Measures of association and study design. Sex Transm Dis. 1996;23(4):312-32.
2. Bradner CH, Ku L, Lindberg LD. Older, but not wiser: how men get information about AIDS and sexually transmitted diseases after high school. Fam Plann Perspect. 2000;32(1):33-8.
3. Bussab W de O, Grupo de Estudos em População, Sexualidade e Aids. Plano amostral da Pesquisa Nacional sobre Comportamento Sexual e Percepções sobre HIV/Aids, 2005. Rev Saude Publica.
2008;42(Supl 1):12-20.
4. Carret MLV, Fassa AG, Silveira DS, Bertoldi AD, Hallal PC. Sexually transmitted diseases symptoms in adults: prevalence and risk factors. Rev Saude Publica. 2004;38(1):76-84.
5. Cook RL, May S, Harrison LH, Moreira RI, Ness RB, Batista S, et al. High prevalence of sexually transmitted diseases in young women seeking HIV testing in Rio de Janeiro, Brazil. Sex Transm Dis. 2004;31(1):67-72.
6. Crossman SH. The challenge of pelvic infl ammatory disease. Am Fam Physician. 2006;73(5):859-64.
7. Codes JS, Cohen DA, Melo NA, Teixeira GG, Leal AS, Silva TJ, et al. Detecção de doenças sexualmente transmissíveis em ambientes clínicos e não clínicos na Cidade de Salvador, Bahia, Brasil. Cad Saude Publica. 2006;22(2):325-34.
8. Eng TR, Butler WT. The Hidden epidemic: confronting sexually transmitted diseases. Washington, DC: National Academy Press; 1997.
9. Fennema JS, van Ameijden EJ, Coutinho RA, van den Hoek JA. Validity of self-reported sexually transmitted diseases in a cohort of drug-using prostitutes in Amsterdam: trends from 1986 to 1992. Int J Epidemiol. 1995;24(5):1034-41.
10. Fleming DT, Wasserheit JN. From epidemiological synergy to public health policy and practice: the contribution of other sexually transmitted diseases to sexual transmission of HIV infection. Sex Transm Infect. 1999;75(1):3-17.
11. França Junior I, Calazans G, Zucchi EM, Grupo de Estudos em População, Sexualidade e Aids. Mudanças no âmbito da testagem anti-HIV no Brasil entre 1998 e 2005. Rev Saude Publica. 2008;42(Supl 1):84-97.
12. Franks P, Gold MR, Fiscella K. Sociodemographics, self-rated health, and mortality in the US. Soc Sci Med. 2003;56(12):2505-14.
13. Gerrard M, Gibbons FX, Bushman BJ. Relation between perceived vulnerability to HIV and precautionary sexual behavior. Psychol Bull. 1996;119(3):390-409.
14. Gregson S, Nyamukapa CA, Garnett GP, Mason PR, Zhuwau T, Carael M, et al. Sexual mixing patterns and sex-differentials in teenage exposure to HIV infection in rural Zimbabwe. Lancet. 2002;359(9321):1896-903.
15. Harrington KF, DiClemente RJ, Wingood GM, Crosby RA, Person S, Oh MK, et al. Validity of self-reported sexually transmitted diseases among African American female adolescents participating in an HIV/STD prevention intervention trial. Sex Transm Dis. 2001;28(8):468-71.
16. Hobbs CG, Sterne JA, Bailey M, Heyderman RS, Birchall MA, Thomas SJ. Human papillomavirus and head and neck cancer: a systematic review and meta-analysis. Clin Otolaryngol. 2006;31(4):259-66.
17. Jamison DT, Breman JG, Measham AR, Alleyne G, Claeson M, Evans DB, et al. editors. Disease control priorities in developing countries. Washington, DC: World Bank Publications; 2006.
18. Moherdaui F, Vuylsteke B, Siqueira LF, dos Santos Junior MQ, Jardim ML, de Brito AM, et al. Validation of national algorithms for the diagnosis of sexually transmitted diseases in Brazil: results from a multicentre study. Sex Transm Infect. 1998;74(Suppl 1):S38-43.
19. Moodley P, Sturm AW. Management of vaginal discharge syndrome: how effective is our strategy? Int J Antimicrob Agents. 2004;24(Suppl 1):S4-7.
20. Padian NS, Shiboski SC, Hitchcock PJ. Risk factors for acquisition of sexually transmitted diseases and development of complications. In: Wasserheit JN, Aral SO, Holmes KK, editors. Reseach issues in human behavior and sexually transmitted diseases in the AIDS era. Washington, DC: American Society for Microbiology; 1991.
21. Quinn TC, Overbaugh J. HIV/AIDS in women: an expanding epidemic. Science. 2005;308(5728):1582-3.
22. Quinn TC. Association of sexually transmitted diseases and infection with the human immunodefi ciency virus: biological cofactors and markers of behavioural interventions. Int J STD AIDS. 1996;7(Suppl 2):17-24.
23. Rodrigues CS, Guimaraes MD; Grupo Nacional de Estudo sobre Sifi lis Congenita. Positividade para sífi lis em puérperas: ainda um desafi o para o Brasil. Rev Panam Salud Publica. 2004;16(3):168-75.
24. Tanfer K, Cubbins LA, Billy JOG. Gender, race, class and self-reported sexually transmitted disease incidence. Fam Plann Perspect. 1995;27(5):196–202.
REFERENCES
Article based on the data from the survey “Comportamento sexual e percepções da população brasileira sobre HIV/Aids (Sexual behavior and perceptions of Brazilian population on HIV/AIDS)”, sponsored by the Brazilian Ministry of Health through the Centro Brasileiro de Análise e Planejamento (Process n. ED 213427/2004).
This article followed the same peer-review process as any other manuscript submitted to this journal, anonymity was guaranteed for both authors and reviewers.

![Table 4 summarizes estimates of the logistic regression model for men and women. The variables independently associated to STDs were as follows: older age in men (adjusted odds ratio [OR] 3.60; 95% CI: 2.62;4.95);](https://thumb-eu.123doks.com/thumbv2/123dok_br/19034134.476384/6.812.402.705.122.591/summarizes-estimates-logistic-regression-variables-independently-associated-adjusted.webp)
