PERFORMANCE OF CEMENT MORTARS REPLACED
BY GROUND WASTE BRICK IN DIFFERENT
AGGRESSIVE CONDITIONS
ILHAMI DEMIR, #
HASBI YAPRAK*, OSMAN SIMSEK** Department of Civil Engineering, Kırıkkale University, Kırıkkale, Turkey *Kastamonu Vocational School, Kastamonu University, Kastamonu, Turkey,
**Faculty of Technology, Gazi University, Ankara, Turkey
#E-mail: [email protected]
Submitted October 12, 2010; accepted July 3, 2011
Keywords: Amonium nitrate, Compressive strength, Expansion, Ground waste brick, Sodium sulfate
This article investigates the sulphate resistance of cement mortars when subjected to different exposure conditions. Cement mortars were prepared using ground waste brick (GWB) as a pozzolanic partial replacement for cement at replacement levels of 0%, 2.5%, 5%, 7.5, 10%, 12.5 and 15%. Mortar specimens were stored under three different conditions: continuous curing in lime-saturated tab water (TW), continuous exposure to 5% sodium sulphate solution (SS), and continuous exposure to 5% ammonium nitrate solution (AN), at a temperature of 20 ± 3 ºC, for 7, 28, 90, and 180 days. Prisms with dimensions of 25×25×285 mm, to determine the expansions of the mortar samples; and another set of prisms with dimensions of 40×40×160 mm, were prepared to calculate the compressive strength of the samples. It was determined that the GWB replacement ratios between 2.5% and 10% decreased the 180 days expansion values. The highest compressive strength values were found for the samples with 10% replacement ratio in the TW, SS, and AN conditions for 180 days. The microstructure of the mortars were investigated using scanning electron microscopy (SEM) and the Energy dispersive X-ray (EDX).
INTRODUCTION
Concrete is by far the most important building material. Worldwide, more than 10 billion tons are produced each year[1].
Minimising the environmental impact and energy- and CO2-intensity of concrete used for construction is
becoming increasingly important as resources decline and the impact of greenhouse emissions becomes more evident[2].
The mechanical and durability properties of mortars and concrete, in both their fresh and hardened states, can be improved through a process whereby mineral additives are incorporated into the mortars and the concrete. This process of incorporating mineral additives can also lead to a reduction in CO2 emissions and in energy
consumption, and thus, decrease the unfavorable effects on the environment for which cement manufacturing is held responsible[3, 4].
Durability deiciency of concrete materials, which
may result in premature failure and serviceability problems, is a major concern in development of sustainable infrastructure systems. Sulphate attack is one of the phenomena that may cause gradual but severe damages to concrete structures [5].
According to Mehta and Monterio [6], sulphate attack manifests itself with an expansion as a result of the formation of ettringite and gypsum, and a loss of strength and mass as a result of the deterioration of the cohesiveness of the cement matrix.
As is well known [7, 8, 9], ammonium nitrate solutions are very corrosive to cementitious materials and lead to dissolution of cement-based materials. The reaction products are calcium nitrate and ammonia, both of which are easily dissolved in water. The consequence is progressive leaching of Portlandite and C–S–H, which cause a decrease of the mechanical properties of concrete.
When ammonium nitrate, NH4NO3, reacts with the
cement paste through ex-change reactions, this results in the formation of a calcium salt, namely, Ca(N03)2, and
the release of gaseous ammonia, NH3. Then, calcium
nitrate reacts with the hydrated aluminates and forms an expansive calcium nitro-aluminate which is formulated empirically as 3CaO.Al2O3.Ca(NO3)2.10H2O [10].
If fully hydrated, PC produces CH of about 28% of its own weight, although in practice, in fully mature
concrete, this igure would normally not exceed 20%.
CH liberated by the hydration of PC does not make a
signiicant contribution to strength and can be harmful
to concrete durability. Its elimination or reduction by reaction with the pozzolan can result in greatly enhanced durability and strength [11].
One way of reducing the potentially deleterious components responsible for the expansion is the use of pozzolanic cement replacement materials. Pozzolanic cement replacement materials do not only reduce the amount of alumina and lime that are available for reaction by the “dilution effect,” but also consume CH as a result of the pozzolanic reaction that produces additional cementing C–S–H gel [12].
Kostuch et al.’s [13] results show that 20 % replace-ment of cereplace-ment by MK is required to remove all the CH in concrete in 28 days.
In this study, samples of cement mortars were produced as a replacement for cement by using different ratios of ground waste brick which was obtained from waste brick. These cement mortars were exposed to different treatments, namely with tap water, sodium sulphate, and ammonium nitrate, for 7, 28, 90, and 180 days, after which the expansions formed in the mortar bars were measured and the compressive values of the
mortar prisms were determined as the inal step. The
microstructure of the mortars were investigated using scanning electron microscopy (SEM) and the Energy dispersive X-ray (EDX)
EXPERIMENTAL Materials
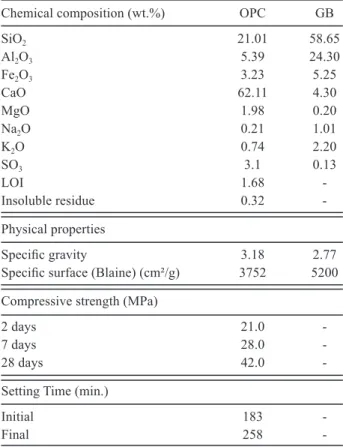
Standard sand that is compatible with TS EN 196-1, CEM I 42.5N (OPC) cement, tap water (TW), and ground waste brick (GWB) were used in this study, the chemical composition and physical properties are presented in Table 1.
Test methods
In this experimental study, GWB was used as the mineral additive material to replace cement, in ratios of 0.0, 2.5, 5.0, 7.5, 10.0, 12.5, and 15.0%. The consistency, setting, and volume expansion values of the cement mortars were determined in accordance with TS EN 196-3 [14]. The cement mortar mixtures were prepared by using standard sand, cement, and water, respectively, with ratios of 3:1:0.5.
To determine the expansions of the mortar samples, prisms with dimensions of 25×25×285 mm and compa-tible with ASTM C 1012 [15], were produced, while another set of prisms with dimensions of 40×40×160 mm and prepared according to TS-EN 196-1 [16] were produced to calculate the compressive strength of the
samples. Seven different types of mixtures were prepared and three samples for each series were moulded. The samples produced were stored at 20 °C for 24 hours after which they were removed from the moulds and left to maturate under 3 different conditions (at a temperature of 20 ±3 ºC, for 7, 28, 90, and 180 days):
1. continuous curing in lime-saturated tab water (TW), 2. continuous exposure to 5% sodium sulphate solution
(SS),
3. continuous exposure to 5% ammonium nitrate solution (AN).
The pH value of the sulphate and ammonium nitrate solutions was kept within the range of 6–8 by replacing the solution with a fresh one when needed.
Cement pastes with different replacement ratios were determined in compatibility with the TS-EN 196-3 standard while the 7, 28, 90, and 180 days compressive strength values of prisms, maturated under three different conditions, were obtained according to the TS-EN 196-1 standard.
In order to investigate the products of hydration, after 180 days exposure to TW, 5% SS, and 5% AN solutions, Scanning electron microscopy (SEM) and Energy dispersive X-ray (EDX) were performed on the paste samples.
Table 1. Chemical composition and physical properties of OPC and GWB.
Chemical composition (wt.%) OPC GB
SiO2 21.01 58.65
Al2O3 5.39 24.30
Fe2O3 3.23 5.25
CaO 62.11 4.30
MgO 1.98 0.20
Na2O 0.21 1.01
K2O 0.74 2.20
SO3 3.1 0.13
LOI 1.68
-Insoluble residue 0.32
-Physical properties
Speciic gravity 3.18 2.77
Speciic surface (Blaine) (cm²/g) 3752 5200
Compressive strength (MPa)
2 days 21.0
-7 days 28.0
-28 days 42.0
-Setting Time (min.)
Initial 183
-RESULTS AND DISCUSSION Consistency, setting, and volume expansion
properties of the cement pastes
The consistency, settings, and expansion characte-ristics of the cement pastes with different replacement ratios are presented in Table 2. The increase in GWB ratio caused an increase in the amounts of consistency water required by the mixture. This can be attributed to
the porosity and ineness of GWB [17].
It can be observed from Table 2 that a linear
relationship exists between the consistency periods and GWB replacement ratios. Furthermore, GWB replacement with ratios exceeding 10% increased the expansion values.
The effect of TW, SS and AN on the expansion of the cement mortars with GWB substitution
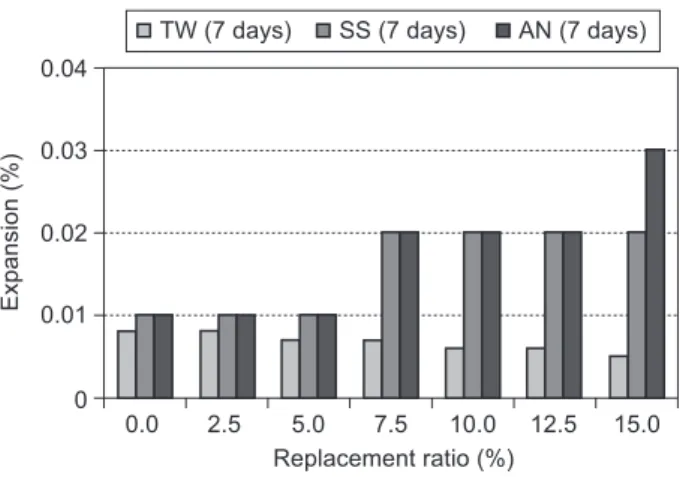
The 7, 28, 90, and 180 days expansion values of the cement mortars that were immersed in TW, 5% SS and AN solutions are presented in Figures 1, 2, 3 and 4, respectively.
When the 7 days expansion values of the mortar prisms were examined, it was observed that the highest expansion occurred in the non GWB substituted prisms immersed in TW, and that the expansion values decreased as the GBW substitution ratio increased. Among the prisms immersed in SS and AN solutions, prisms with 0.0%.
2.5%, 5%, 7.5%, 10% and 12.5% GBW substitution were observed to have parallel expansion values. While an expansion value of 0.03% was obtained for the prisms with 15% GWB substitution immersed in AN solution, an expansion value of 0.02% was obtained for the prisms
immersed in SS solution. These indings indicate that
GWB is not effective in reducing expansion values in the early maturation stages of mortar.
The expansion values of mortar prisms immersed in TW for 28 days decreased as the GBW substitution ratio increased. In the 0.0% substituted prisms, AN was observed to affect the expansion of the prisms.
The lowest expansion values for the prisms immersed in SS and AN solution were found to be for the 2.5% and 5.0% GWB substituted samples. SS was found to cause a 0.01% expansion in mortar samples, whereas AN was found to cause a 0.02% expansion. The highest expansion value, 0.05%, was found to be for 15.0% GWB substituted mortars. Higher expansion values were observed for prisms immersed in AN solution. Thus, GWB substitution of 2.5% and 5.0% in samples immersed for 28 days in SS and AN were observed to be effective in reducing expansion.
When the expansion values of 90 days maturated samples were examined, it was observed that SS and AN solutions increased the expansion values as the samples maturate. Among the prisms immersed in SS solution, the expansion values of those with 5%, 7.5% and 10% GWB substitution were observed to be the same. The lowest expansion value was observed in the 7.5% GWB substituted prisms immersed in AN solution. AN solution was observed to result in more evident expansion values of prisms in samples of 90 days, as well. The expansion values of samples immersed in TW are observed to drop according to the increasing ratio of GWB substitution. Table 2. Properties of cement paste.
GWB Setting times (min) Consistency Expansion (%) Initial Final water (cc) (%)
0.0 141 222 140 1
2.5 147 231 145 1
5.0 150 237 150 1
7.5 156 246 153 1
10.0 162 252 155 2
12.5 165 258 158 2
15.0 171 264 160 3
0.0 2.5 5.0
Replacement ratio (%)
TW (7 days) SS (7 days) AN (7 days)
E
x
p
a
n
s
io
n
(
%
)
7.5 10.0 12.5 15.0 0
0.01 0.02 0.03 0.04
0.0 2.5 5.0
Replacement ratio (%)
E
x
p
a
n
s
io
n
(
%
)
7.5 10.0 12.5 15.0 0
0.01 0.02 0.03 0.04 0.05 0.06
TW (28 days) SS (28 days) AN (28 days) Figure 1. 7 days expansion of the GWB replaced cement mortars maturated under different curing conditions.
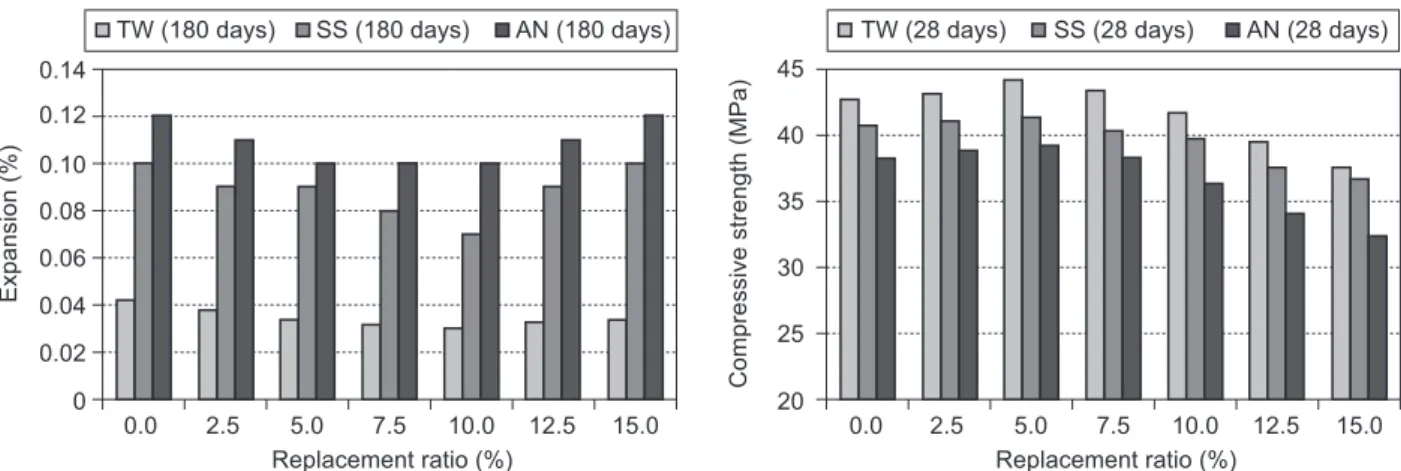
In 180 day maturated prisms, AN was observed to
signiicantly increase the expansion values. The highest
expansion value, 0.012%, was obtained for prisms with 0.0% and 15% GWB susbtitution immersed in AN solution. The lowest expansion value was observed in 0.0% and GWB susbtituted samples immersed in TW. Among samples immersed in AN solution, the expansion values of those with 5%, 7.5% and 10% GWB substitution were lower and closer to each other. The lowest expansion value for the samples immersed in SS solution was found to be for prisms with 10% GWB substitution.
It is observed that the decrease in the total amount of C3A depending on the ratio of GWB substitution, as well
as the decrease in the amount of CH and the amount of capillar pores resulting from the formation of secondary C-S-H as a result of pozzolanic reaction play a role in the reduction of expansion that occurs in prisms immersed in SS and AN solutions for 28, 90 and 180 days.
The effect of GWB on the compressive strength values of cement mortars
The 7, 28, 90, and 180 days compressive strength values of the cement mortars with GWB replacements are presented in Figures 5, 6, 7, and 8, respectively.
The 7 days compressive strength values of the cement mortars with 0% GWB replacement (control), maturated in TW, SS, and AN conditions, were observed to be high; and the compressive strength values displayed a decrease depending on the decrease in the replacement ratios. The highest compressive strength value in this group was obtained as 33.24 MPa from the mortar with 0% GWB replacement (control) in the TW condition. On the other hand, the lowest strength was found to be 25.0 MPa for the 15% GWB replaced sample in the AN condition.
When all the cure conditions and replacement ratios were evaluated together, it was found that the 28
0.0 2.5 5.0
Replacement ratio (%)
E x p a n s io n ( % )
7.5 10.0 12.5 15.0 0 0.01 0.02 0.03 0.04 0.05 0.06 0.07 0.08 0.09
TW (90 days) SS (90 days) AN (90 days)
0.0 2.5 5.0
Replacement ratio (%)
C o m p re s s iv e s tr e n g th ( M P a )
7.5 10.0 12.5 15.0 20 25 30 35 40 45
TW (28 days) SS (28 days) AN (28 days)
0.0 2.5 5.0
Replacement ratio (%)
E x p a n s io n ( % )
7.5 10.0 12.5 15.0 0 0.02 0.04 0.06 0.08 0.10 0.12 0.14
TW (180 days) SS (180 days) AN (180 days) Figure 3. 90 days expansion of the GWB replaced cement mortars that are maturated under different curing conditions.
Figure 6. 28 days compressive strength of the GWB replaced cement mortars maturated under different curing conditions. Figure 4. 180 days expansion of the GWB replaced cement
mortars maturated under different curing conditions.
0.0 2.5 5.0
Replacement ratio (%)
C o m p re s s iv e s tr e n g th ( M P a )
7.5 10.0 12.5 15.0 20 22 24 26 28 30 32 34
TW (7 days) SS (7 days) AN (7 days)
days compressive strength values increased when the GWB replacement ratio exceeded 5%. The compressive strength values of the samples maturated in the TW condition were measured to be higher than the values of the samples maturated in the SS and AN conditions. The lowest compressive strenght values were obtained for the samples that were exposed to AN conditions. The highest compressive strength values, which were for the mortar samples with 5% GWB replacement, were determined to be 44.2 MPa, 41.4 MPa, and 39.2 MPa, respectively, in the TW, SS, and AN conditions.
When the replacement ratios of the mortar mixtures exceeded 7.5%, a decrease was observed in the 90 days compressive strength values. When all the replacement ratios were considered, the lowest strengths were measured for the samples maturated in the AN condition. On the other hand, when the 90 days strength values of the mortars were compared according to their maturation solutions, higher strength values were obtained for the mortars kept in the TW condition than for those kept in the SS and AN water cure.
180 days compressive strength values increased up to the replacement ratio of 10%. However, the values decreased at higher replacement ratios. Nonetheless, strength values that were higher than that of the control sample were obtained for the replacement ratios up to 15% GWB. It was determined that the SS and AN conditions decreased the compressive strength values of the mortars. GWB replacement, although limited, was observed to lead to an increase in the mechanical strength values of the mortars. The highest compressive strength values for the samples with 10% replacement ratio were found to be 55.1 MPa, 52.8 MPa, and 47.1 MPa in the TW, SS, and AN conditions, respectively.
When GWB is added to cement, GWB reacts with calcium hydroxide in a moist environment and forms secondary C–S–-H. Through a pozzolanic reaction, secondary C–S–H gel is forms, but it is less dense than the primary C–S–H gel. As the pozzolanic reaction results in the consumption of CH, less gypsum is formed. In addition, when CH is consumed, it reduces the leaching of CH and C–S–H by AN. The partial substitution of the cement by a pozzolanic material involves a reduction in the C3A content as well. Thus, CH consumption reduces
the pH, and the ettringite becomes less expansive. A ilm
or a coating on the alumina-rich and other reactive phases is formed by the secondary C–S–H. Consequently, the formation of secondary C–S–H, reduce the permeability
and increases the densiication of the materials makes it
harder for agressivets to penetrate them.
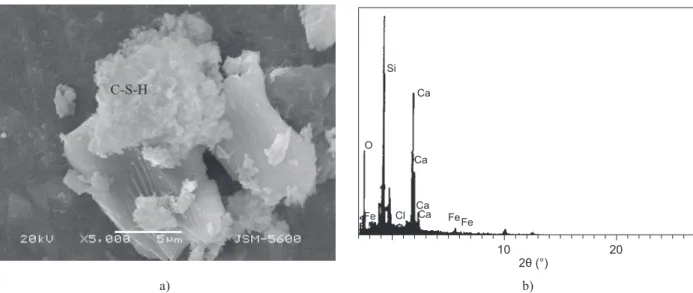
SEM and EDX analysis of the cement pastes In order to examine the characteristics of the micro-structure of the mortar prisms, the SEM images and EDX analyses of the prism are presented in Figures 9, 10, 11 and 12. The microstructure tests were performed on the 10% GWB substituted mortar samples that yielded the highest compressive strength in the compressive strength test conducted after they had been immersed in TW, and SS and AN solutions of a concentration of 5% for a period of 180 days. In the SEM image of the no GWB containing prism immersed in AN fr 80 days presented in Figure 9a, cracks are observed. These cracks in 0% GWB substituted cement mortar prisms are caused by expansive calcium nitroaluminate (3CaO·Al2O3·Ca
(NO3)2·10H2O), which forms during immersion of these
prisms in AN solution. In the EX nalysis presented in Figure 9b, CaO is 59% and SiO2 is 30%. As a result of
AN’s consumption of the leaching of C–S–H, the SiO2
ratio exhibits a decreasing tedency.
In Figure 10a, the SEM image of a 10% GWB substituted prism immersed in TW for 180 days is presented. The SEM image shows that the C–S–H crystals are of a dimension of 20-25 micron and that they are randoml orered. The EDX analysis in Figure 10b shows that CaO and SiO2 peak and that the ratios of CaO
0.0 2.5 5.0
Replacement ratio (%)
7.5 10.0 12.5 15.0 20 25 30 35 40 45 50 55
TW (90 days) SS (90 days) AN (90 days)
C o m p re s s iv e s tr e n g th ( M P a )
Figure 7. 90 days compressive strength of the GWB replaced cement mortars maturated under different curing conditions.
0.0 2.5 5.0
Replacement ratio (%)
C o m p re s s iv e s tr e n g th ( M P a )
7.5 10.0 12.5 15.0 30 35 40 45 50 55
TW (180 days) SS (180 days) AN (180 days)
O Si
Ca
Ca
Cl Ca
Ca Fe Fe
10 20
2θ (°) Fe
O Si
Ca
Ca
Cl Ca
Ca FeFe
10 20
2θ (°) Fe
O Si
Ca
Ca
Cl Ca
Ca Fe Fe
10 20
2θ (°) Fe
a)
a)
a)
b)
b)
b)
Figure 9. The SEM micrograph (a) and EDX proile (b) of the GWB 0.0% cement mortar immersed in a 5% AN solution for 180 days.
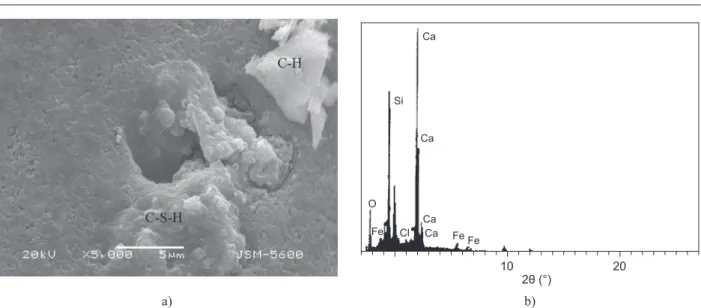
Figure 10. The SEM micrograph (a) and EDX proile (b) of the GWB 10% cement mortar immersed in TW for 180 days.
and SiO2 are 32% and 55%, respectively. The increase in
the ratio of SiO2 indicates the density of the C–S–H gels.
The secondary C–S–H gels that are formed as a result of the pozzolanic reaction that GWB forms with CH has increased the C–S–H gels and decreased the amout of CH.
The SEM image presented in Figure 11a shows the microstructure of a 10% GWB substituted cement mortar immersed in SS solution for 180 days. In the SEM image, the C–S–H and CH crystals are seen together. No ettringite crystals are observed Inthe EDX analysis presented in Figure 11b, the CaO and SiO2 ratios appear
as 47% and 41%, respectively. Due to the iller effect of
GWB substitution and the pozzolanic reaction, a denser cement matrix was formed, which prevented the SS solution to form ettringie in the prisms.
Figure 12a shows the SEM image of 10% GWB cement mortar immersed in AN solution for 180 days. In the image, C–S–H and CH crystals are observed. It is seen that AN solution is effective on C–S–H crystals due to the leaching of C–S–H. Therefore, AN solution is also observed to reduce the mechanic compression strength of he risms. In the EDX analysis in Figure 12b, the CaO ratio is 40% and the SiO2 ratio is 47%. These
ratios indicate the decrease in the amount of C–S–H gel formed.
CONCLUSIONS
The indings obtained from this experimental study
are summarized below.
1. GWB has a high ineness, and its speciic weight is
lower than that of the cement, both of which increased the amounts of consistency water in relation with the increase in the GWB replacement ratio.
2. The increase in the GWB amount was effective on
increasing the initial and inal setting times.
3. When over 10%, GWB had a negative effect on the stability of the volume of the cement paste.
4. When the 28 days strength values were considered, an improvement in the compressive strengths was possible for the 7.5% GWB replacement. Yet, when the 90 and 180 days strength values were examined, an improvement was observed for GWB replacement ratios of 10-15%.
5. In the cement composites that were under the effect of the aggressive condition, the existence of GWB up to the ratio of 15% would increase the strength values of these materials against aggressive conditions.
6. Although this increase in the strength values is limited,
it is signiicant for the improvement of the durability
of the cement.
7- The reuse of the brick wastes as an alternative material is thought to contribute to both the reduction of the effects that wastes have on the environment and, in terms of sustainability, to the protection of raw material sources.
References
1. Meyer C.: Cement & Concrete Composites 31, 601, (2009). 2. Berndt M.L.:Construction and Building Materials 23,
26063, (2009).
3. Mehta P.K.: Concr. Int. 21, 47 (1999).
4. Toledo Filho R.D., Gonçalves J.P., Americano B.B., Fbairn: Cement Concrete Research 37, 1357 (2007).
5. Bonakdar A., Mobasher B.: Construction and Building Materials 24, 61 (2010).
6. Mehta P.K., Monterio P.J..: Concrete, 2nd
ed., McGraw Hill, New York (1993).
7. Lea F.M.: The Chemistry of Cement and Concrete, 3rd edn. O
Si Ca
Ca
Cl Ca
Ca Fe Fe
10 20
2θ (°) Fe
a) b)
Figure 12. The SEM micrograph (a) and EDX proile (b) of the GWB 10% cement mortar immersed in a 5% AN solution
Edward Arnol London (1970). 8. Taylor H.F.W.: Cement Chemistry, 2nd
ed. Thomas Telford Publishing, London, (1990).
9. Schneider U., Chen S.W.: American Concrete Institute, ACI Materials Journal 96, 47 (1999).
10. Carde C., Escadeillas G., François R.: Magazine of Con-crete Research 49, 295 (1997).
11. Sabir B.B., Wild S., Bai J.: Cement and Concrete Com-posites 23, 441 (2001).
12. O’Farrell M., Wild S., Sabir B.B.: Cement and Concrete Research 29, 1781 (1999).
13. Kostuch J.A., Walters G.V., Jones T.R.: High Performance Concrete Incorporating Metakaolin - a Review, p. 1799,
University of Dundee 1993.
14. EN TS 196–3, Methods of testing cement-Part 3: Determination of setting time and soundness, Ankara, Turkey, (2002), [in Turkish].
15. ASTM C 1012 Standard Test Method for Length Change of Hydraulic-Cement Mortars Exposed to a Sulphate Solution, Annual Book of ASTM Standards, (2000). 16. EN TS 196–1, 1 Methods of testing cement-Part 1:
Determination of strength, Ankara, Turkey, (2002), [in Turkish].