CLINICAL SCIENCE
A comparison between sphygmomanometer-based
and ambulatory blood pressure monitoring in acute
salt loading and depletion protocol
Carlos Eduardo Paiva,IAndre´ia Fernanda Carvalho Leone Aguiar,I Fernando Nobre,IIEduardo Barbosa CoelhoI
IDisciplina de Nefrologia, Departamento de Clı´nica Me´dica, Faculdade de Medicina de Ribeira˜o Preto, Universidade de Sa˜o Paulo, Brazil.IICardiologia,
Departamento de Clı´nica Me´dica, Faculdade de Medicina de Ribeira˜o Preto, Universidade de Sa˜o Paulo, Brazil.
INTRODUCTION: Ambulatory blood pressure monitors have been used in salt loading and depletion protocols. However, the agreement between measurements made using ambulatory blood pressure monitors and those made with the sphygmomanometer has not been evaluated.
OBJECTIVE: The objective of this study was to compare the concordance of the two methods of blood pressure measurements in protocols of acute salt loading and depletion.
METHOD:Systolic blood pressure was measured using a sphygmomanometer at the completion of salt infusion (2 L NaCl 0.9%, 4 h) and salt depletion (furosemide, 120mg/day, p.o.) in 18 volunteers. Using the Pearson correlation coefficient (r), these readings were compared with the mean systolic blood pressure measured using the ambulatory blood pressure monitoring device during the following periods: 4 h of saline infusion and 12 h of salt depletion; 4 h of saline infusion and the last 6 h of salt depletion; 12 h of salt loading and the last 6 h of depletion; 12 h of salt loading and 12 h of depletion. Salt sensitivity was defined by a difference in the systolic blood pressure between salt loading and salt depletion greater than 10 mmHg when measured with the sphygmomanometer, and the Kappa analysis of concordance (K) was used with a significance level of P,0.05.
RESULTS: Only the blood pressure readings obtained using the ambulatory blood pressure device during 4 h of intravenous NaCl and during 12 h of salt depletion showed a high correlation with the variation in the systolic blood pressure measured by the sphygmomanometer, with a full agreement with the salt sensitivity classification (r= 0.71; P = 0.001 and K = 1).
CONCLUSION: In acute salt loading and depletion protocols, an ambulatory blood pressure monitoring device should be used to record the blood pressure during the 4-h interval of salt infusion and 12-h interval of salt depletion.
KEYWORDS: Blood Pressure; Blood Pressure Monitoring; Salt Sensitivity Methodology; Salt Loading; Salt Depletion.
Paiva CE, Aguiar AFCL, Nobre F, Coelho EB. A comparison between sphygmomanometer-based and ambulatory blood pressure monitoring in acute salt loading and depletion protocol. Clinics. 2011;66(5):767-772.
Received for publication onDecember 2, 2010;First review completed onDecember 29, 2010;Accepted for publication onFebruary 7, 2011 E-mail: [email protected]
Tel.: 55 1636022543
INTRODUCTION
Salt sensitivity (SS) is a heterogeneous phenomenon characterized by a significant increase in blood pressure (BP) in response to changes in dietary salt intake or by experimental intravenous salt overload followed by
furose-mide-induced salt depletion.1 Although multiple
mechan-isms are involved in the BP response to the variation in sodium intake, an evident change in the renal tubular
transport of sodium occurs in salt-sensitive individuals (S
individuals).2In salt-resistant individuals (R individuals), a
change from a low-sodium diet (70 mmol/day) to a high-sodium diet (185 mmol/day) is accompanied by a significant reduction of sodium reabsorption by the proximal tubules. In contrast, S individuals experience a significant increase in BP and a blunted inhibition of proximal tubular sodium transport. In addition, ‘‘S normotensive individuals’’ respond to a salt load with an increased glomerular filtration rate in an attempt to compensate for the inability to block the tubular
sodium reabsorption.3The same response pattern is usually
observed in ‘‘S hypertensive individuals.’’4Epidemiological
studies have indicated a clear relationship between salt sensitivity individuals and the development of cardiac
hypertrophy and glomerular damage.5-8 In experimental
Copyrightß2011CLINICS– This is an Open Access article distributed under
studies with rats, salt loading promotes the expression of factors related to the deposition of extracellular matrix in the
mesangium, such as TGF-b, independent of changes in BP.9
Moreover, in humans, microalbuminuria is observed in
hypertensive individuals with an S pattern.10,11The presence
of SS also affects the response to antihypertensive drugs, such
as diuretics and angiotensin-converting enzyme inhibitors.12
Although clinically relevant, the identification of S indivi-duals involves exaggerated sodium consumption followed by salt depletion with the use of low-salt diets or diuretics. Although some authors have indicated better reproducibility
using alternate chronic exposure to low- or high-salt diets,13
the model of acute salt loading and depletion initially
proposed by Weinberger et al.1is widely accepted for the
identification of S individuals. In this model, volunteers are subjected to intravenous loading of 2 L of isotonic saline over a period of 4 h, and at the end of this process, BP is measured using the conventional sphygmomanometer (CS). On the next day, the volunteers are subjected to a low-salt diet (10 mmol/day) followed by three doses of oral furosemide, and CS BP is again measured at the end of this period. A difference greater than 10 mmHg between the two periods indicates the presence of SS. Because of the extensively documented various factors that interfere with the CS measurement of BP, some authors have recommended the use of the ABPM device as the best tool for assessing the BP in
acute salt loading and depletion protocols.14However, there
is no consensus about the ideal time intervals of measure-ments, and there is no clear evaluation of the agreement between the two methods of BP measurement in this context. Moreover, blood pressure measurements obtained by the Ambulatory Blood Pressure Monitoring (ABPM) are usually lower than those obtained using the CS. This could influence the determination of SS, leading to an incorrect classification. Thus, the main objective of the present study was to compare the concordance of two different methods of BP measure-ments in protocols of acute salt loading and depleting, including an evaluation of the different time intervals of BP measurements with the use of an ABPM device.
METHODS
Eighteen healthy, normotensive volunteers aged 18 to 43 years with clinical and biochemical parameters (hepatic, renal and hematologic function) within normal limits were selected for the study. The protocol was approved by the Institutional Research Ethics Committee, and the volunteers gave written informed consent to participate. The subjects were instructed to consume a diet containing a standard amount of sodium (180 mmol/day) five days before the beginning of the acute protocol. Adherence to the diet was monitored by the measurement of the 24-h urine sodium on the fifth standard diet day. On the day of acute protocol, after an overnight fast, the volunteers were asked to come to the Clinical Research Unit where they stayed for two days. Starting at 8:00 am on the first day, 2 L of 0.9% isotonic saline solution were infused into a peripheral vein over a period of 4 h. An ABPM device (Spacelabs model 90207, Washington, USA) was installed in each participant’s non-dominant arm and programmed to measure BP at 10-minute intervals for the first 12 h. At the end of the saline infusion, BP was measured with a previously calibrated mercury sphygmomanometer, and the mean value of three measurements was calculated. On the second day of the
experimental period, volunteers consumed a low-salt diet (10 mmol/day) and received three 40-mg doses of oral furosemide at 8:00 a.m., 10:00 a.m. and 2:00 p.m. The ABPM device was again installed according to the parameters described above, and the CS BP was measured at the end of salt depletion (8:00 p.m.). The patients were classified as S individuals when the difference in the CS Systolic BP (SBP) measurements between the salt loading and salt depletion
periods was.10 mmHg (DSBPdiu-salt). The CS BP
measure-ments were compared to the means obtained using the ABPM in the following combinations: SBP between the 4 h of saline infusion and the 12 h of salt depletion (DSBP4-12);
between the 4 h of saline infusion and the last 6 h of salt
depletion (DSBP4-6); between the 12 h of the salt-loading
period and the last 6 h of depletion (DSBP12-6); and between
the 12 h of the salt-loading period and the 12 h of salt
depletion (DSBP12-12). In addition to BP, blood and urine
samples were obtained at the end of the saline infusion (12:00 p.m. of day 1) and at the end of the protocol (8:00 p.m. of day 2) for the determination of sodium, creatinine, plasma renin activity and aldosterone. Sodium and creati-nine analyses were performed using a standard method. Plasma renin activity and aldosterone were determined by radioimmunoassay (DiaSorin, Minnesota, USA). Fractional sodium excretion (FENa) was determined using the
follow-ing formula: (UNa x Pcr/Ucr x PNa)6100, where UNa,
PNa, Ucr and Pcr are the concentrations of urine sodium (mMol), urine creatinine (mg/dL), plasma sodium (mMol) and plasma creatinine (mg/dL), respectively.
Data were reported as means¡SEM and were compared
using a paired t-test or ANOVA for repeated measures, followed by a Bonferroni post-test. The correlations between FENa and the variation in renin and aldosterone activity and SBP (CS or ABPM) were determined using the Pearson correlation, and the concordance between the CS and ABPM measurements during the various time intervals studied for the identification of S individuals was determined using
the Kappa (k) coefficient.15 The reference criterion used
for S individual classification was arbitrarily chosen as DSBPdiu-salt .10 mmHg. The comparison between the
ABPM SBP during the different intervals and the CS SBP
was performed using the Pearson correlation coefficient (r).
The level of significance was set at P,0.05 for all analyses.
SAS/STAT software (Version 9.0, SAS institute, USA) was used all statistical calculations.
RESULTS
This study included 18 volunteers (10 men and 8 women)
who were self-reportedly white and were on average 29¡2
years old. All of the subjects were normotensive (the SBP and
Diastolic BP (DBP) were 115¡3 mmHg and 73¡2 mmHg,
respectively) and none were obese (BMI of 25.2¡0.9 kg/m2).
The volunteers were divided into S (DSBPdiu-salt.10 mmHg)
and R groups, and their main clinical characteristics are presented in Table 1. There was no difference between the S and R groups in nutritional status, age or daily salt consumption. As expected, the S group showed a greater
reduction of DSBPdiu-salt compared to the R group
(-21.4¡3.0 mmHg vs. -5.0¡1.2 mmHg, P = 0.0006).
However, compared with the use of the CS, we observed a
smaller fall inDSBP in the S group between the salt loading
and depletion periods with use of the ABPM
illustrates the behavior of CS BP during the periods of salt loading and depletion. Salt loading increased the SBP and DBP
(P,0.05) only in the S group. Also, only the S group
experienced a decrease in the SBP and DBP with the
furosemide-induced salt depletion (P,0.05). Figure 1 shows
the behavior of the tubular sodium transport inferred by FENa. Both R and S volunteers presented elevated FENa
during salt loading (P,0.01) compared with FENa baseline
values. However, only the R group experienced a significant increase in FENa after furosemide administration when
compared with the salt loading (P,0.05). Table 2 illustrates
that there was no significant difference in the variation of the response of the renin-angiotensin-aldosterone system between the R and S groups, as measured in terms of the plasma renin activity and the plasma aldosterone values between the phases of salt loading and depletion. Table 2 also shows the behavior of the excreted sodium load during salt loading and depletion. A significant increase in the excreted sodium load was observed after salt loading, which was maintained during the phase of furosemide use, although there were no significant differences between the R and S groups.
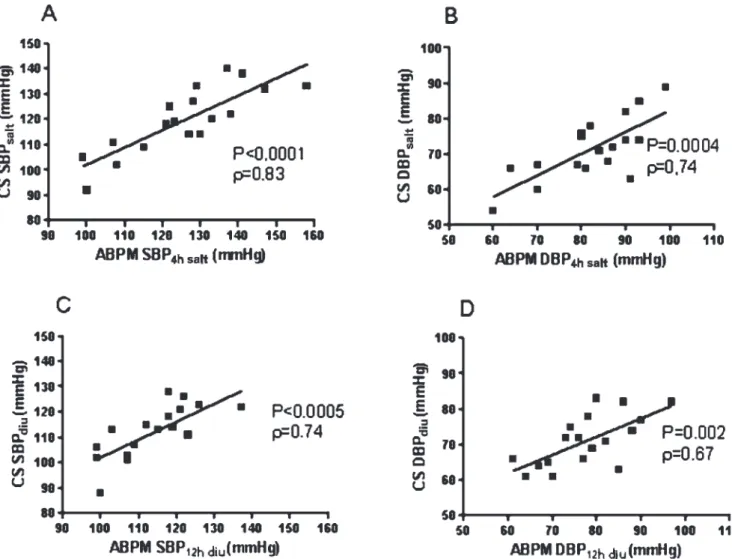
There was a significant correlation between the SBP and DBP measurements made using the ABPM and those made using the CS during the phases of salt loading and depletion for all the periods analyzed. However, the Pearson
correla-tion coefficient (r) for the different time periods showed
various results; the best correlations were observed between
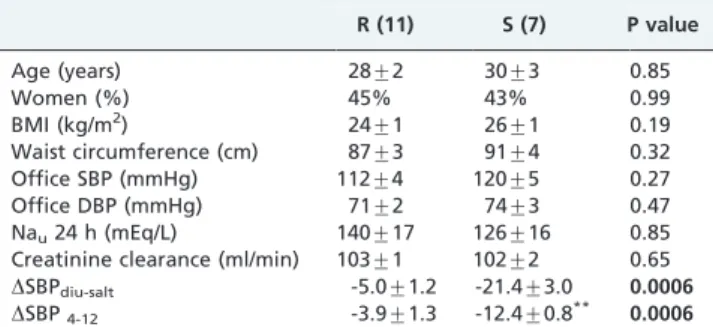
Table 1 -Clinical characteristics of the volunteers included in the study protocol. Data are reported as means¡SEM, with the number of volunteers in parentheses.
R (11) S (7) P value
Age (years) 28¡2 30¡3 0.85
Women (%) 45% 43% 0.99
BMI (kg/m2) 24
¡1 26¡1 0.19
Waist circumference (cm) 87¡3 91¡4 0.32
Office SBP (mmHg) 112¡4 120¡5 0.27
Office DBP (mmHg) 71¡2 74¡3 0.47
Nau24 h (mEq/L) 140¡17 126¡16 0.85
Creatinine clearance (ml/min) 103¡1 102¡2 0.65 DSBPdiu-salt -5.0¡1.2 -21.4¡3.0 0.0006
DSBP4-12 -3.9¡1.3 -12.4¡0.8** 0.0006 **P = 0.007DSBP
diu-saltvs.DSBP4-12
the CS SBP and the mean of the ABPM SBP measurements made during the 4 h of intravenous NaCl infusion and the mean of the ABPM SBP measurements made during the 12 h
of the salt depletion with furosemide (DSBP4-12, r= 0.71).
Figure 2 shows the correlation observed between the CS SBP and DBP and the mean ABPM BP during the phase of salt loading (4 h) and depletion with furosemide (12 h).
Table 3 shows the values of concordance (K) for the
classification of S and R usingDSBPdiu-salt.10 mmHg as the
reference cut-off value. The same cut-off value was
arbitrarily selected for ABPM. Full concordance (K= 1) with
CS SBP was observed only when the criterion for classifica-tion was based on the ABPM BP measurements during the 4 to 12-h period (DSBP4-12).
DISCUSSION
The objective of this study was to compare the con-cordance of two different methods of BP measurement in protocols of acute salt loading and depletion, including an
Table 2 -Behavior of fractional excretion of sodium (FENa%), urinary sodium excretion (UNa, mMol/h), plasma renin activity (PRA, ng/ml/h) and plasma aldosterone (pg/mL) during acute sodium loading and depletion. Data are reported as means¡SEM.
R S
Baseline Salt Diuretic Baseline Salt Diuretic
FENa (%)
0.9¡0.3 2.4¡0.3* 4.2¡0.4*# 1.0¡0.1 3.6¡0.8* 3.0¡0.3*
UNa (mMol/h) 7.5¡0.8 31.5¡3.4* 31.9¡2.6* 8.4¡1.1 46.0¡9.5* 31.1¡5.5*
PRA (ng/mL/h) - 0.9¡0.2 7.2¡2.3# - 0.7¡0.2 5.1¡3.0#
Aldosterone (pg/mL) - 44.8¡7.4 206.4¡27.0# - 70.5¡18.3 236.1¡46.7#
*P,0.05 for the salt and diuretic periods compared with the baseline period; P,0.05 for saltvs.diuretic.
evaluation of different time intervals of BP measurements with the use of an ABPM device. Our data showed that the classification of individuals as S or R, based on the measurement of the difference in SBP between the periods of salt loading and depletion using ABPM, varied according to the time interval of BP measurement. The greatest
concordance between theDSBPdiu-salt using the CS method
defined by Weinberger and an ABPM device to measure BP was the interval ofDSBP4-12.
The CSDSBPdiu-saltwas used here as the ‘‘gold standard’’
because this type of measurement has been extensively
studied in previous protocols1,8and has been shown to be
correlated with humoral markers, particularly the renin-angiotensin-aldosterone system. Furthermore, it was shown to be an independent risk factor for cardiovascular death. In
this context, Weinberg et al.8conducted a 27-year follow-up
study of a cohort of 430 normotensive individuals subjected to the acute salt loading and depletion protocol. They found that the presence of S individuals detected by this method was accompanied by an increase in cardiovascular mortality compared with R individuals.
Previous studies have suggested that the identification of S individuals can be more accurate by manipulating the sodium content of an individual’s diet.6,14However, these protocols rely on compliance with a specific diet, which results in difficult technical execution. Another relevant point for the comparison of these two methodologies is the concordance of the classification as S individuals and R individuals when the same volunteer was subjected to the two methods in a sequential manner. Weinberg et al. reported agreement between acute salt loading protocols when dietary sodium manipulations were
performed over prolonged periods of time.16However, other
studies have not had the same results and have reported a weak
concordance between the two methods.14,17
The BP measurement method may also generate an important bias of the criterion for subject classification as S individuals and R individuals. However, few studies have compared the different methods of BP measurement for this purpose. In a study of dietary salt intervention, the ABPM
measurements were more accurate than the use of office BP measurement for the classification of S individuals and R individuals an observation that was suggested to be due to the larger number of measurements obtained with the
ABPM, which may have involved a lower chance of error.13
The present study contributes to the definition of the best time interval for BP measurements when using the ABPM device in protocols of acute salt loading and salt depletion. Our data show that the time interval of BP measurements had a clear influence on the designation of S and R individuals, with the CS BP used as the standard. Analysis of the Pearson coefficient (Table 2) showed that the measurements made between the periods of 4 and 12 h, which corresponded to the peak of salt load (during the 4 h of intravenous NaCl infusion) of the first day, and the measurements obtained during the daytime of the second day were best correlated
with the variation of CS SBP between the two periods.1The
same table also shows a poor correlation between the SBP measurements corresponding to 12 h of daytime salt loading and those corresponding to 12 h of daytime salt depletion,
particularly those most frequently used in this protocol.18The
analysis of concordance (K) supported the Pearson univariate
analysis, showing full agreement between the measurements ofDSBP4-12 andDSBPdiu-salt. Despite this agreement, there
was a significant difference in theDSBP values obtained by
the two methods, with greater amplitude and dispersal of the CS measurements compared with the ABPM measurements. The results of this study do have limitations because the
sample size was small (18 individuals). Also, theDSBP value
.10 mmHg was arbitrarily established for the classification
of S. However, the ABPM BP measurements were usually lower values than those obtained with the CS, an observation that may modify the cut-off for the classification of S individuals on the basis of ABPM. Because the variation in SBP between the phases of salt loading and depletion follows a Gaussian distribution, a new study with a larger number of participants is necessary to determine the best ABPM cut-off value to distinguish R and S individuals. However, such limitations do not invalidate the observation that the best
interval for measuring BP with the ABPM isDSBP4-12.
In conclusion, the present study shows that the use of ABPM in protocols of acute salt loading and depletion should involve measurements at 10-minute intervals, with a recording of the 4-h interval of acute intravenous salt infusion and the 12-h interval of salt depletion with furosemide and setting the cut-off value for the
classifica-tion of S atDSBP4-12.10 mmHg.
ACKNOWLEDGMENTS
We wish to thank Centro de Me´todos Quantitativos da Faculdade de Medicina de Ribeira˜o Preto, Universidade de Sa˜o Paulo (CEMEq-FMRP-USP) for assistance with revisions and statistical analysis. The present study was financed by Fundacao de Apoio a Pesquisa do Estado de Sao Paulo (FAPESP) Grant 05/59269-2, Financiadora de Estudos e Projetos (FINEP) Grant 01.05.0948.00 and Fundacao de Apoio e Pesquisa do Hospital das Clı´nicas da FMRP-USP (FAEPA). No authors declared a conflict of interest.
REFERENCES
1. Weinberger MH, Miller JZ, Luft FC, Grim CE, Fineberg NS. Definitions and characteristics of sodium sensitivity and blood pressure resistance. Hypertension. 1986;8(6 Pt 2):II127-34.
2. Strazzullo P, Galletti F, Barba G. Altered renal handling of sodium in human hypertension: short review of the evidence. Hypertension. 2003;41:1000-5, doi: 10.1161/01.HYP.0000066844.63035.3A.
Table 3- Pearson correlation coefficient (r) between the variation in CSDSBPdiu-saltin a salt loading and depletion maneuver and the mean variation in SBP obtained by ABPM according to intervals of measurement (see text for details).
P value Pearsonr
DSBPdiu-saltvs.DSBP4-12 0.001 0.71
DSBPdiu-saltvs.DSBP12-12 0.02 0.53
DSBPdiu-saltvs.DSBP4-6 0.007 0.61
DSBPdiu-saltvs.DSBP12-6 0.07 0.44
Table 4 -Kappa correlation (95% CI) between the variation in CSDSBPdiu-saltin a salt loading and depletion protocol and the mean variation in SBP obtained by ABPM according to intervals of measurement (see text for details).
k 95%CI
DSBPdiu-saltvs.DSBP4-12 1 _
DSBPdiu-saltvs.DSBP12-12 0.48 (0.09 – 0.86)
DSBPdiu-saltvs.DSBP4-6 0.66 (0.31 – 1.00)
3. Barba G, Cappuccio FP, Russo L, Stinga F, Iacone R, Strazzullo P. Renal function and blood pressure response to dietary salt restriction in normotensive men. Hypertension. 1996;27:1160-4.
4. Chiolero A, Maillard M, Nussberger J, Brunner HR, Burnier M. Proximal sodium reabsorption: An independent determinant of blood pressure response to salt. Hypertension. 2000;36:631-7.
5. Bigazzi R, Bianchi S, Baldari D, Sgherri G, Baldari G, Campese VM. Microalbuminuria in salt-sensitive patients. A marker for renal and cardiovascular risk factors. Hypertension. 1994;23:195-9.
6. Morimoto A, Uzu T, Fujii T, Nishimura M, Kuroda S, Nakamura S, et al. Sodium sensitivity and cardiovascular events in patients with essential hypertension. Lancet. 1997;350:1734-7, doi: 10.1016/S0140-6736(97)05189-1. 7. Bihorac A, Tezcan H, Ozener C, Oktay A, Akoglu E. Association between salt sensitivity and target organ damage in essential hypertension. Am J Hypertens. 2000;13:864-72, doi: 10.1016/S0895-7061(00)00253-3. 8. Weinberger MH, Fineberg NS, Fineberg SE, Weinberger M. Salt
sensitivity, pulse pressure, and death in normal and hypertensive humans. Hypertension. 2001;37(2 Part 2):429-32.
9. Sanders PW. Salt intake, endothelial cell signaling, and progression of kidney disease. Hypertension. 2004;43:142-6, doi: 10.1161/01.HYP. 0000114022.20424.22.
10. Cubeddu LX, Hoffmann IS, Aponte LM, Nunez-Bogesits R, Medina-Suniaga H, et al. Role of salt sensitivity, blood pressure, and hyperinsulinemia in determining high upper normal levels of urinary albumin excretion in a healthy adult population. Am J Hypertens. 2003;16(5 Pt 1):343-9, doi: 10.1016/S0895-7061(03)00057-8.
11. Bianchi S, Bigazzi R, Amoroso A, Campese VM. Silent ischemia is more prevalent among hypertensive patients with microalbuminuria and salt sensitivity. J Hum Hypertens. 2003;17:13-20, doi: 10.1038/sj.jhh. 1001498.
12. O’Shaughnessy KM, Karet FE. Salt handling and hypertension. J Clin Invest. 2004;113:1075-81.
13. de la Sierra A, Lluch MM, Coca A, Aguilera MT, Sanchez M, Sierra C, et al. Assessment of salt sensitivity in essential hypertension by 24-h ambulatory blood pressure monitoring. Am J Hypertens. 1995;8(10 Pt 1):970-7, doi: 10.1016/0895-7061(95)00225-1.
14. de la Sierra A, Giner V, Bragulat E, Coca A. Lack of correlation between two methods for the assessment of salt sensitivity in essential hyperten-sion. J Hum Hypertens. 2002;16:255-60, doi: 10.1038/sj.jhh.1001375. 15. Koch GG, Landis JR, Freeman JL, Freeman DHJr., Lehnen RC. A general
methodology for the analysis of experiments with repeated measure-ment of categorical data. Biometrics. 1977;33:133-58, doi: 10.2307/ 2529309.
16. Weinberger MH, Stegner JE, Fineberg NS. A comparison of two tests for the assessment of blood pressure responses to sodium. Am J Hypertens. 1993;6(3 Pt 1):179-84.
17. Sharma AM, Schorr U, Cetto C, Distler A. Dietary v intravenous salt loading for the assessment of salt sensitivity in normotensive men. Am J Hypertens. 1994;7:1070-5.