Am bulato ry blo o d pre ssure and
D o pple r e cho cardio graphic inde xe s o f
bo rde rline hype rte nsive m e n pre se nting
an e xagge rate d blo o d pre ssure re spo nse
during dynam ic e xe rcise
Departamento de Ciências Fisiológicas, Centro Biomédico, Universidade Federal do Espírito Santo, Vitória, ES, Brasil F.L. Herkenhoff,
E.C. Vasquez, J.G. Mill and E.G. Lima
Abstract
Borderline hypertension (BH) has been associated with an exagger-ated blood pressure (BP) response during laboratory stressors. How-ever, the incidence of target organ damage in this condition and its relation to BP hyperreactivity is an unsettled issue. Thus, we assessed the Doppler echocardiographic profile of a group of BH men (N = 36) according to office BP measurements with exaggerated BP in the cycloergometric test. A group of normotensive men (NT, N = 36) with a normal BP response during the cycloergometric test was used as control. To assess vascular function and reactivity, all subjects were submitted to the cold pressor test. Before Doppler echocardiography, the BP profile of all subjects was evaluated by 24-h ambulatory BP monitoring. All subjects from the NT group presented normal moni-tored levels of BP. In contrast, 19 subjects from the original BH group presented normal monitored BP levels and 17 presented elevated monitored BP levels. In the NT group all Doppler echocardiographic indexes were normal. All subjects from the original BH group pre-sented normal left ventricular mass and geometrical pattern. However, in the subjects with elevated monitored BP levels, fractional shorten-ing was greater, isovolumetric relaxation time longer, and early to late flow velocity ratio was reduced in relation to subjects from the original BH group with normal monitored BP levels (P<0.05). These subjects also presented an exaggerated BP response during the cold pressor test. These results support the notion of an integrated pattern of cardiac and vascular adaptation during the development of hypertension. Co rre spo nde nce
F.L. Herkenhoff
Departamento de Ciências Fisiológicas Centro Biomédico, UFES
Av. Mal. Campos, 1468 29040-090 Vitória, ES Brasil
Fax: + 55-27-3335-7330 E-mail: ferherk@ npd.ufes.br
Research supported by Companhia Vale do Rio Doce.
Received November 4, 1999 Accepted July 10, 2001
Ke y wo rds
·Borderline hypertension ·Cardiovascular reactivity ·Laboratory stress test ·Doppler echocardiography
Intro ductio n
It is well established that cardiovascular structural and functional abnormalities oc-curring in essential hypertension are inde-pendently related to an increased risk of cardiovascular morbidity and mortality (1).
be-havioral factors, are closely related to car-diovascular adjustments (3). Impairment of systolic function eventually occurs late in the course of essential hypertension (4). In contrast, LV hypertrophy and alterations in diastolic function appear earlier in essential hypertension (5).
There are also observations supporting the concept that BP variation depends criti-cally on the level of physical and mental activity (6). Nevertheless, the role of BP variability in target organ damage is still a controversial issue. It has been reported that cardiovascular hyperreactivity to physical (7) and mental (8) stress plays a pathophysi-ological role in cardiovascular disease. Thus, the possibility that a greater elevation of BP during ordinary or exceptional life situations plays an important role in the development of hypertension is conceivable.
Laboratory stressing maneuvers have been designed for early detection of hyper-tension-prone subjects (9). In longitudinal studies, these tests have provided predictive information about the future incidence of hypertension (10). The assumption is that the cardiovascular responses in the labora-tory environment correspond to BP behavior in everyday life conditions (11,12). Dynam-ic exercise tests have been more usually employed to evaluate cardiovascular func-tion (13). In recent longitudinal studies, how-ever,an exaggerated BP response during dynamic exercise provided predictive infor-mation about the future incidence of hyper-tension and related target organ damage (14,15). The cold pressor test (CPT) is em-ployed to evaluate vascular functions in nor-motensive and hypertensive men (16). An exaggerated elevation of BP during this test is primarily determined by an increased va-soconstrictive response (17).
Borderline hypertension has been fre-quently associated with both an exaggerated BP response in the presence of laboratory stressors and changes in cardiovascular struc-ture and function (18,19). In some studies,
however, paradoxical results have been ob-tained (20,21). These inconsistent results may be related to an inappropriate assess-ment of the BP status of borderline hyperten-sive subjects or to an imprecise measure-ment of cardiovascular reactivity during labo-ratory stressors. ABPM allows a more accu-rate assessment of BP profile (22,23). By avoiding the white-coat effect, ABPM may help resolve controversial aspects regarding the relations between BP levels, cardiovas-cular reactivity and target organ damage.
Few studies have employed Doppler echocardiography to assess the impact of BP and reactivity of the cardiovascular system in borderline hypertension. Thus, the pres-ent investigation was conducted to assess cardiac structure and function in a group of borderline hypertensive men with an exag-gerated BP response during the cycloergo-metric test (CET). Vascular reactivity and function of these subjects were also assessed by the CPT. Before Doppler echocardio-graphic assessment, 24-h ABPM was re-corded in order to determine the BP profile of the subjects.
Mate rial and Me tho ds
Study po pulatio n and sample
Exer-cise, State University of Espírito Santo, in 1996-1997 for routine cardiovascular evalu-ation. The initial screening procedure con-sisted of a clinic cardiac examination by a physician. A questionnaire on personal data, health history, work activity, smoking and alcohol consumption was completed with the help of a nurse. Subjects with known or suspected cardiovascular disease, diabetes mellitus, locomotion system disorders, and pulmonary, renal, liver or other chronic dis-eases were excluded. Weight, height and other anthropometric measures were assessed with subjects in their underclothes.
The study was performed in accordance with the regulations approved by the Ethics Committee for Human Research of the State University of Espírito Santo. All subjects signed an informed consent form after the objectives and procedures of the study were explained to them.
O ffice blo o d pre ssure m e asure m e nts
BP determinations were conducted as previously described (25). A physician us-ing standardized conditions of position, rest and cuff size obtained BP measurements. Casual office SBP and DBP were measured by auscultation with a mercury column sphyg-momanometer taken respectivelyas the first and fifth Korotkoff sound. The protocol was as follows: 10 min of supine rest, with BP measured at 5 and 10 min; 10 min of seated rest, with BP measured at 5 and 10 min. The lowest level of seated BP was recorded. In cases in which there was a deviation of ³5 mmHg between supine and seated readings, BP measurements were repeated until con-sistent measurements were obtained.
Cyclo e rgo m e tric te st
Subjects were instructed to abstain from forceful physical activity and to avoid exces-sive food consumption and stressful situa-tions on the day scheduled for the test.
Smok-ing and alcoholic beverages were also to be avoided. The initial protocol consisted of anamnesis, clinical examination and a rest-ing 12-lead standard electrocardiogram (ECG). All subjects performed a symptom-limited continuous exercise on an electri-cally braked bicycle (ECAFIX). The starting workload was 50 watts and increments were by steps of 25 watts every 3 min. The pedal-ing rate was maintained as close to 60 rpm as possible to achieve maximal mechanical ef-ficiency and standardization. Subjects were encouraged to continue exercising until ex-haustion. Accepted criteria were used for terminating the test (26). Pre-test BP was measured after 10 min of supine rest. During the test, BP was measured twice (after 1.5 and 3 min) during each workload. After the test, the recovery BP level was measured at the fourth minute with the subject still seated on the bicycle. BP reactivity was calculated for each workload by subtracting the pre-test level from the highest BP level measured during the specific workload. ECG tracings were recorded from the MC5, V2 and D2 leads on a 3-channel ECG monitor (RG-300 FUNBEC) before performing the exercise test, during change in posture, respiratory maneuvers and at the third minute of each workload. A 3-channel oscilloscope (MM305-FUNBEC) monitored the ECG records and heart rate (HR) continuously. HR was re-corded at the third minute of each workload. After the test, the standard 12-lead ECG was repeated and ECG tracings were monitored with an oscilloscope until the fourth minute of the recovery period. The following pa-rameters were evaluated: BP, HR, and maxi-mal oxygen consumption (VO2max, ml kg-1
min-1) according to the formula of Bruce
(27) and the maximal double product (DPmax) by multiplying SBP x HR in the last workload (mmHg bpm 10-2).
Am bulato ry blo o d pre ssure m o nito ring
oscillo-metric device (Spacelabs-90207) applied to all patients between 8:00 and 9:00 am after a 10-min rest according to accepted criteria (28). The cuff was fixed on the nondominant arm and three BP readings were taken con-comitantly with a standard sphygmomano-metric reading to ensure that the average of the three sets of values did not differ by more than 5 mmHg. The device was set to record automatic BP readings at 20-min interval during the daytime (usually from 9:00 am to 11:00 pm) and at 30-min interval during the night-time (usually from 11:00 pm to 9:00 am). The patient was sent home with instruc-tions to hold the arm immobile during the measurements, to keep a diary of main daily activities and to return to the laboratory ap-proximately 24 h later. After entering the data of each patient into a computer, the accuracy of the device was again verified against previously specified BP levels of a mercury sphygmomanometer. ABPM was always performed on a workday. The fol-lowing parameters were assessed: data qual-ity; 24-h, daytime and night-time BP and HR means; leisure and occupational BP and HR means, calculated directly from the indi-vidual diary; BP and HR variability during these periods, and daytime and night-time BP load. The BP profile of each subject was established according to reference standards (28).
Co ld pre sso r te st
The CPT was performed as classically described (29). The nondominant hand was immersed up to the wrist in ice-cold water for 3 min. Pre-test BP was measured after 10 min of supine rest. The pre-test BP was recorded immediately after description of the procedure. During the CPT, BP was taken after 30 s of stimulation and measured twice with a 1-min interval. The highest level of SBP and DBP observed during the proce-dure was recorded. The post-test level of BP was recorded 2 min after the end of the test.
BP reactivity was calculated by subtracting the highest level recorded during the test from the pre-test level.
D o pple r e cho cardio graphic asse ssm e nt
All subjects underwent a complete echo-cardiographic assessment with a commer-cially available phased-array scanner (ESAOTE S.I.M.-7000) equipped with 2.5 and 3 MHz transducers coupled to a strip recorder. All tracings were obtained and read by a single observer blinded to clinical char-acteristics and BP status of the subjects un-der observation. Data were recorded on videotape and analyzed on-line from frozen frames by the apparatus own software. Hard-copy strips were obtained with a photograph device (Cannon LS-120) coupled to the echocardiographic equipment. Standard one-and two-dimensional echocardiographic im-ages were recorded from all subjects. These recordings were taken with care to place the cursor just distal to the mitral valve tips. Signal damping was adjusted to optimal iden-tification of endocardial and epicardial in-terfaces. The overall one- and two-dimen-sional (apical four- and two-chamber) meas-urements were performed according to rec-ommendations of the American Society of Echocardiography (30). LV end diastolic diameter (LVDd), LV end systolic diameter (LVSd), LV posterior wall thickness (PWT), interventricular septal thickness (IVST) and left atrial diameter were determined. Cor-rected LV mass was calculated using the equation developed by Devereaux et al.(31). It was indexed for the body surface area and expressed as g/m2. Endocardial fractional
shortening (FS) was calculated using the formula FS = [(LVDd - LVSd)/LVDd] x 100; the relative wall thickness (RWT) was calculated as twice the PWT divided by LVDd x 100. Indexed LV mass £125 g/m2 and
performed as previously described (32). The transducer was held at the cardiac apex. The Doppler beam was aligned parallel to the presumed mitral inflow, and the sample was placed at the level of the tips of the mitral valve leaflets. Signals that demonstrated the highest peak velocities and narrowest spec-tral dispersion were selected. Mispec-tral inflow was recorded on videotape at a speed of 100 mm/s for subsequent analysis. LV diastolic function indexes such as early to late peak flow velocity ratio (E/A) and isovolumetric relaxation time (IVRT) were assessed.
Statistical analysis
Statistical analyses were performed us-ing the GB-STAT for Windows version 6.0 software licensed to the Federal University of Espírito Santo. Variable responses during the laboratory tests were compared by re-peated measures analysis of variance (ANOVA). Data were compared by a stan-dard Student t-test for independent samples
or standard ANOVA followed by the Tukey test. Results are reported as means ± SD or SEM and the level of significance was set at P<0.05.
Re sults
Characte ristics o f the gro ups
Table 1 shows casual office BP and HR, anthropometric characteristics, maximal oxy-gen uptake (VO2max) and maximal double product (DPmax) recorded for the BH and NT groups. By definition, the BH and NT groups presented different casual office BP values. The anthropometric profile was simi-lar in both groups, with no difference in age, weight, height or body mass index. DPmax and VO2max were also similar. These values were expected since no subject was involved in physical conditioning and all individuals held office jobs without physical activity. Six subjects declared smoking habits (3 in
each group) and 12 (6 in each group) de-clared moderate alcoholic ingestion.
Cyclo e rgo m e tric te st
BH subjects presented a higher maximal SBP level than NT subjects in the CET (238 ± 11 vs 200 ± 10 mmHg, P<0.05). Maximal
DBP level, however, was similar in the two groups (84 ± 8 vs 82 ± 5 mmHg, not
signifi-cant). Even when the scores for change in BP (workload minus pre-test level) were calcu-lated (Figure 1), BH subjects presented a higher SBP response than NT subjects from 75 watts to maximum workload. The DBP response was similar for the two groups at all workloads. During recovery, however, it was below pre-test level in the NT group and above it in the BH group. HR response was similar throughout the CET.
Twe nty-fo ur-ho ur am bulato ry blo o d pre ssure
m o nito ring
ABPM data are summarized in Table 2. BH subjects presented higher levels of BP than the NT subjects during the 24-h ABPM.
Table 1. Casual office systolic blood pressure, dia-stolic blood pressure and heart rate, and other char-acteristics of subjects from the normotensive (NT) and borderline hypertensive (BH) groups.
BH NT
SBP (mmHg) 143 ± 5* 126 ± 5
DBP (mmHg) 94 ± 4* 82 ± 4
HR (bpm) 60 ± 9 62 ± 8
Age (years) 43 ± 4 42 ± 3
Age range (years) 35-50 36-49
Height (cm) 174 ± 6 171 ± 6
Weight (kg) 76 ± 9 78 ± 9
BM I (kg/m2) 26 ± 4.5 27 ± 2
VO2max (ml kg-1 min-1) 26 ± 3.7 27 ± 4
DPmax (mmHg bpm 10-2) 384 ± 42 378 ± 36
SBP, systolic blood pressure; DBP, diastolic blood pressure; HR, heart rate; BM I, body mass index; VO2max, maximal oxygen uptake; Dpmax, maximal
Individual records, however, showed that of the 36 originally BH patients (according to office BP measurements), 19 actually pre-sented normal monitored BP levels and 17 elevated monitored BP levels. The original BH group was then divided into two groups, one including the subjects with normal moni-tored BP levels (BH1) and the other includ-ing the subjects with elevated monitored BP levels (BH2) (Table 3).
Co ld pre sso r te st
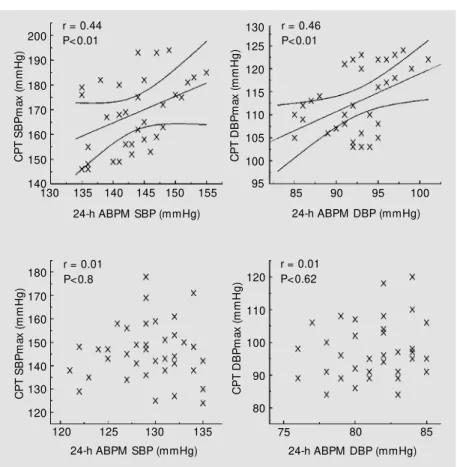
Results of the CPT are presented in Fig-ure 2. SBP and DBP responses were higher during the testing period among BH subjects with elevated monitored BP (BH2) than in the BH subjects with normal monitored BP (BH1) or the NT subjects. No differences were recorded between groups during the test, pre-test and post-test periods. HR be-havior was similar in all groups throughout the CPT. Figure 3 shows that 24-h ABPM SBP and DBP were positively correlated with the maximum values of SBP and DBP recorded during the CPT in the BH2 group but not in the BH1 group.
D o pple r e cho cardio graphy
Doppler echocardiographic indexes for the NT, BH1 and BH2 groups are presented in Table 4. LV structure and geometric pat-tern were similar and normal in all groups: no significant difference was found in LVDd, LVSd, PWT, IVST or RWT. LV mass was also normal and similar in all groups. In contrast, systolic function index (FS) was higher in the BH2 than in the BH1 and NT groups. Diastolic function indexes (IVRT and E/A ratio) were also altered in the BH2 group in relation to the other two groups.
D iscussio n
The present study was designed to evalu-ate the cardiovascular geometric pattern and
Table 2. Tw enty-four-hour ambulatory blood pressure monitoring (ABPM ) of systolic blood pressure, diastolic blood pressure and heart rate in the normotensive (NT) and borderline hypertensive (BH) groups.
ABPM period NT BH
SBP DBP HR SBP DBP HR
24-h 126 ± 6 82 ± 4 76 ± 10 134 ± 8* 86 ± 6* 74 ± 7
Daytime 128 ± 6 84 ± 4 76 ± 10 136 ± 8* 87 ± 6* 76 ± 8
Night-time 114 ± 7 75 ± 6 67 ± 8 125 ± 8* 78 ± 7* 67 ± 7
Sleep time 110 ± 6 68 ± 4 63 ± 8 116 ± 8* 75 ± 8* 61 ± 6
Leisure time 127 ± 6 84 ± 4 76 ± 10 133 ± 8* 85 ± 6* 75 ± 9
Work time 129 ± 9 84 ± 5 78 ± 10 134 ± 9* 87 ± 7* 78 ± 11
SBP, systolic blood pressure (mmHg); DBP, diastolic blood pressure (mmHg); HR, heart rate (bpm). Values are reported as means ± SD (N = 36).
* P<0.05, BH versus NT (Student t-test).
Figure 1. Cycloergometric test. Change in systolic blood pressure (DSBP) and diastolic blood pressure (DDBP) recorded for the normotensive (NT) and borderline hypertensive (BH) groups. Loadmax refers to the maximal w orkload attained during the test, usually 125 and eventually 150 w atts. Rec refers to the recovery period. Values are reported as means ± SEM . * P<0.05, BH compared to NT at the specified w orkload (Student t-test).
D
S
B
P
(
m
m
H
g
)
120
100
80
60
40
20
10
7
4
1
-2
-5 0
D
D
B
P
(
m
m
H
g
)
50 75 100 Loadmax Rec
*
*
*
*
50 75 100 Loadmax Rec
Workload (w atts)
the functional indexes of a group of BH subjects (according to casual office BP meas-urements) presenting an exaggerated BP re-sponse during a dynamic exercise test. Stud-ies on BP reactivity usually do not take into account that office and laboratory BP meas-urements are influenced by environmental conditions (33). In analogy to the white-coat effect noticed during office BP measure-ment (22), BP levels measured before labo-ratory tests may be inadequate to assess BP profile and cardiovascular reactivity. In this study, all subjects were submitted to ABPM. Therefore, the relations between both BP and cardiovascular reactivity and Doppler echocardiographic indexes could be more properly evaluated.
Twenty-four-hour ABPM showed that the monitored BP levels were actually sugges-tive of hypertension in 50% of the BH sub-jects and suggestive of normotension in the other 50%. Diastolic functional indexes were altered in the subjects with elevated moni-tored BP level: IVRT was extended and above the age-predicted value and the E/A ratio was also elevated (34). Although changes in diastolic function have been re-ported even in young men with high-normal BP (35), they are usually described in estab-lished hypertension. The usual pattern is a reduced E/A ratio and a protracted IVRT (34). These abnormalities have been de-scribed in BH men in some studies (36,37) but not in other (38). The results of the present study indicate that these discrepant results may be related to an inappropriate evaluation of the BP profile of these sub-jects.
A systolic function index (FS) was also enhanced in the subjects with elevated moni-tored BP levels. An elevated FS is suggestive of an increased sympathetic drive, but could also be a physiological response to a steadily elevated afterload, frequently associated with elevated vascular resistance (39). This last assumption is supported by the fact that these subjects also presented an exaggerated
Table 3. Ambulatory blood pressure monitoring (ABPM ) data show ing that some borderline hypertensive subjects presented normal blood pressure levels during 24-h monitoring (BH1) w hile others show ed elevated blood pressure levels during 24-h
monitoring (BH2).
ABPM period BH1 (N = 19) BH2 (N = 17)
SBP DBP HR SBP DBP HR
24-h 128 ± 4 81 ± 4 73 ± 6 144 ± 6* 91 ± 5* 76 ± 9
Daytime 129 ± 4 82 ± 4 74 ± 7 144 ± 6* 93 ± 5* 77 ± 9
Night-time 120 ± 7 75 ± 7 66 ± 7 130 ± 7* 83 ± 6* 67 ± 8
Sleep time 112 ± 7 68 ± 4 61 ± 6 120 ± 6* 74 ± 6* 62 ± 5
Leisure time 130 ± 4 83 ± 4 73 ± 7 146 ± 6* 87 ± 5* 76 ± 7
Work time 131 ± 5 84 ± 5 76 ± 6 147 ± 8* 96 ± 6* 77 ± 8
SBP, systolic blood pressure (mmHg); DBP, diastolic blood pressure (mmHg); HR, heart rate (bpm). Values are reported as means ± SD.
* P<0.05, BH1 versus BH2 (Student t-test).
D
S
B
P
(
m
m
H
g
)
30
25
20
15
10
5
30
25
20
15
10
0 0
D
D
B
P
(
m
m
H
g
)
Pre-test Testing
*
*
Test stage
NT BH2
Figure 2. Cold pressor test. Change in systolic blood pressure (DSBP) and diastolic blood pressure (DDBP) recorded for the normotensive (NT), borderline hypertensive w ith normal (BH1) and elevated (BH2) monitored blood pressure levels in the pre-test, testing and
post-test periods. Values are reported as means ± SD. * P<0.05, BH2 compared to NT and BH1 in
the specified test stage (ANOVA and Tukeytest). 5
Post-test
Pre-test Testing Post-test
Table 4. Doppler echocardiographic values of normotensive (NT) and borderline hyper-tensive subjects w ith normal (BH1) and elevated (BH2) monitored blood pressure.
NT (N = 36) BH1 (N = 19) BH2 (N = 17)
LVDd (mm) 50.6 ± 2.8 49.5 ± 3 51 ± 2.6
LVM i (g/m2) 81 ± 9.3 79 ± 12 83 ± 4
PWT (mm) 8.9 ± 0.6 9.0 ± 0.8 9.1 ± 0.7
IVST (mm) 8.9 ± 0.6 9.2 ± 0.8 9.2 ± 0.8
RWT 35 ± 2 37 ± 3 36 ± 4
FS (% ) 40 ± 3 41 ± 4 43 ± 3*
E/A 1.4 ± 0.02 1.3 ± 0.03 1.0 ± 0.02*
IVRT (ms) 79 ± 7 81 ± 4 85 ± 4*
LVDd, left ventricular diastolic diameter; LVM i, left ventricular mass index; PWT, posterior w all thickness; IVST, interventricular septal thickness; RWT, relative w all thickness; FS, fractional shortening; E/A, early to late peak flow velocity ratio; IVRT, isovolumetric relaxation time. Values are reported as means ± SD.
* P<0.05, BH2 versus NT and BH1 (ANOVA and Tukeytest).
BP response during the CPT. This pattern of response is frequently associated with an increased systemic vascular resistance and an abnormal vascular function and paral-leled by LV adaptations (40). Only in the BH2 group were 24-h ABPM SBP and DBP positively correlated with the maximum val-ues of BP recorded during the CPT. Taken as a whole, these results suggest an integrated pattern of cardiac and vascular adaptation during the development of hypertension.
All subjects in the original BH group presented an exaggerated BP response dur-ing the CET. However, only those with an elevated monitored BP level presented adap-tations in the Doppler echocardiographic in-dexes and an exaggerated response during the CPT. Our results therefore suggest that BP elevation during everyday life conditions is a more critical determinant of cardiovas-cular adaptations than BP reactivity to tem-porary stressful situations. They also indi-cate that an accurate BP profile of borderline hypertensive subjects is essential to evaluate the impact of BP levels and reactivity on the cardiovascular system.
Re fe re nce s
1. Kannel WB (1975). Role of blood pressure in car-diovascular disease. Cardiology,26: 1-10. 2. Perloff DB, Sokolow M & Cow an R (1983). The
prognostic value of ambulatory blood pressure. Journal of the American M edical Association,249: 2792-2798.
3. Fagard R, Staessen JA & Thijs L (1995). The rela-tionships betw een left ventricular mass and day-time and night-day-time blood pressures: a meta-anal-ysis of comparative studies. Journal of Hyperten-sion,8: 823-829.
4. Pickering TG (1972). Hypertension: definition, natural histories and consequences. American Journal of M edicine,52: 570-583.
5. Fuad FM , Trazzi RC, Gallagher JH, M acTyre WJ & Cook AS (1980). Abnormal left ventricular relax-ation in hypertensive patients. Clinical Science, 59: 411S-415S.
6. Parati G, Pomidossi G, Albini F, M alaspina D & M ancia G (1987). Relationship of 24-hour blood pressure mean and variability to severity of target-organ damage in hypertension. Journal of Hyper-tension,5: 93-98.
Figure 3. Simple correlation coefficient (r) betw een 24-h ambulatory blood pressure moni-toring (ABPM ) SBP and DBP w ith the maximum values of systolic (SBPmax) and diastolic blood pressure (DBPmax) recorded during the cold pressor test (CPT). The upper panels represent borderline subjects w ith elevated blood pressure in the 24-h ABPM (BH2) and the
low er panels borderline subjects w ith normal blood pressure levels in the 24-h ABPM (BH1).
C P T S B P m a x ( m m H g ) 200 190 180 170 160 150 140
135 140 145 150 155
130
24-h ABPM SBP (mmHg) r = 0.44
P<0.01 C P T S B P m a x ( m m H g ) 180 170 160 150 140 130 120
125 130 135
120
24-h ABPM SBP (mmHg) r = 0.01
P<0.8 C P T D B P m a x ( m m H g ) 130 125 120 115 110 105 95
85 90 95 100
24-h ABPM DBP (mmHg) r = 0.46
P<0.01 100 C P T D B P m a x ( m m H g ) 120 110 100 80
75 80 85
24-h ABPM DBP (mmHg) r = 0.01
P<0.62
7. Dlin RN, Hanne N & Silverberg DS (1983). Follow -up of normotensive men w ith aggerated blood pressure response to ex-ercise. American Heart Journal,106: 316-320.
8. Weder AB & Julius S (1985). Behavior, blood pressure variability and hyperten-sion. Psychosomatic M edicine, 47: 406-414.
9. Stroop JP (1935). Studies on inference in serial verbal reaction. Journal of Experi-mental Psychology,47: 1207-1211. 10. M atthew s KA (1986). Stress testing. In:
M atthew s KA, Weiss TM , Dembroski D, Falkner B, M anunck SB & William RB (Edi-tors), Handbook of Stress, Reactivity and Cardiovascular Disease. John Wiley & Sons, Inc., New York.
11. Sherw ood A, Hinderliter AL & Light KC (1995). Physiological determinants of hy-perreactivity to stress in borderline hyper-tension. Hypertension,25: 384-390. 12. M ancia G & Parati G (1987). Reactivity to
physical and behavioral stress and blood pressure variability in hypertension. In: Julius S & Basset B (Editors), Handbook of Hypertension. Vol. 9. Elsevier Science Publishing, New York.
13. Naughton JP, Sevullus G & Balke B (1963). Physiological response of normal and pathological subjects to a modified w ork capacity test. Journal of Sports M edicine and Physical Fitness,31: 201-207. 14. M anolio TA, Burke GL, Savage PJ, Sidney
S, Gardin JM & Berman A (1994). Exer-cise blood pressure response and 5-year risk of elevated blood pressure in a cohort of young adults. American Journal of Hy-pertension,7: 234-241.
15. M undal R, Kjeldsen SE, Sandvik L, Erikssen G, Thaulow E & Erikssen J (1994). Exercise blood pressure predicts cardiovascular mortality in middle-aged men. Hypertension,24: 56-62.
16. Lafleche AB, Pannier BM , Laloux B & Safar M E (1999). Arterial response during cold pressure test in borderline hyperten-sion. American Journal of Physiology,275: H409-H415.
17. Toto-M oukouo J, Um JP, Jon JP & Hagbe P (1993). Hemodynamic reactivity factors to cold pressor in blacks w ith sustained essential hypertension. American Journal of Hypertension,6: 824-829.
18. Eliason K, Hjemdhal P & Kahan T (1983). Circulatory sympathoadrenal and psycho-logical reactions to stress. Journal of Hy-pertension,1: 131-139.
19. Jern S, Bergbrant A, Hedner T & Hansson L (1995). Enhanced pressor responses to
experimental and daily-life stress in bor-derline hypertension. Journal of Hyper-tension,1: 69-79.
20. Fragola PV, Romitelli S, M oretti A, M ichi-santi M & Cannata D (1993). Precursors of established hypertension in borderline hypertensives. A tw o-year follow -up. In-ternational Journal of Cardiology,2: 113-119.
21. Kohler T, Fricke M , Ritz T & Scherbaum N (1997). Psychophysiological reactivity of borderline hypertensives and their recov-ery after mental stress. Psychotherapy and Psychosomatics,5: 261-267. 22. M ancia G (1990). Ambulatory blood
pres-sure monitoring: research and clinical ap-plications. Journal of Hypertension,8: S1-S13.
23. Pickering TG (1990). Hypertension, natu-ral histories and consequences. In: Laragh JH & Brenner M B (Editors), Hypertension: Pathophysiology, Diagnosis and M anage-ment. Raven Press, New York.
24. World Health Organization - International Society of Hypertension (1999). Guide-lines for the management of hyperten-sion. Journal of Hypertension, 17: 151-183.
25. Perloff DB, Grim C, Flack J, Frolich ED, Hill M , M cDonald M & M orgenstern Z (1993). Human blood pressure determina-tion by sphygmomanometry. Circulation, 5: 2460-2470.
26. Chaitman BR (1997). Exercise stress test-ing. In: Antman EE, Bain DS, Barold SS & Braunw ald E (Editors), Heart Disease. A Textbook of Cardiovascular M edicine. W.B. Saunders, Philadelphia.
27. Bruce RA (1977). M ethods of exercise testing: step test, bicycle, treadmill and isometrics. In: Amsterdam EA, Wilmore JH & De M aria NA (Editors), Exercise in Cardiovascular Health and Disease. York M edical Books, New York.
28. ISH Scientific Committee (1990). Consen-sus document on non-invasive ambula-tory blood pressure monitoring. Journal of Hypertension, 8 (Suppl 6): S136-S140. 29. Hines EA & Brow n GE (1936). The cold pressor test for measuring the reactivity of the blood pressure: data concerning 571 normal and hypertensive subjects. American Heart Journal,11: 1-9. 30. Sahn DJ, DeM aria A, Kisslo J, Weyman A
& The Committee on M -mode Standardi-zation of the American Society of Echo-cardiography (1978). Recommendations regarding quantification in M -mode echo-cardiography: result s of a survey of echocardiographic measurements.
Circu-lation,58: 1072-1083.
31. Devereaux RB, Alonso DR, Lutas EM , Gottlieb GJ, Campo E, Sachs I & Reichek N (1986). Echocardiographic assessment of left ventricular hypertrophy. American Journal of Cardiology,57: 450-458. 32. Graettinger WF, Weber M A, Gardin JM &
Knoll M (1987). Diastolic pressure as a determinant of left ventricular filling in normotensive adolescents. Journal of the American College of Cardiology,10: 1280-1285.
33. Everson SA, Kaplan GA, Goldenberg DE & Salonen TJ (1996). Anticipatory blood pressure to exercise predicts future high blood pressure in middle-age men. Hy-pertension,27: 1059-1064.
34. M antero A, Gentile F, Gualtierotti C, Azzolini M , Barbiere P, Berett L, Casazza F, Corno R, Lippolis A, Lombroso S & Ornaghi M (1995). Left ventricular dia-stolic parameters in normal subjects from 20 to 80 years old. European Heart Jour-nal,16: 94-105.
35. Graettinger WF, Neutel JM , Smith HG & Weber M A (1987). Left ventricle diastolic filling alterations in normotensive young adults w ith family history of systemic hy-pertension. American Journal of Cardiol-ogy,10: 1280-1285.
36. M abaroti C, Genovessi-Ebert A, Giaconi S, M ichelassi C & Ghione S (1989). Echodoppler assessment of left ventricu-lar f illing in borderline hypert ension. American Journal of Hypertension,2: 891-897.
37. Sung BH, Lovallo W R, Teague SM , Pincomb GA, Wilmore JH & Wilson M F (1999). Cardiac adaptation to increased systemic blood pressure in borderline hy-pertensive men. American Journal of Car-diology,72: 407-412.
38. Diazuzumba SB, DiPette DJ & Corman C (1986). Left ventricular filling characteris-tics in mild untreated hypertension. Hy-pertension,8: I-56-I-60.
39. Choong CY, Herrman HC, Weyman AE & Fifer M A (1987). Preload dependence of Doppler derived indexes of left ventricular diastolic function in humans. Journal of the American College of Cardiology,10: 800-808.