Citizen Science Based Monitoring of
Greylag
goose
(
Anser anser
) in
Bavaria
(
Germany
):
Combining Count Data and Bag Data to
Estimate Long-Term Trends between 1988/
89 and 2010/11
Andreas Grauer1☯
*, Andreas König1☯, Nils Bunnefeld2☯
1Wildlife Biology and Management working group, Institute of Animal Ecology, Technical University of Munich, Freising, Germany,2Biological and Environmental Sciences, University of Stirling, Stirling, United Kingdom
☯These authors contributed equally to this work. *andreas.grauer@web.de
Abstract
Introduction, Material and Methods
Numbers of large grazing bird (geese, swans, cranes) have increased all over Europe, but monitoring these species, e.g. for management purposes, can be time consuming and costly. In Bavaria, sedentary Greylag geese (Anser anser) are monitored during the winter by two different citizen-based monitoring schemes: the International Waterbird Census [IWC] and hunting bag statistics. We compared the results of both schemes for the seasons 1988/89 to 2010/11 by analysing annual indices calculated using the software TRends and Indices for Monitoring Data—TRIM.
Results and Discussion
We identified similar, highly significant rates of increase in both data sets for the entire region of Bavaria (IWC 14% [13–15%], bag 13% [12–14%]). Furthermore, in all of the seven
Bavarian regions, trends in annual indices of both data sets correlated significantly. The quality of both datasets as indicators of abundances in Greylag geese populations in Bavaria was not undermined by either weaknesses typically associated with citizen based monitoring or problems generally assumed for IWC and bag data. We also show that bag data are, under the German system of collecting bag statistics, a reliable indicator of spe-cies’distribution, especially for detecting newly colonized areas. Therefore, wildlife
manag-ers may want to consider bag data from citizen science led monitoring programmes as evidence supporting the decision making processes. We also discuss requirements for any bag monitoring schemes being established to monitor trends in species’distribution and
abundance.
OPEN ACCESS
Citation:Grauer A, König A, Bunnefeld N (2015)
Citizen Science Based Monitoring ofGreylag goose
(Anser anser) inBavaria(Germany): Combining Count Data and Bag Data to Estimate Long-Term Trends between 1988/89 and 2010/11. PLoS ONE 10 (6): e0130159. doi:10.1371/journal.pone.0130159
Academic Editor:Travis Longcore, University of
Southern California, UNITED STATES
Received:November 26, 2014
Accepted:May 17, 2015
Published:June 24, 2015
Copyright:© 2015 Grauer et al. This is an open
access article distributed under the terms of the Creative Commons Attribution License, which permits unrestricted use, distribution, and reproduction in any medium, provided the original author and source are credited.
Data Availability Statement:All relevant data are
within the paper and its Supporting Information files.
Funding:The authors have no support or funding to
report.
Competing Interests:The authors have declared
Introduction
International agreements oblige member states to maintain naturally occurring wildlife popu-lations, including those of migratory birds, to reduce the loss of biodiversity [1–3]. Because understanding of newly emerging factors regulating distribution and abundance of bird species (e.g., changes in climate and land use) is limited, monitoring is an essential tool to put conser-vation decisions into action [4,5]. Estimating trends in migratory bird species is complex [6] and most of the existing monitoring schemes have to deal with several problems connected to survey methodology as well as to the ecology, behaviour, and movement of monitored species [5,7]. To acknowledge these problems it is generally recommended to use several independent datasets [8]. Sufficient data from different monitoring schemes is not readily available so that these recommendations can most often not be implemented [9,10].
Monitoring data from two independent datasets, the International Waterbird Census (IWC) [11,12] and hunting bag statistics [13] are available in Bavaria to assess trends in the regional populations of huntable waterbirds. Both statistics measure wintering geese popula-tions; the IWC is carried out during winter and most of the geese are bagged during the months of November, December and January. No analysis of the Bavarian IWC and bag statistics yet exists to test the suitability of the sampling methods for monitoring this mobile and migratory bird species. Data gathered in the Bavarian IWC is heterogeneous because the number of IWC survey sites has increased substantially in the past while some regions are still poorly covered. Furthermore, numbers of surveys per season in the participating survey sites vary due to vary-ing volunteer participation. Short and long term bird migration patterns may also affect trend estimates, e.g., geese may change their staging or wintering area for several reasons [14–16] causing redundant or missing counts.
To use bag statistics as an index of population trends, researchers must acknowledge that hunting bags may not only depend on abundance but also on hunting effort [17–19]. Identified trends may reflect changes in hunting effort rather than trends in species densities. Reliability of hunting bag statistics may also depend on the ability of hunters to identify the species being shot as well as their willingness to report. Nevertheless, for Bavaria there is no evidence that hunters intentionally report either wrong species or wrong numbers. Despite these issues, data quality may also be critical as both monitoring schemes are based on data collected by hunters and bird watchers. Having two independent datasets for one species is an outstanding example of a long-term citizen science based monitoring program, but data should still be scrutinized for their viability [20–22]. With data quality in mind, the aim of the study was to determine whether the trends in the two different Bavarian data sets correlate. If trends in Greylag geese counted and shot do correlate, it would strengthen conclusions based on one of these two datasets.
Material and Methods
Greylag geese in Bavaria
Belgium. We conclude from the recent ringing studies [26,27], that Bavaria’s bag data as well as Bavarian IWC data cover the entire migration route of Bavarian Greylag geese.
International Waterbird Census
In Bavaria, Greylag geese are surveyed under the framework of the International Waterbird Census (IWC) [28] coordinated by the ornithological subdivision of theBavarian Agency for
Nature Conservation(Landesamt für Umwelt; LfU), which is part of theBavarian Ministry for
Environment[11]. IWC survey sites cover most of Bavaria, but theEastern Low Mountain
Rangeregion is not yet covered at all. Waterbirds are counted by volunteers simultaneously
every four weeks during September to April [12]. In this study we used surveys from 1988/89 to 2010/11 and selected data from surveys conducted during November, December and Janu-ary, i.e., the months that cover the main part of the Greylag geese hunting season in Bavaria. In general, the number of survey sites increased during the time period analysed ranging between 77 and 121 (Table 1). When a survey site had been counted twice during a weekend we used the maximum numbers counted during this time. To obtain one data point per season, monthly results were averaged per survey site using the geometric mean [29]. The numbers of
Table 1. Numbers of IWC survey sites monitored between 1988/89–2010/11 and number of administrative districts (AD) providing bag data during
the same time span.
Region 1 2 3 4 5 6 7 8
Data Set IWC AD IWC AD IWC AD IWC AD IWC AD IWC AD IWC AD IWC AD
1988/89 0 14 11 18 1 6 11 20 21 14 18 12 19 9 81 96
1989/90 0 11 1 11 22 17 20 82
1990/91 0 11 1 10 22 17 21 82
1991/92 0 11 1 11 22 16 21 82
1992/93 0 10 1 11 21 16 23 82
1993/94 0 10 1 12 21 15 19 78
1994/95 0 10 1 12 21 13 22 79
1995/96 0 10 1 12 20 13 21 77
1996/97 0 10 1 12 18 18 23 82
1997/98 0 10 1 13 20 18 22 84
1998/99 0 10 1 12 20 18 21 82
1999/00 0 10 1 13 20 24 23 91
2000/01 0 11 1 13 21 39 23 108
2001/02 0 11 1 13 22 41 22 110
2002/03 0 11 1 11 25 44 22 114
2003/04 0 11 1 14 25 46 22 119
2004/05 0 11 1 12 26 49 22 121
2005/06 0 11 1 11 23 50 22 118
2006/07 0 10 1 16 21 46 23 117
2007/08 0 11 1 15 17 47 23 114
2008/09 0 11 1 15 15 45 24 111
2009/10 0 11 1 16 14 52 23 117
2010/11 0 9 1 10 17 48 20 105
1 = North Eastern Low Mountain Ranges, 2 = Main; 3 = Eastern Low Mountain Ranges, 4 = Upper Danube / Altmuehl, 5 = Lower Danube / Isar, 6 = Southwest Bavaria, 7 = Inn / Salzach, 8 = Bavaria
surveys conducted at a specific survey site per season did, however, vary due to changing vol-unteer participation.
Hunting regulations for geese and bag statistics
Under German hunting law the entire territory of Germany is split up into hunting districts [13] and local hunters are, by law, obliged to report the numbers of game bagged or found dead in these hunting districts in paper form shortly after the end of hunting season, latest until April 10thof the following year. Unlike other European states [30] it is a mandatory system for monitoring bag sizes.
The data are submitted separately for each species to the responsible administrations (Bavaria: 96 Administrative Districts, (AD)) every year. The ADs sum the hunting bags of the hunting districts and send the sum to theBavarian Ministry of Food,Agriculture and Forestry. The ministry publishes the total bag reached across Bavaria, but stakeholders, like universities or nature conservation related non-governmental organisations, can also obtain detailed statis-tics [31].
Hunting Greylag geese in Bavaria is not regulated by quotas, so hunters can shoot as many geese as they like to or at least as many as they are able to. Hunting methods are regulated, however, such that birds are only allowed to be shot with rifles of any calibre or shotguns, but they are not allowed to be caught in traps or using nets [3,13,32]. Furthermore, hunters are only permitted to harvest geese during August and between November 1stto January 15th, but derogations are possible. The majority of geese are hunted during November and January. Equivalent to the IWC data we used the Greylag goose hunting bags recorded in the ADs dur-ing the seasons 1988/89 to 2010/11.
Geographical reference
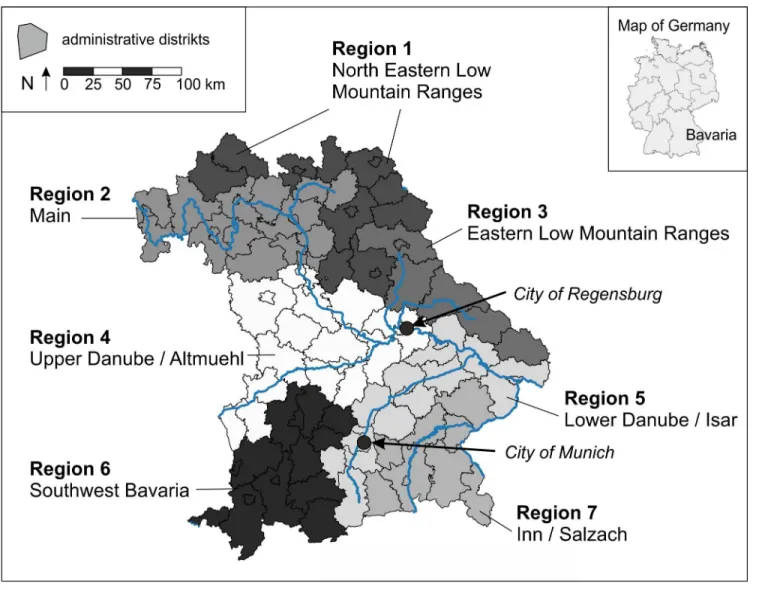
We subdivided the territory of Bavaria (70,550 km²) into seven regions (Fig 1) and assigned IWC survey sites as well as the ADs to those regions (Table 1). All analyses were done region-ally and for Bavaria as a whole.
The seven regions were defined according to major rivers systems and landscape structure [33]. The regionNorth Eastern Low Mountain Rangesincludes ADs in theSaxony and
Thurin-gia Low Mountain Ranges (Thüringische und Sächsische Mittelgebirge)as well as theEast
Hes-sian Hills (Osthessisches Hügelland). The regionEastern Low Mountain Rangesincludes the
ADs dominated by the low mountain rage“Bavarian Forest”(Bayerischer Wald). Both regions are characterized by forests and some smaller rivers (e.g.,Naab,Regen). The regionMain includes ADs directly influenced by the course of theRiver Mainor the northern parts of the
Altmuehl—Main—Danube—Canalin which some gravel pits are relevant waterbird habitats
in addition to the river course. The regionUpper Danube / Altmuehlincludes all ADs west of the ADRegensburghaving direct contact to the course of the riverDanube, the southern parts of theAltmuehl—Main—Danube—Canalor theRiver Altmuehl. This region includes major waterbird areas such as theLake Altmuehlseeand large gravel pits along the riverDanube. The same applies for the regionLower Danube / Isarincluding the courses of the riverDanubeeast of ADRegensburg, the riverIsarand some lakes in and south ofMunich(e.g.Starnberger See, Ammer See). The city itself also provides many suitable habitats for waterbirds, being the main wintering area for the breeding population ofLake Altmuehl[27]. The regionInn / Salzachis dominated by the riversInnandSalzachand some lakes like theLake Chiemsee. The region
South-western Bavariais strongly influenced by the riversLechandIller.Lake Kontanz
regions reflects also the historical occurrence of geese in Bavaria, in that the southern regions cover the area where geese were recorded first and later spread along the river systems [24].
Analyzing trends in geographical occurrence
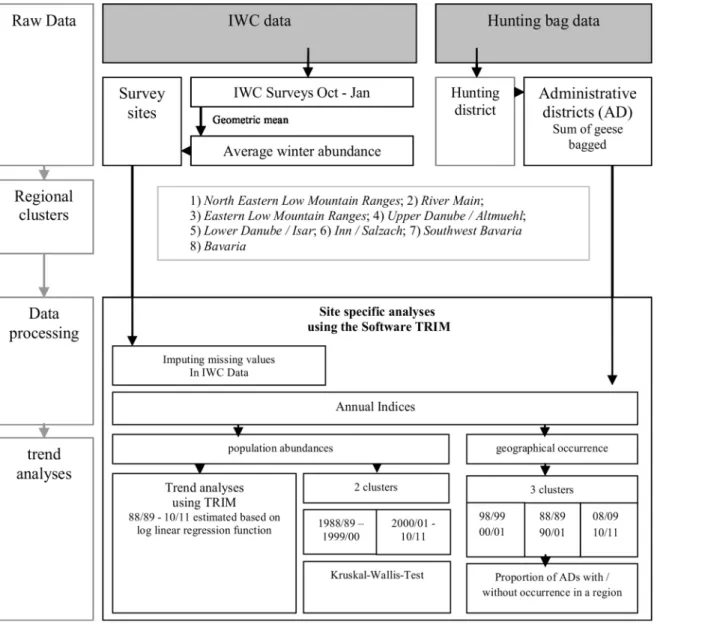
We evaluated trends in the occurrence of Greylag geese in three different 3-year periods, 1988/ 89–1990/91, 1998/99–2000/01 and 2008/09–2010/11 (Fig 2,Table 2). The chosen 3-year peri-ods are long enough to minimize random variation in the detectability of geese, which would otherwise influence both bag sizes and the IWC data especially in areas where the species does not occur regularly and abundances are low. Furthermore, three years is short enough not to be influenced by any longer-term trends in the data.
Analyzing annual indices and trend analyses
Trends in both IWC and bag data were analysed based on the annual indices calculated by the softwareTRends and Indices for Monitoring Data—TRIM. The software is designed to evaluate
Fig 1. Map of Bavaria including the different regions.
monitoring schemes characterised by missing observations [34,35]. The season 1999/2000 was set as the reference.
We also clustered annual indices for bag data and IWC data into two periods, 1988/89–
1990/2000 and 2000/01–2010/11 and tested these two groups for significant differences by using the Kruskal-Wallis test (Fig 2).
Results
Occurrence / geographical distribution
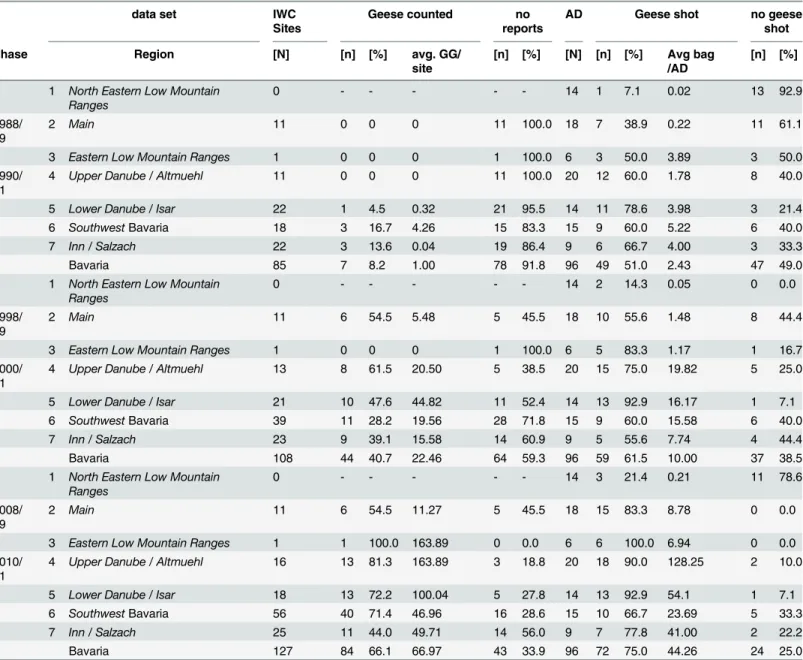
During the period 1988/89–1990/91 Greylag geese were shot in 51% of the Bavarian ADs cover-ing all of the seven regions in Bavaria. Regional differences exist in the average bag sizes and the number of AD where geese were shot (Table 2). In general, the percentage of ADs that reported bags were quite similar in the regionsEastern Low Mountain Ranges,Upper Danube/Altmuehl
andSouthwest Bavaria(50%–60%), slightly higher in the regionsLower Danube / Isar(79%) and
Fig 2. Flowchart of the data processing and analyses (IWC: International Waterbird Census, TRIM: Software
Inn / Salzach(67%) and substantially lower in the two northern regions,Main(39%) andNorth
Eastern Low Mountain Ranges(7%). Seasonal bag sizes per AD are relatively small and apart
from the regionSouthwest Bavaria(5 bagged geese per AD and season) were never higher than 4 geese/AD.
The IWC data show a diverse picture of geese occurrence in Bavaria in that only 8% of all Bavarian survey sites reported geese. Moreover, IWC data confirm geese occurrence only for the regionsLower Danube / Isar(0.32 geese/site),Southwest Bavaria(4.26 geese/site) andInn /
Salzach(0.04 geese/site). The differences in the regional occurrence identified by the bag
Table 2. Occurrence of geese in the IWC survey sites and numbers of Administrative Districts, where geese were shot on a regional level and Bavaria in total, seasons 1988/89–1990/91, 1998/99–2000/01 and 2008/09–2010/11.
data set IWC
Sites
Geese counted no
reports
AD Geese shot no geese
shot
Phase Region [N] [n] [%] avg. GG/
site
[n] [%] [N] [n] [%] Avg bag /AD
[n] [%]
1 North Eastern Low Mountain
Ranges
0 - - - 14 1 7.1 0.02 13 92.9
1988/
89 2
Main 11 0 0 0 11 100.0 18 7 38.9 0.22 11 61.1
- 3 Eastern Low Mountain Ranges 1 0 0 0 1 100.0 6 3 50.0 3.89 3 50.0
1990/ 91
4 Upper Danube / Altmuehl 11 0 0 0 11 100.0 20 12 60.0 1.78 8 40.0
5 Lower Danube / Isar 22 1 4.5 0.32 21 95.5 14 11 78.6 3.98 3 21.4
6 SouthwestBavaria 18 3 16.7 4.26 15 83.3 15 9 60.0 5.22 6 40.0
7 Inn / Salzach 22 3 13.6 0.04 19 86.4 9 6 66.7 4.00 3 33.3
Bavaria 85 7 8.2 1.00 78 91.8 96 49 51.0 2.43 47 49.0
1 North Eastern Low Mountain
Ranges
0 - - - 14 2 14.3 0.05 0 0.0
1998/ 99
2 Main 11 6 54.5 5.48 5 45.5 18 10 55.6 1.48 8 44.4
- 3 Eastern Low Mountain Ranges 1 0 0 0 1 100.0 6 5 83.3 1.17 1 16.7
2000/
01 4
Upper Danube / Altmuehl 13 8 61.5 20.50 5 38.5 20 15 75.0 19.82 5 25.0
5 Lower Danube / Isar 21 10 47.6 44.82 11 52.4 14 13 92.9 16.17 1 7.1
6 SouthwestBavaria 39 11 28.2 19.56 28 71.8 15 9 60.0 15.58 6 40.0
7 Inn / Salzach 23 9 39.1 15.58 14 60.9 9 5 55.6 7.74 4 44.4
Bavaria 108 44 40.7 22.46 64 59.3 96 59 61.5 10.00 37 38.5
1 North Eastern Low Mountain
Ranges
0 - - - 14 3 21.4 0.21 11 78.6
2008/
09 2
Main 11 6 54.5 11.27 5 45.5 18 15 83.3 8.78 0 0.0
- 3 Eastern Low Mountain Ranges 1 1 100.0 163.89 0 0.0 6 6 100.0 6.94 0 0.0
2010/
11 4
Upper Danube / Altmuehl 16 13 81.3 163.89 3 18.8 20 18 90.0 128.25 2 10.0
5 Lower Danube / Isar 18 13 72.2 100.04 5 27.8 14 13 92.9 54.1 1 7.1
6 SouthwestBavaria 56 40 71.4 46.96 16 28.6 15 10 66.7 23.69 5 33.3
7 Inn / Salzach 25 11 44.0 49.71 14 56.0 9 7 77.8 41.00 2 22.2
Bavaria 127 84 66.1 66.97 43 33.9 96 72 75.0 44.26 24 25.0
IWC = International Waterbird Cencus, AD = Administrative Districts, sites = survey sites providing geese counts, N = Total Number, n = numbers reported, avg. GG/site = average number of Greylag geese reported per site
statistics are supported by the IWC surveys. The percentage of survey sites reporting geese as well as the numbers of counted geese were highest inSouthwestBavaria and lowest in the regionsLower Danube / IsarandInn / Salzachreporting (Table 2).
During the following 10 years, geographical occurrence increased in general: 62% of all Bavarian AD reported bags (+ 11%) and 41% of the survey sites (+33%) counted geese during phase 2, 1998/99–2000/01. Despite the general trend, greater increases can be shown for two
Danuberegions. The numbers of IWC survey sites reporting geese in these regions increased
by 61.5% (Upper Danube / Altmuehl) and 42.1% (Lower Danube / Isar). Both regions also had substantial increases in the numbers of AD where geese were bagged (15.0%, 14.3%). Both data sets identify the twoDanuberegions andSouthwestBavaria as the centre of Bavarian geese populations during phase 2, 1998/99–2000/01.
The geographic expansion of sites occupied by geese continued during the entire time span analysed here. Hence, in phase 3 (2008/09–2010/11) 66.1% of all Bavarian IWC survey sites reported geese occurrence (+25%) and Greylag geese were bagged in 75% of all AD (+13%). The differences between the regions became larger. In theMain regionas well as in the region
North Eastern Low Mountain Rangesbag sizes and number of counted geese increased only to
a small extend whereas sightings as well as the number of geese bagged increased more rapidly in the regionUpper Danube / Altmuehl. The region developed into the centre of the Bavarian goose population, even though geese occurrence increased in other regions (Lower Danube /
Isar,Inn / Salzach,Southwest Bavaria,Eastern Low Mountain Ranges) as well.
Trends in IWC
Periods. In Bavaria, the IWC survey results recorded during the time span 2000/01–2010/ 11 were 400% higher than those ones recorded during 1988/89–1999/00 (Kruskal-Wallis test, p<0.001). The regions differed in the scale of the increase (Table 3) and ranged between 178% and 4029%. The differences between the average IWC results of the period 1988/89-1999/00 and the average IWC results during the period 2000/01-2010/11 were highly significant in most of the regions (Table 3).
TRIM. Analysing the IWC data by using the software TRIM showed significant positive increases in the numbers of geese counted for the whole of Bavaria as well as for all of the regions (Table 3). At the state level, an annual increase of 14% (13–15%) was identified in the number of geese counted. Considering the 95% confidence intervals, the average figures of the regionsEastern Low Mountain Ranges(23%),Lower Danube / Isar(15%) andInn / Salzach (13%) did not deviate significantly from the Bavarian trend, whereas the annual increase in the
Upper Danube / Altmuehlregion (20%) was significantly higher.
A significantly smaller increase was analysed in the regionSouthwest Bavariabeing 10% (8–
12%). In theMain regionthe regional 95% confidence interval (7–13%) overlaps with the 95% confidence interval of the Bavarian trend (13–15%) and thus significant differences between both increase rates cannot be assumed. The overlapping sector is, however, very small at about 0.06%.
Trends in bag statistics
TRIM. The seasonal bag size in Bavaria was 257 Greylag geese in the hunting season 1988/ 89 and 4843 geese in the hunting season 2010/11. TRIM calculated a highly significant linear increase of 13% (12–14%) within the data set. Whereas in Region 1 (1%), Region 2 (6%) as well as in Region 3 (6%) significant trends are not identified by TRIM, calculated trends for Region 4 (20%), Region 5 (7%), Region 6 (7%) and Region 7 (11%) show a highly significant increase in bag numbers.
Table 3. Trends in IWC and bag data for Greylag geese in Bavaria, 1988/89 to 2010/11 analysed by TRIM.
Data TRIM difference in periodical averages
1988/89-1999/00 2000/01–2010/11 1988/89-1999/00 vs 2000/01–2010/11
Region Slope 95% CI Trend p sign Mean 95% CI Mean 95% CI Δ% P Sig
[%] ll ul [Index] Ll ul [Index] ll ul
1.North Eastern Low
IWC No surveys accomplished
Mountain Ranges Bag 1.33 -9.80 12.46 uncertain 0.48 0.19 0.86 1.45 0.68 2.79 203.56 <0.05 *
2.River Main IWC 10.20 7.24 13.16 strong increase
<0.01 ** 0.39 0.25 0.88 1.21 0.92 3.02 212.19 <0.001 **
bag 6.37 -127.49 140.24 uncertain 1.72 0.20 2.43 2.70 1.63 5.91 57.36 <0.05 *
3.Eastern Low IWC 23.12 6.45 39.79 strong increase
<0.01 ** 1.02 0.82 2.64 42.31 10.78 63.44 4029.54 <0.001 **
Mountain Ranges bag 6.57 5,14 8,00 uncertain 1.72 0.24 3.24 2.70 1.49 3.92 57.40 <0.001 **
4.Upper Danube / Altmuehl
IWC 20.79 16.26 25.32 strong increase
<0.01 ** 0.38 0.23 0.83 4.63 3.26 11.02 1129.78 <0.001 **
bag 20.03 17.40 22.66 strong increase
<0.01 ** 0.42 0.24 0.89 3.23 2.07 7.29 670.39 <0.001 **
5.Lower Danube / Isar
IWC 15.21 11.17 19.25 strong increase
<0.01 ** 0.35 0.19 0.72 1.56 1.27 4.04 345.76 <0.001 **
bag 7.34 5.67 9.01 strong increase
<0.01 ** 0.63 0.45 1.51 1.22 1.08 3.34 94.73 <0.001 **
6.Southwest
Bavaria
IWC 10.53 8.41 12.65 strong increase
<0.01 ** 0.61 0.45 1.49 1.69 1.24 4.13 178.52 <0.001 **
Bag 7.62 5,84 10.94 strong increase
<0.01 ** 0.63 0.02 1.24 1.22 0,74 1,69 93.65 <0.001 **
7. Rivers Inn /Salzach
IWC 13.93 11.60 16.26 strong increase
<0.01 * 0.67 0.49 1.62 3.21 2.44 8.00 382.74 <0.001 **
Bag 11.80 8.41 15.19 strong increase
<0.01 ** 0.72 0.50 1.69 2.30 1.48 5.19 220.44 <0.001 **
Bavaria IWC 14.45 13.10 15.82 strong increase
<0.01 ** 0.44 0.29 1.01 2.19 1.76 5.63 400.02 <0.001 **
Bag 13.80 12.78 14.82 strong increase
<0.01 ** 0.50 0.34 1.17 2.22 1.52 5.20 341.39 <0.001 **
AD = Administrative Districts, sites = survey sites providing geese counts, 95% CI = 95% Confidence interval, ll = lower level, ul = upper level,Δ% = proportional difference between the average indices, p = p-value for Kruskal-Wallis Test testing difference between the periods
sig*= significant sig**= highly significant
Comparison of IWC and bag indices
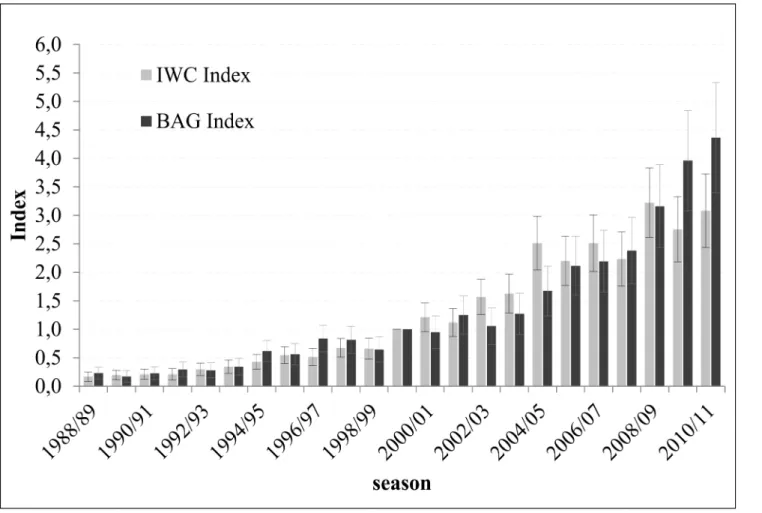
Annual indices in bag and IWC data provided by TRIM show a highly significant positive cor-relation (Fig 3, Spearman's rank correlation coefficient, R2= 0.97, p<0.001). TRIM calculated almost identical trends for both IWC and bag statistics with increase rates of 14% (13–15%) in the IWC data and 13% (12–14%) in the bag statistics. Furthermore, the 95% confidence inter-vals of both figures are with ±9% (IWC) and ±7% (bag) very narrow. The similar trend in both statistics is also supported by average indices of the periods 1988/89-1999/00 and 2000/01–
2010/11 (Table 3). Comparable to the overall situation, trends in IWC and bag indices of the regions 4, 6 and 7 correspond well. The rates of average annual increase in both datasets are similar proven by relatively narrow and overlapping confidence intervals (Table 3). Further-more, the average indices of the two periods do support the assumption of almost similar trends in both data sets for those regions. In the regionMainas well as in the regionEastern
Low Mountain Rangesconfidence intervals of the calculated IWC trends do still overlap, but
mostly because one of the confidence intervals, either in the IWC or in the bag data, is consid-erably large. Looking at the average indices of the two periods indicated no significant differ-ences between the two data sets for theMainregion, thus it must be assumed, that there is no significant difference between the trends in IWC and bag data here. In contrast, comparing these average indices suggests that the increase in the number of geese bagged is smaller than the increase in the number of geese counted in the regionEastern Low Mountain Ranges.
Fig 3. Trends in the annual indices of both, the IWC data and the hunting bag data.
In Region 5, annual trends in both datasets calculated by TRIM do significantly differ as there is no overlap in the 95% confidence intervals. But, as the 95% confidence intervals for the average indices of the periods 1988/89-1999/00 and 2000/01-2010/11 do overlap, it is still ques-tionable if trends in the IWC and bag data do significantly deviate.
Even if the 95% confidence intervals of the average figures overlap, the correlation coeffi-cients for the dependency of IWC and bag statistics are highly significant (Spearman's rank correlation coefficient, p<0.001) with an R2>0.84 in most regions. Only in Region 2 the corre-lation of IWC and bag indices (R2= 0.41) is not strong, but with p = 0.025 still significant (Table 4). Thus, whenever there is an increase in the IWC counts there is always an increase in the bag statistics, or vice versa. Furthermore, even if there are mostly no significant differences in the growth rates of IWC and bag statistics it seems to be a general tendency that increase rates in bag data seems to be just a little smaller than in the IWC data.
Discussion
Trends in Bavaria's Greylag geese population
The value of citizen science for ecological research is now widely accepted [20,21,36], but stud-ies investigating the usefulness and quality of long-term data sets already collected by citizen science schemes for scientific monitoring are rare [37]. Here, we analyse two sets of long-term data collected by two different groups of citizens, the International Waterbird Census (IWC) count data and bag data collected by hunters, spanning the period 1988/89–2010/11 with a total of 23 years of data collection. Besides obvious advantages of gathering data from large areas it is also generally assumed that the collected data may have weaknesses connected to methodological bias. Detectability, unrepresentative distribution of survey sites, survey effort and hunting intensity and/or efficiency as well as qualification of volunteers are known to be able to undermine the quality of monitoring schemes [4,6,17,38–41]. Thus, methods must be established to assure monitoring is effective and minimises bias and error [42]. For the IWC dataset, this is ensured by the organising bodies in Bavaria [12,43] and bag data are collected by qualified hunters receiving training including an examination before they are allowed to hunt [13,32]. Still, identified trends may still be the result of other factors such as changes in the wintering and staging sites of geese and areas not surveyed [5,15]. One of the crucial points influencing monitoring of waterfowl is the relocation of bigger flocks as a result of disturbance, e.g., by hunters [15,44,45]. For Bavaria it has been demonstrated that Greylag geese leave win-tering sites from time to time for unknown reasons [27], sometimes geese leave the area of the administrative district, but mostly they do not shift to another region. Thus, it can be assumed that trend analyses carried out at a regional level for bag statistics are not susceptible to these relocations because geese shot in the neighbouring AD will be reported as well. On the other
Table 4. Spearman's rank correlation coefficient of annual indices in bag and IWC data (N = 23).
Region R2 P
2Main 0.41 p = 0.025
3Eastern Low Mountain Ranges 0.84 p<0.001
4Upper Danube/Altmuehl 0.97 p<0.001
5Lower Danube / Isar 0.86 p<0.001
6SouthwestBavaria 0.89 p<0.001
7Inn / Salzach 0.92 p<0.001
Bavaria 0.97 p<0.001
hand, IWC analyses are more liable to be influenced by these relocations because the chances are small that geese will shift to another area that is also being monitored.
Despite these challenges in monitoring, IWC and bag data trends in Bavaria strongly corre-late. TRIM indices of bag data and IWC data showed almost identical trends in Bavaria with an annual rate of increase around 13–14% p.a. from 1988/89 to 2010/11 doubling numbers every 5 years. The growth rates we identified are common for (re-)establishing populations of Grey-lag geese in the last 30 years in other areas. For example, growth rates of about 10% are known
forGreat Britain[46,47] and growth rates of 19% were calculated for Greylag geese populations
inThe Netherlands[48].
As both statistics were independently collected and correspond well, it can be assumed that overall trends in Bavaria are most likely driven by changes in population size rather than by monitoring error or bias. The influence of changes in hunting pressure as well as the influence of changes in hunters’numbers on trends are often discussed [8,10]. For Bavaria changes in hunting pressure as a result of increasing numbers of hunters may have modified bag numbers during the time analysed in that study. Though official data on numbers of hunters are not available, the total sum of fees which hunters have to pay for hunting related projects when enquiring their licence (20 Euros per person per year) is available and may serve as an indicator of the number of hunters in Bavaria. The total amount of those fees increased slightly from just under 1.1 Million Euros in 2003 to about 1.2 million Euros in 2013 [49] reflecting a slightly positive trend in hunters.
Due to the good fit of IWC and bag data it seems that these methodological and data prob-lems, as well as challenges due to the behaviour of Greylag geese, are successfully addressed for Bavaria. Also at the regional level these challenges have mostly been addressed by the quality of the data. Highly significant correlations of regional indices as well as corresponding rates of increase were identified in the regionsUpper Danube / Altmuehl,Southwest Bavariaand Rivers Inn / Salzach. Nonetheless, there are also two regions with slightly poorer correlations of IWC and bag data. For example, in the regionLower Danube / Isarthe growth rate in the hunting bag statistic is significantly smaller than the one in the survey results. This can be explained by the fact that hunting is forbidden in the city of Munich which is the main wintering area for the quickly increasing population ofLake Altmuehlseeconsisting of 80 reproducing pairs of
Greylag geeseand about 1000 non-breeding geese in the year 2010 [27]. Hence, most of the
population remains unhunted as most of these birds migrate shortly after chicks fledge to Munich just before the hunting season opens [27]. Hence, the discrepancy is connected to legal issues and not to systematic biases. Still, TRIM states a significant strong increase in both data sets for this region and annual indices correlate significantly over the entire study period. Another region contradicting the overall trend is the course of theRiver Mainin the north of Bavaria. The reason for the poor fit of growth rates in the indices is the small size of the regional population: on average less than 9 geese are bagged per annum in each administrative district and less than 12 geese are counted per survey site. So all in all, we assume that IWC and bag statistics are equivalent tools to monitor trends in Greylag geese populations in Bavaria.
the German hunting regulations nor are any bag limits set. Thus, geese could be hunted in every hunting district covering the entire state of Bavaria. While the IWC is carried out only on major waterbird habitats, hunters collect a continuous harvest record and thus record of spe-cies occurrence.
We have shown that both data sets identified similar core areas of geese occurrence. Accord-ing to both schemesSouthwest Bavaria(Region 6) andInn / Salzacharea (Region 7) were the centre of Bavarian Greylag goose populations during 1988/89–1990/91. When geese popula-tions grew continuously during the next two decades (1988/89–2010/11) differences in the two statistics got smaller, indicating that the earlier discrepancies were the result of small geese abundances causing problems in detectability. It is worth mentioning that both statistics indi-cate a shift in the core areas of geese occurrence fromSouthwest Bavaria(Region 6) andInn /
Salzacharea (Region 7) in 1988/89–1990/91 to the twoDanuberegions (regions 4 and 5) in
(2008/09–2010/11). Although the reason for the shifts are unknown they may be due to an increasing number of gravel pits left unexploited and being naturalised and thus providing suit-able habitats all along the riverDanube.
Adjusted management of sedentary Greylag geese populations: Hints
from this case study
Parallel to the increasing Arctic populations, populations of Greylag geese have established all over Europe and their numbers are estimated to have increased to about 410,000 Greylag geese in Northwest Europe and to about 31,000 Greylag geese in Central Europe from 1990 to 2010 [36]. Even though most parts of Europe are connected to the different flyways of Nordic Grey-lag geese populations, some areas still have more or less sedentary regional GreyGrey-lag geese popu-lations, e.g., the south of England or the south east of Germany, Italy, and Spain [23,52]. Sustainable use of waterfowl populations has long been an issue in wildlife ecology and man-agement [53,54], though there is still substantial uncertainty about system dynamics and impacts of potential management decisions [55]. The two main problems are the almost total lack of reliable data on recruitment and mortality [56]. Therefore, a practical approach is to identify the sustainability of hunting waterbirds by combining bag sizes and population trends [57]. Still, this simple approach is most often restricted by the absence of knowledge about trends in abundances as well as the lack of knowledge of areas of occurrence. This case study has demonstrated that in the case of missing IWC data, bag statistics may be a good indicator for trends in abundances. As European sedentary populations of Greylag goose are mostly hunted and bag data is to some extent available [58,59], these may serve as an indicator for trends within the sedentary populations.
but considered to be allowed as part of an adjusted wildlife management this case study dem-onstrated that decision-making bodies can rely on IWC data to identify the main areas of occurrence. This knowledge provides the opportunity to set up diverse hunting regulations for areas of different wintering abundances. For example, in core areas of occurrence, hunting may not be limited by numbers, but regulated by areas where geese numbers are low. Nonetheless, our case study suggests that hunting may not always be able to modify trends in populations of sedentaryGreylag geese.
Supporting Information
S1 File. Bag data per administrative district per season.
(TXT)
S2 File. IWC data per survey site per season.
(TXT)
Acknowledgments
Our thanks go to the administrative bodies supporting us with providing the data and last not least to all the volunteers contributing to either IWC or to the hunting bag statistics. We hope our analysis improve the trust in what you do.
Author Contributions
Conceived and designed the experiments: AG AK NB. Performed the experiments: AG AK NB. Analyzed the data: AG AK NB. Contributed reagents/materials/analysis tools: AG AK NB. Wrote the paper: AG AK NB.
References
1. AEWA. Agreement on the conservation of African-Eurasian Migratory Waterbirds AEWA; 1995; Den Hague, The Netherlands.
2. CBD. Convention on biological diversity; 1992; Rio de Janeiro.
3. European Union (1979) Council directive on the conservation of wild birds—Birds directive (79/409/ EEC)
4. Lindenmayer DB, Gibbons P, Bourke MAX, Burgman M, Dickman CR, Ferrier S, et al. (2012) Improving biodiversity monitoring. Austral Ecology 37: 285–294.
5. Yoccoz NG, Nichols JD, Boulinier T (2001) Monitoring of biological diversity in space and time. Trends in Ecology & Evolution 16: 446–453.
6. Thomas L (1996) Monitoring long-term population change: Why are there so many analysis methods? Ecology 77: 49–58.
7. Singh NJ, Milner-Gulland EJ (2011) Conserving a moving target: planning protection for a migratory species as its distribution changes. Journal of Applied Ecology 48: 35–46.
8. Bunnefeld N, Baines D, Newborn D, Milner-Gulland EJ (2009) Factors affecting unintentional harvest-ing selectivity in a monomorphic species. Journal of Animal Ecology 78: 485–492. doi: 10.1111/j.1365-2656.2008.01500.xPMID:19021782
9. Gaidet-Drapier N, Fritz H, Bourgarel M, Renaud P- C, Poilecot P, Chardonnet P, et al. (2006) Cost and efficiency of large mammal census techniques: Comparison of methods for a participatory approach in a communal area, Zimbabwe. Biodiversity & Conservation 15: 735–754.
10. Kinahan AA, Bunnefeld N (2012) Effectiveness and cost efficiency of monitoring Mountain Nyala in Bale Mountains National Park, Ethiopia. Endangered Species Research 18: 105–114.
11. Sudfeldt C, Anthes N, Wahl J (2000) Stand und Perspektiven des Wasservogelmonitorings in Deutsch-land. Vogelwelt 121: 307–317.
13. BMEL (2013) Bundesjagdgesetz in der Fassung der Bekanntmachung vom 29. September 1976 (BGBl. I S. 2849), zuletzt geändert durch Artikel 1 des Gesetzes vom 29. Mai 2013 (BGBl. I S. 1386). In: BMEL, Bundesgesetzblatt.
14. Bauer S, Gienapp P, Madsen J (2008) The relevance of environmental conditions for departure deci-sion changes en route in migrating geese. Ecology 89: 1953–1960. PMID:18705381
15. Madsen J (1995) Impacts of disturbance on migratory waterfowl. Ibis 137: S67–S74.
16. Tombre IM, Tommervik H, Madsen J (2005) Land use changes and goose habitats, assessed by remote sensing techniques and corresponding goose distribution in Vesteralen, Northern Norway. Agri-culture Ecosystems & Environment 109: 284–296.
17. Grauer A, König A (2009) Management of Chamois in Bavaria (Germany): The importance of game activities in scabies control. Wildlife Biology in Practice 5: 115–127.
18. Keuling O, Greiser G, Grauer A, Strauß E, Bartel-Steinbach M, Klein R, et al. (2010) The German wild-life information system (WILD): population densities and den use of red foxes (Vulpes vulpes) and bad-gers (Meles meles) during 2003–2007 in Germany. European Journal of Wildlife Research 57: 95–105.
19. Stafford JD, Pearse AT, Hine CS, Horath AP, Horath Y, Horath MM (2010) Factors associated with hunter success for ducks on state-owned lands in Illinois, USA. Wildlife Biology 16: 113–122. 20. Bonney R, Cooper CB, Dickinson J, Kelling S, Phillips T, Rosenberg KV, et al. (2009) Citizen Science:
A developing tool for expanding science knowledge and scientific literacy. BioScience 59: 977–984. PMID:19839471
21. Dickinson JL, Shirk J, Bonter D, Bonney R, Crain RL, Martin J, et al. (2012) The current state of citizen science as a tool for ecological research and public engagement. Frontiers in Ecology and the Environ-ment 10: 291–297.
22. Tulloch AIT, Possingham HP, Joseph LN, Szabo J, Martin TG (2013) Realising the full potential of citi-zen science monitoring programs. Biological Conservation 165: 128–138.
23. Madsen J, Cracknell G, Fox T. (1999) Goose populations of the Western Palearctic—A review of status and distribution. National Environmental Research Institute, Denmark & Wetlands International.
24. Bezzel E., Geiersberger I., Lossow G. von, Pfeifer R. (2005) Brutvögel in Bayern. Stuttgart: Verlag Eugen Ulmer
25. Glutz von Blotzheim UN, Bauer KM (1990) Handbuch der Vögel Mitteleuropas. Wiebelsheim: AULA-Verlag.
26. Homma S, Geiter O (2003) Ökologie ausgewählter Wasservogelarten (Gänse / Schwäne) in Bayern (Bestand, Wanderung, Populationsbiologie, Problempotential, Managementvorschläge). Kavelstorf.
27. König A, Kleinhenz A, Hof C, Carstensen N (2013) Ökologie und Management von Wildgänsen in Bay-ern. Freising: Arbeitsgruppe Wildbiologie und Wildtiermanagement, Lehrstuhl für Tierökologie, Wis-senschaftszentrum Weihenstephan, TU-München. 203 p.
28. Delany S, Scott D (2006) Waterbird Population Estimates—Fourth Edition. Wageningen: Wetlands International. 239 p.
29. Hussell DJT, Ruelas I. E (2008) Long-term Monitoring: The Raptor Population Index in principle. In: Bildstein KL, Smith JP, Ruelas I. E, Veit RR, editors. State of North Americas birds of prey. Nuttall Orni-thological Club and American Ornithologists Union Series in Ornithology No 3. Cambridge, Massachu-setts, and Washington. pp. 151–164.
30. Bregnballe T, Noer H, Christensen TK, Clausen P, Asferg T, Fox AD, et al. (2006) Sustainable hunting of migratory waterbirds: the Danish approach. In: Boere GC, Galbraith CA, Stroud DA, editors. Water-birds around the world. The Stationery Office, Edinburgh, UK. pp. 960.
31. BayUIG (2006) Bayerisches Umweltinformationsgesetz. Bayerisches Gesetz- und Verordnungsblatt.
32. BayJG (2007) Bayerisches Jagdgesetzes—BayJG—(BayRS 792-1-L), zuletzt geändert durch § 7 des Gesetzes vom 20. Dezember 2007 (GVBl S. 958). Bayerisches Gesetz- und Verordnungsblatt.
33. Meynen E, Schmithüsen J, Gellert J, Neef E, Müller-Miny H, et al. (1961) Handbuch der naturräumli-chen Gliederung Deutschlands. Bundesanstalt für Landeskunde. Bonn-Bad Godesberg
34. Heldbjerg H, Fox AD (2008) Long-term population declines in Danish trans-Sahara migrant birds. Bird study 55: 267–179.
35. Pannekoek J, van Strien A (2001) TRIM 3 Manual (TRends & Indices for Monitoring data). Research paper no. 0102. Available:http://www.ebcc.info.
37. Fox AD, Ebbinge BS, Mitchell C, Heinicke T, Aarvak T, Colhoun K, et al. (2010) Current estimates of goose population sizes in western Europe, a gap analysis and an assessment of trends. Ornis Svecica 20: 115–127.
38. Battersby JE, Greenwood JJD (2004) Monitoring terrestrial mammals in the UK: past, present and future, using lessons from the bird world. Mammal Review 34: 3–29.
39. Block WM, Franklin AB, Ward JP, Ganey JL, White GC (2001) Design and implementation of monitor-ing studies to evaluate the success of ecological restoration on wildlife. Restoration Ecology 9: 293–
303.
40. Gibbs JP, Droege S, Eagle P (1998) Monitoring populations of plants and animals. BioScience 48: 935–940. PMID:9793622
41. Rist J, Milner-Gulland EJ, Cowlishaw GUY, Rowcliffe M (2010) Hunter reporting of catch per unit effort as a monitoring tool in a bushmeat-harvesting system. Conservation Biology 24: 489–499. doi:10. 1111/j.1523-1739.2010.01470.xPMID:20491849
42. Cooper CB, Dickinson J, Phillips T, Bonney R (2007) Citizen science as a tool for conservation in resi-dential ecosystems. Ecology and Society 12.
43. Südbeck P, Andretzke H, Fischer S, Gedeon K, Schikore T, Schröder C, et al. (2005) Methodenstan-dards zur Erfassung der Brutvögel Deutschlands. Radolfzell: Länderarbeitsgemeinschaft der Vogelschutzwarten & Dachverband Deutscher Avifaunisten e.V.
44. Fox AD, Madsen J (1997) Behavioural and distributional effects of hunting disturbance on waterbirds in Europe: Implications for refuge design. Journal of Applied Ecology 34: 1–13.
45. Tombre IM, Madsen J, Tommervik H, Haugen KP, Eythorsson E (2005) Influence of organised scaring on distribution and habitat choice of geese on pastures in Northern Norway. Agriculture Ecosystems & Environment 111: 311–320.
46. Austin GE, Rehfisch MM, Allan JR, Holloway SJ (2007) Population size and differential population growth of introduced Greater Canada Geese Branta canadensis and re-established Greylag Geese Anser anser across habitats in Great Britain in the year 2000. Bird Study 54: 343–352. PMID:
16962664
47. Rehfisch MM, Austin GE, Holloway SJ, Allan JR, O'Connell M (2002) An approach to the assessment of change in the numbers of Canada Geese (Branta canaidensis)and Greylag Geese (Anser anser) in southern Britain. Bird Study 49: 50–59.
48. Voslamber B, van der Jeugd H, Koffijberg K (2010) Broedende ganzen in Nederland. De Levende Nat-uur 111.
49. Brunner H (2014) Aktuelles zur Jagd.www.landwirtschaft.bayern.de:Bayerisches Staatsministerium für Ernährung, Landwirtschaft und Forsten, Ludwigstraße 2, 80539 München.
50. Gu W, Swihart RK (2014) Absent or undetected? Effects of non-detection of species occurrence on wildlife–habitat models. Biological Conservation 116: 195–203.
51. Pollock KH, Nichols JD, Simons TR, Farnsworth GL, Bailey LL, Sauer JR (2002) Large scale wildlife monitoring studies: statistical methods for design and analysis. Environmetrics 13: 105–119.
52. Wetlands International, SOVON (2011) Analysis of trends of selected waterbird populations in the Afri-can-Eurasian Waterbird Agreement Area Wageningen, The Netherlands: Wetlands International.
53. Kalchreuter H (1996) Waterfowl harvest and population dynamics: An overview. Gibier faune sauvage 13: 991–1008.
54. Madsen J, Guillemain M, Nagy S, Defos du Rau P, Mondain-Monval J-Y, Griffin C, et al. (2015) Towards sustainable management of huntable migratory waterbirds in Europe. A report by the Water-bird Harvest Specialist Group of Wetlands International. Wetlands International, 6700 AL Wageningen, The Netherlands.
55. Cooch EG, Guillemain M, Boomer GS, LeBreton J- D, Nichols JD (2014) The effects of harvest on waterfowl populations. Wildfowl 10/2014: 220–276.
56. Elmberg J, Nummi P, Pöysä H, Sjöberg K, Gunnarsson G, Clausen P, et al. (2006) The scientific basis for new and sustainable management of migratory European ducks. Wildlife Biology 12: 121–127.
57. Madsen J, Asferg T, Clausager I, Noer H (1996) Status og jagttider for danske vildtarter.: National Envi-ronmental Research Institute, Denmark.
58. Griffin C (2005) ARTEMIS: The Information Portal of Huntable Species in Europe. In: Pholmeyer K, edi-tor. Proceedings of the 27th Congress of IUGB. Hannover: International Union of Game Biologists.