Submitted9 October 2015 Accepted 12 February 2016 Published5 April 2016 Corresponding authors Claire Jenkins,
[email protected] Timothy J. Dallman, [email protected]
Academic editor Jose Izarzugaza
Additional Information and Declarations can be found on page 14
DOI10.7717/peerj.1752
Copyright 2016 Ashton et al.
Distributed under
Creative Commons CC-BY 4.0
OPEN ACCESS
Identification of
Salmonella
for public
health surveillance using whole genome
sequencing
Philip M. Ashton1, Satheesh Nair1, Tansy M. Peters1, Janet A. Bale1,
David G. Powell1, Anaïs Painset1, Rediat Tewolde2, Ulf Schaefer2,
Claire Jenkins1, Timothy J. Dallman1, Elizabeth M. de Pinna1,
Kathie A. Grant1,3and Salmonella Whole Genome Sequencing
Implementation Group
1Gastrointestinal Bacterial Reference Unit, Public Health England, London, United Kingdom 2Applied Laboratory and Bio-Informatics Unit, Public Health England, London, United Kingdom
3Gastrointestinal Infections, NIHR Health Protection Research Unit in Gastrointestinal Infections, London,
United Kingdom
ABSTRACT
In April 2015, Public Health England implemented whole genome sequencing (WGS) as a routine typing tool for public health surveillance ofSalmonella, adopting a multilocus sequence typing (MLST) approach as a replacement for traditional serotyping. The WGS derived sequence type (ST) was compared to the phenotypic serotype for 6,887 isolates ofS. entericasubspecies I, and of these, 6,616 (96%) were concordant. Of the 4% (n=271) of isolates of subspecies I exhibiting a mismatch, 119 were due to a process error in the laboratory, 26 were likely caused by the serotype designation in the MLST database being incorrect and 126 occurred when two different serovars belonged to the same ST. The population structure ofS. entericasubspecies II–IV differs markedly from that of subspecies I and, based on current data, defining the serovar from the clonal complex may be less appropriate for the classification of this group. Novel sequence types that were not present in the MLST database were identified in 8.6% of the total number of samples tested (including S. enterica subspecies I–IV and S. bongori) and these 654 isolates belonged to 326 novel STs. ForS. entericasubspecies I, WGS MLST derived serotyping is a high throughput, accurate, robust, reliable typing method, well suited to routine public health surveillance. The combined output of ST and serovar supports the maintenance of traditional serovar nomenclature while providing additional insight on the true phylogenetic relationship between isolates.
SubjectsBioinformatics, Genomics, Microbiology, Public Health
Keywords Whole genome sequencing,Salmonella, Bioinformatics, Multi-locus sequence typing, Public health
INTRODUCTION
TheSalmonellae are major human pathogens and represent a significant global public
variations, namely subspeciesenterica(I),salamae(II),arizonae (IIIa),diarizonae (IIIb),
houtenae(IV) andindica(VI) (Threlfall, Ward & Old, 1999). Subspecies I,S. entericasubsp.
entericacause 99% of human and animal infections. The two main pathologies associated
with S. enterica are gastroenteritis and typhoidal disease. The typhoidal Salmonellae
includeS. Typhi andS. Paratyphi A, B and C. They are host restricted, monophyletic, rarely undergo recombination events and exhibit convergent evolution driven by genome degradation (Wain et al., 2015). The majority of gastroenteritis in the UK is caused by the host generalist serovars, such asS. Typhimurium andS. Enteritidis, and host adapted serovars that are adapted to a specific animal reservoir but can infect man and include
S. Dublin,S. GallinarumS. Choleraesuis, andS. Bovismorbificans (Langridge et al., 2015). Approximately 8,000 isolates are referred to theSalmonellaReference Service (SRS) at Public Health England (PHE) each year from local and regional hospital laboratories. In April 2015, PHE implemented whole genome sequencing (WGS) as the routine typing tool for public health surveillance of Salmonellainfections. Prior to April 2015, presumptiveSalmonellaisolates referred to SRS were speciated and sub-speciated using PCR (Hopkins et al., 2009;Hopkins et al., 2011) and grouped into serovars as described in the White-Kauffman-Le Minor scheme (Grimont & Weill, 2007;Guibourdenche et al., 2010;Issenhuth-Jeanjean et al., 2014). This methodology is based on reactions of rabbit antisera to the lipopolysaccharide (O antigen encoded byrfbgenes) and flagellar antigens (phases 1 and 2 of H antigen encoded byfliC andfljB). The scheme utilises this phenotypic variation, expressed as an antigenic formulae, to divideSalmonellainto more than 2,600 serovars. Epidemiological investigations ofSalmonellainfecting humans and animals have relied on serotyping for over 70 years; national and international governmental agencies base guidelines and regulations on the serotyping method and the use of this nomenclature is a globally recognised form of communication (Swaminathan et al., 2006;EFSA, 2010). Furthermore, serovars have often been shown to correlate with host range and disease sequelae (Gordon, 2011;Wain et al., 2015;Langridge et al., 2015).
Advances in whole genome sequencing (WGS) methodologies have resulted in the ability to perform high throughput sequencing of bacterial genomes at low cost making WGS an economically viable alternative to traditional typing methods for public health surveillance and outbreak detection (Koser et al., 2012). Whilst WGS provides the opportunity to resolve bacterial strains to the single nucleotide resolution needed for identifying cases linked to a common source of infection (Dallman et al., 2015), grouping isolates into higher taxonomical clones (e.g., those defined by serotyping) is an important step. The decision to adopt WGS as a routine typing method at PHE provided the opportunity to review our approach to typingSalmonellaand to implement the MLST approach in parallel with WGS. The aim of this study was to evaluate MLST, as derived from WGS data, as a replacement for conventional serotyping ofSalmonellafor routine public health surveillance and to provide insight into the genetic population structure of allSalmonellaspecies in England and Wales during a 12 month period.
METHODS
Bacterial strains
All isolates (n=7,465) ofSalmonellafrom human cases of gastrointestinal disease submitted to SRS from local and regional hospital laboratories in England & Wales between 1st April 2014 and 31st March 2015 were sequenced in parallel with phenotypic serotyping (Table S1). Of these, 7,338 were identified as subspecies I and included 263 different serovars. The ten most common serovars in this dataset were Enteriditis (2,310), Typhimurium (1,407), Infantis (184), Typhi (184), Newport (173), Virchow (162), Kentucky (160), Stanley (146), Paratyphi A (135) and Java (99). One hundred and twenty seven isolates were identified as subspecies II–IV (S. entericasubspeciessalamae n=28;
S. entericasubspeciesarizonae n=25;S. entericasubspeciesdiarizonae n=49;S. enterica subspecieshoutenae n=20) and there was one isolate ofS. bongori. No isolates belonging to subspecies VI (S. entericasubspeciesindica) were submitted to SRS during the study period.
DNA extraction for WGS
DNA extraction ofSalmonellaisolates was carried out using a modified protocol of the Qiasymphony DSP DNA midi kit (Qiagen). In brief, 0.7 ml of overnightSalmonellaculture in a 96 deep well plate was harvested. Bacterial cells were pre-lysed in 220µl of ATL buffer (Qiagen) and 20µl Proteinase K (Qiagen), and incubated shaking for 30 min at 56◦C. Fourµl of RNase at 100 mg/ml (Qiagen) was added to the lysed cells and re-incubated for a further 15 min at 37◦C. This step increases the purity of the DNA for further downstream sequencing. Extraction of DNA from the treated cells was performed on the Qiasymphony SP platform (Qiagen) and eluted in 100µl of water. DNA concentration using the GloMax system (Promega) was determined for the following sequencing steps.
DNA sequencing
Bioinformatics workflow
FASTQ reads were quality trimmed using Trimomatic (Bolger, Lohse & Usadel, 2015) with bases removed from the trailing end that fell below a PHRED score of 30. If the read length post trimming was less than 50 bp the read and its pair were discarded. The PHE KmerID pipeline (https://github.com/phe-bioinformatics/kmerid) was used to compare the sequenced reads with 1,769 published genomes to identify the bacterial species (and
Salmonellasubspecies) and to detect cultures submitted by the local and regional hospital
laboratories that contained more than one bacterial species (mixed cultures). KmerID determines a similarity index between the FASTQ reads and each of the 1,769 published reference genomes by calculating the percentage of 18-mers in the reference that are also present in the FASTQs. Only 18-mers that occur at least twice in the FASTQ are considered present. Mixed cultures are detected by comparing the list of similarities between the sample and the references with the similarities of the references to each other, and filtering this comparison for inconsistencies. ST assignment was performed using the Metric Orientated Sequence Typer (MOST), a modified version of SRST (Inouye et al., 2012), available from https://github.com/phe-bioinformatics/MOST. The primary difference between SRST and MOST is in the metrics provided around the result, while SRST gives a single score, MOST provides a larger array of metrics to give users more details on the read level associated with their result. Preliminary analysis was undertaken using the MLST database described inAchtman et al. (2012). It takes approximately 10–15 min to run MOST using a single core on the PHE infrastructure which consists of Intel Xeon CPU E5-2680 0@ 2.70GHz, 16 cores sharing 125 Gb Memory.
For isolates that had novel STs, or a ST but no associated serovar in the Achtman MLST database, the serovar was determined by phenotypic serotyping at PHE. STs and corresponding serovars of isolates serotyped and sequenced during this study were added to a modified version of the Achtman MLST database, held and curated at PHE. These novel STs were assigned a preliminary ST (PST) and an inferred serovar was determined. The PHE MLST database currently holds 7,000 strains and 1,200 serovars and is up-dated every three months.
For some STs that contained two serotypes, whole genome SNP phylogenetic analysis was carried out by mapping the strains of interest against a reference genome from within the same sequence type (for ST909 H145100685 was used; for ST49, H143720759 was used), using BWA mem (Li & Durbin, 2009). SNPs were called using GATK2 (DePristo, Banks & Poplin, 2011) in unified genotyper mode. Core genome positions that had a high quality SNP (>90% consensus, minimum depth 10×, GQ≥30, MQ≥30) in at least one strain were extracted and RAxML v8.1.17 phylogenies determined with the gamma model of rate heterogeneity and 100 bootstraps undertaken.
RESULTS
Figure 1 Population structure of allSalmonella entericaisolates submitted to PHE from local and regional hospital laboratories in England and Wales between April 2014 and March 2015 (seeTable S1for details).
to PHE between April 2014 and March 2015 is illustrated by the minimum spanning tree inFig. 1.
Salmonellasubspecies I
For the 423 (5.8%) subspecies I isolates reported as S. Unnamed, 318 (90%) were designated a serotype from the WGS derived MLST data. The most common serovars typed in this way included S. Typhimurium (118), S. Virchow (30), S. Stanley (17),
S. Enteritidis (16),S. Infantis (14) andS. Thompson (13). Of the 7,338 strains tested, 70 (1%) had no serotype designation in the MLST database, of which 28 (40%) were serotyped phenotypically (Table S1).
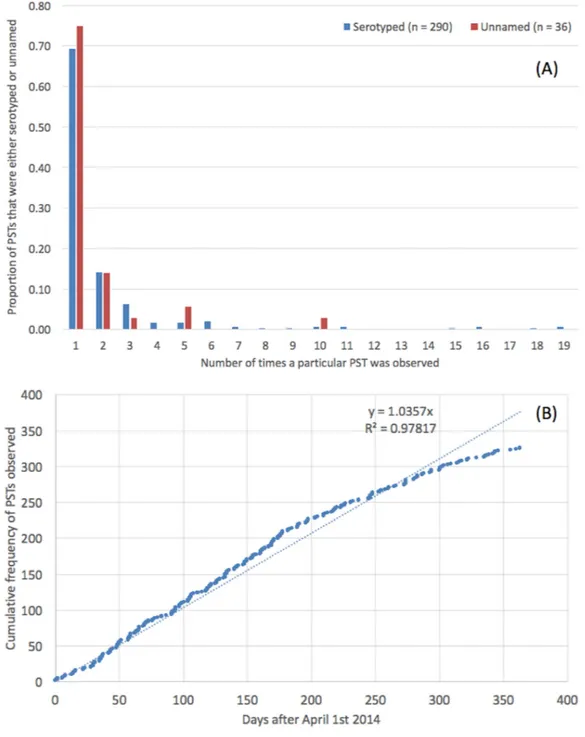
Subspecies I novel sequence types
Novel sequence types that were not present in the MLST database were identified in 8.6% (n=654) of the strains (Table S1). These 654 isolates belonged to a total of 326 novel STs, designated PST; the modal number of isolates identified per PST was one (Fig. 2A). There was no difference in the distribution of number of isolates per PST depending on whether the PST had a known serovar or belonged to an unnamed or ambiguous serotype. The rate at which PSTs were received throughout the year was plotted and revealed a linear relationship (R2=0.98,y=1.04∗x, where x=number of days since April 1st 2014) (Fig. 2B).
The serovars with the highest number of new PSTs were S. Typhimurium (n=9),
S. Stanley (n=9),S. Enteritidis (n=9) andS. Newport (n=8), although the majority of these PSTs were single locus variants (SLVs) of established STs, belonging to these serovars (S. Typhimurium 8/9,S. Stanley 7/9 andS. Newport 7/8). There were also serovars for which a large number of PSTs were identified that were not SLVs of established STs (S. Agama 5/5,S. Agbeni 5/5,S. Saint-Paul 5/5,S. Enteritidis 4/9) which may represent new eBGs that share these serotypes.
Subspecies I mismatches
Four percent (n=271) of the isolates tested exhibited a mismatch between the WGS MLST derived serovar and the phenotypic serotyping results. Of the 271 mismatches, 119 were due to a process error in the laboratory either in the phenotypic serotyping or the DNA extraction part of the WGS pipeline. With respect to the phenotypic serotyping, common errors included mislabelling samples and misinterpreting or incorrectly transcribing the antigenic structure, especially when the antigenic structures were similar. For example,
S. Agona (I 4, 12:f, g, s:-) andS. Derby (I 4, 12:f, g:-). DNA extraction errors were associated with mislabelled samples.
Twenty-six mismatches were potentially caused by the predicted serotype designation in the Achtman MLST database being incorrect which may be attributed to single entries that had been misidentified at the laboratory from which the MLST data was submitted. For example, in the original database ST1499 is represented by one entry identified by the submitter asS. Litchfield. Subsequently, phenotypic serotyping at PHE identified this ST as
S. Bovis-morbificans in more than five isolates. ST1499 belongs to eBG34 which comprises two other STs both associated withS. Bovis-morbificans, indicating that the original entry in the MLST database is likely to be incorrect.
Table 1 Examples where two serovars belonged to the same eBG and the same ST.
Serotype Antigenic structure ST
Bareilly I 6,7: y: 1,2 909
Richmond I 6,7: y: 1,5
Saintpaul I 4,5,12: e,h: 1,2 49
Haifa I 4,5,12: z,10: 1,2
Sandiego I 4,12: I,v: e,n,z15 20
Brandenburg I 4,12: e,h: e,n,z15
Uganda I 3, 10: I,z13: 1,5 684
Sinstorf I 3, 10: I,v: 1,5
Agona I 4,12: f,g,s:- 13
Essen I 4,12:
f,g,m:-Napoli I 1,9,12: I,z13: enx P3141
Zaiman I 1,9,12: I,v: enx
For 157 of the 271 mismatches, assembly based ST calls were available from Enterobase (http://enterobase.warwick.ac.uk/). We compared the STs called by our mapping pipeline and the assembly based Enterobase pipeline and the same ST was called in 100% of samples.
Serovars Enteritidis and Dublin
Of the 2,308 isolates of S. Enteritidis identified by both phenotypic serotyping and WGS MLST derived serotyping, 2,296 belonged to eBG4, including 2,200 ST11 and 76 ST183 (Fig. 1). There were five additional SLVs of ST11, four of which were novel types.
S. Gallinarum andS. Pulloram can be difficult to distinguish fromS. Enteritidis (Thomson et al., 2008) but neither of these serovars were identified in this study. Serologically,
S. Dublin ([1],9,12:g,p:-) has a similar antigenic structure toS. Enteritidis ([1],9,12:g,m:-), and inAchtman et al. (2012), eBG32 (ST74) contained bothS. Enteritidis andS. Dublin. However, in this study both isolates belonging to ST74 eBG32 typed asS. Enteriditis. Of the 2,308 isolates, 26 belonged to nine new PSTs. The most common was P3147, a previously undescribed SLV of ST11, comprising 16 cases including 10 known to have travelled to Malaysia or Singapore.
Serovar Typhimurium
In this study, eBG1 contained 1,392 isolates of S. Typhimurium and monophasic S. Typhimurium (rough and non-motile variants) (Hopkins, De Pinna & Wain, 2012). The monophasic variants also belong to eBG138 (primarily ST 36) and eBG243. In contrast to eBG1 described inAchtman et al. (2012), which was represented by a large central ST19 node with at least 27 SLV STs comprising much smaller numbers of strains, eBG1 in the PHE dataset shows a predominance of both ST19 and ST34 and less allelic variation. Only nine SLVs to ST19 were identified including three undesignated STs (Fig. 1).
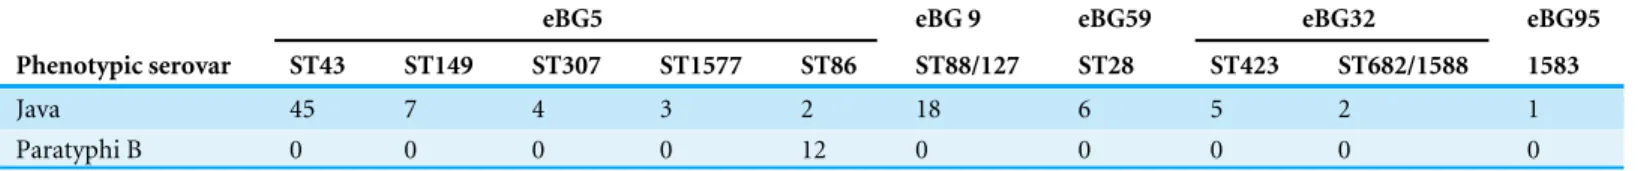
Serovars Java/Paratyphi B data
Table 2 Differences in ST between S. Java and S. Paratyphi B.S. Java isolates in this study belonged to a diverse range of eBGs and STs associated withS. Java whereasS. Paratyphi B belonged to ST86 only.
eBG5 eBG 9 eBG59 eBG32 eBG95
Phenotypic serovar ST43 ST149 ST307 ST1577 ST86 ST88/127 ST28 ST423 ST682/1588 1583
Java 45 7 4 3 2 18 6 5 2 1
Paratyphi B 0 0 0 0 12 0 0 0 0 0
associated with gastroenteritis) it is not possible to differentiate the two serotypes by serotyping alone.S. Java andS. Paratyphi B are therefore differentiated in the laboratory by their ability to ferment dextrorotatory tartrate (S. JavadTa+andS. Paratyphi BdTa−) (Malorny, Bunge & Helmuth, 2003).
The 99 isolates identified by both phenotypic serotyping and WGS MLST derived serotyping asS. Java, belonged to a diverse range of eBGs, STs and PSTs (Table 2and Fig. 1). Two of these 99 isolates belonged to ST86 and the predicted serotype from the MLST database wasS. Paratyphi B. One of these isolates was from a blood culture (associated with invasive disease) and, therefore, likely to have been misidentified phenotypically. All 12 isolates identified as S. Paratyphi B phenotypically, were identified asS. Paratyphi B ST86 by WGS MLST.
Subspecies II–IV and S. bongori
Isolates from subspecies II, III, IV, VI andS. bongoriwere not well represented in Achtman’s MLST database and thus the majority of isolates from these sub-species sequenced in this study did not belong to a previously designated eBG or ST. The population structure of the 127 non-subspecies I isolates differs markedly from that of Salmonella enterica
(subspecies 1) (Fig. 1) and shows some similarity to the population structure of lineage 3 in being a connected network of STs.
Sixteen of the 28 isolates belonging to subspecies II were previously designated S. Unnamed and the 28 strains belonged to 20 different STs. There were 25 isolates classed as subspecies IIIa (belonging to 10 different STs) and 49 in subspecies IIIb (belonging to 27 different STs). Of the 20 isolates identified as subspecies IV, 10 were designatedS. Wassenaar (P3029) by phenotypic serotyping and the 20 isolates belonged to five different STs. All isolates of subspecies II–IV andS. bongoriwere correctly speciated using the k-mer ID approach.
Population structure
As highlighted byAchtman et al. (2012), the majority of isolates in the dataset belong to eBGs that have a one-to-one relationship with a specific serovar includingS. Typhi,S. Paratyphi A andS. Heidelberg. In this study, of the serovars comprising more than 25 isolates, there were 17 serovar specific eBGs and 10 examples of a single serovar being associated with multiple eBGs (Fig. 1). There were at least six examples of more than one serovar belonging to the same eBG but different STs, for exampleS. Hadar (ST33) andS. Kottbus (ST582) both belong to eBG22 andS. Bredeney (ST306) andS.Schwarzengrund
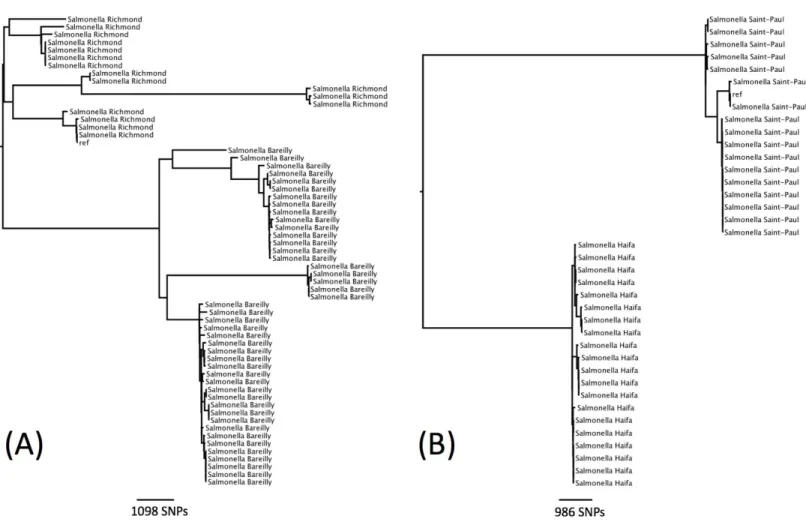
Figure 3 Phylogenetic relationship within two sequence types containing multiple serotypes.(A) Phylogenetic relationship ofS. Richmond and
S. Bareilly (ST909). (B) Phylogenetic relationship ofS. Saintpaul andS. Haifa (ST49).
There were seven examples where two serovars belonged to the same eBG and the same ST (Table 1). In all of these examples, the antigenic structures of the two serovars were similar with only one antigen differentiating the two serovars. Further analysis was carried out on two examples to determine whether this difference in antigenic structure represented a true difference in strain relatedness or a random change that is not reflected in phylogeny (for example, the insertion of phage encoded antigen). The analysis showed that the change in antigenic structure inS. Richmond (I 6,7: y: 1,2) andS.Bareilly (I 6, 7:
y: 1,5), both ST 909, and inS. Saintpaul (I 4,5,12: e,h: 1,2) andS. Haifa (I 4,5,12: z,10: 1,2), both ST49, reflected a true phylogenetic difference (Figs. 3Aand3B).
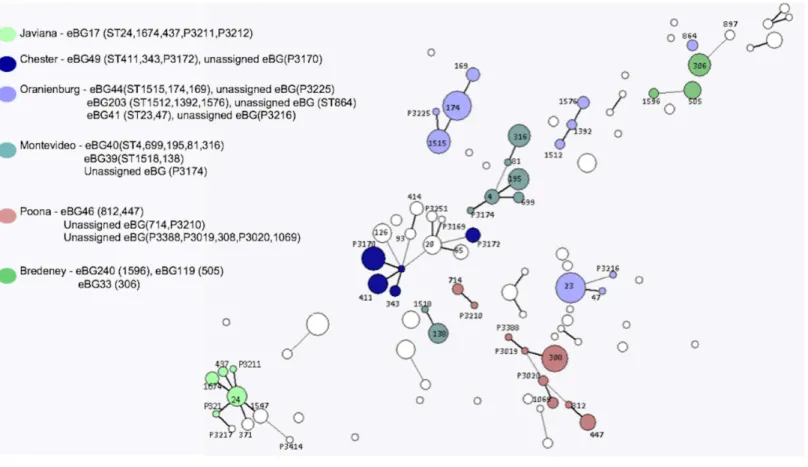
The same higher strata population structure referred to as lineage 3 for S. enterica
Figure 4 Salmonellalineage 3 population structure.Serovars in lineage 3 mainly consist of multiple eBGs and are polyphyletic by nature.
connected network (Fig. 4). The five most common examples of this in the current study, wereS. Oranienburg,S.Montevideo,S. Chester,S. Poona andS. Bredeney (Fig. 4and
Table S1). These five serovars are not represented in the top 10 serovars submitted to SRS during this surveillance period.
K-mer identification
There were 249 cultures submitted to SRS by the local hospital and regional laboratories for
Salmonellatyping that were a mix ofSalmonellaand non-Salmonellaspecies. These were
identified by the k-mer identification step and included 138Escherichia coli, 40Morganella morganii, 11Citrobacter speciesand fourEscherichia albertii.
DISCUSSION
in the field and maintain backward compatibility with historical data. It was suggested that by using the MLST approach to infer serovar, and by reporting both inferred serovar and ST, it would be possible to utilise the advantages of both methods and implement a state-of-the-art typing system while keeping disruption for reference laboratory service users to a minimum.
The PHE dataset of 6,887 subspecies I isolates that were serotyped using both traditional phenotypic methods and a derived serotype based on MLST data extracted from the genome during a 12-month time frame, provided further evidence of the robustness of the ST/eBG approach to typing. The 96% concordance between the two techniques in a reference laboratory setting is evidence of the validity and suitability of this approach. There were 451 isolates that had to be excluded from the comparison because both types of data (phenotypic and genotypic) were not available. Of these, for 94% of the isolates, it was the phenotypic serotype that could not be determined indicating that WGS MLST derived serotyping is more robust.
The PHE dataset included single serovars associated with multiple eBG, for example
S. Typhimurium andS. Newport (Sangal et al., 2010;Achtman et al., 2012) and multiple serovars belonging to the same eBG but with different STs, for exampleS. Java (ST43) and
S. Paratyphi (ST86) both belong to eBG5 (Achtman et al., 2012). In both these scenarios, the correct serovar was determined from the MLST WGS data and the combination of serovar and ST/eBG provided insight into the true phylogenetic relationship between isolates. This data clearly supports Achtman and colleagues argument that eBG and ST designation provides a more accurate representation of strain relatedness than the traditional serovar designation. The phenomenon of multiple serovars belonging to the same ST (for example
S. Richmond/S. Bareilly andS. Haifa/S. Saintpaul) was a rare but important example of serotyping providing a higher level of strain discrimination within a ST. These strains could be differentiatedin silicousing a tool to infer serovar from the genes that determine antigenic struture, such as seqsero (Zhang et al., 2015).
Isolates exhibiting monophasic properties that could not be fully serotyped phenotypically because they had an incomplete antigenic structure were matched to a ST derived serotype. The monophasic variants in this study mainly belonged to eBG1, eBG138 and eBG243 and previous studies have also shown that monophasic variants of
S. Typhimurium have emerged as a result of multiple independent genetic events (Soyer et al., 2009;Switt et al., 2009;Tennant et al., 2010). Strains with monophasic properties are reportable to European Centre for Disease Prevention and Control (ECDC) but cannot be determined using the ST approach. Alternative strategies for determining monophasic characteristics by PCR are available (Prendergast et al., 2013) and methods for extracting this information from the genome sequencing data have been developed at PHE (P Ashton & A Lewis, pers. comm., 2015).
In contrast toS. Typhurmurium, where ST could not be used to determine monophasic characteristics, in this study ST was able to differentiate the complex relationship between
S. Java (Hazard Group (HG) 2 organism) and S.Paratyphi B (HG3) with the latter
belonging to either ST42 or ST86. If this ST designation proves to be robust, MLST will facilitate the diagnosis of invasive disease and life threatening paratyphoid fever.
The MLST derived serovar correlated well with the traditional serovar designation and demonstrated many advantages over traditional phenotypic serotyping. Monophasic strains with incomplete antigenic structures were accurately assigned to serotypes. Phenotypic serotyping errors, such as misinterpreting or incorrectly transcribing the antigenic structure, were avoided. Novel types were identified, confirmed and given a PST designation. Finally, this approach lends itself to automation and rapid, high-throughput processing.
Two main issues arose during the evaluation of the MLST approach: (i) a number of STs did not have a serovar designation in the MLST database (including subspecies II–IV) and (ii) the unexpectedly large number of novel STs identified. Traditional phenotypic serotyping was required to type these isolates and the MLST database was modified and up-dated to incorporate the new data. Clearly, as we move forward the PHE MLST database will be constantly evolving and this data will be shared with colleagues in the field via existing MLST databases and their WGS compliant successors e.g., EnteroBase & BIGSdb. While it is difficult to draw conclusions based on our small sample size, MLST may not currently be an appropriate tool for the classification ofSalmonellasub-species II–IV, due to the lack of a discrete population structure of EBGs. However, non-subspecies I isolates which are mainly adapted to cold blooded animals and/or reptiles contributed to less than 1.7% of the workload during the time frame of the study. Although MLST approach is generally more discriminatory than serotyping, it does not always provide the fine resolution required for public health surveillance. Further analysis based on single nucleotide polymorphisms in the core genome compared to a type strain representing the most common eBGs is performed for outbreak detection and investigation (Ashton et al., 2015).
relationship between isolates, as well as a framework for fine level typing within eBGs for surveillance, outbreak detection and source attribution.
ACKNOWLEDGEMENTS
We would like to thank all the members of the Salmonella Whole Genome Sequencing
Implementation Group including Steve Connell, Anna Lewis, Andy Levy, Clare Maguire,
Clare Wend-Hansen, Martin Day, James Rogers, Siham Ibrahim, Arlene Barcenilla, Vineet Patel, Kiran Jayan, Anthony Underwood, Catherine Arnold and Ian Harrison.
ADDITIONAL INFORMATION AND DECLARATIONS
Funding
The research was partially funded by the National Institute for Health Research Health Protection Research Unit (NIHR HPRU) in Gastrointestinal Infections at the University of Liverpool in partnership with Public Health England (PHE), University of East Anglia, University of Oxford and the Institute of Food Research. The funders had no role in study design, data collection and analysis, decision to publish, or preparation of the manuscript.
Grant Disclosures
The following grant information was disclosed by the authors:
National Institute for Health Research Health Protection Research Unit (NIHR HPRU). Public Health England (PHE).
University of East Anglia. University of Oxford. Institute of Food Research.
Competing Interests
The authors declare there are no competing interests
Author Contributions
• Philip M. Ashton and Satheesh Nair conceived and designed the experiments, performed the experiments, analyzed the data, contributed reagents/materials/analysis tools, wrote the paper, prepared figures and/or tables, reviewed drafts of the paper.
• Tansy M. Peters conceived and designed the experiments, performed the experiments, reviewed drafts of the paper.
• Janet A. Bale conceived and designed the experiments, performed the experiments, analyzed the data, contributed reagents/materials/analysis tools, reviewed drafts of the paper.
• David G. Powell analyzed the data, contributed reagents/materials/analysis tools, reviewed drafts of the paper.
• Anaïs Painset analyzed the data, contributed reagents/materials/analysis tools, prepared figures and/or tables, reviewed drafts of the paper.
• Ulf Schaefer contributed reagents/materials/analysis tools, reviewed drafts of the paper.
• Claire Jenkins analyzed the data, wrote the paper, prepared figures and/or tables, reviewed drafts of the paper.
• Timothy J. Dallman conceived and designed the experiments, analyzed the data, contributed reagents/materials/analysis tools, wrote the paper, reviewed drafts of the paper.
• Elizabeth M. de Pinna and Kathie A. Grant conceived and designed the experiments, reviewed drafts of the paper.
DNA Deposition
The following information was supplied regarding the deposition of DNA sequences: All data from the Salmonella surveillance project are deposited in the BioProject of the SRA:PRJNA248792. Per sample accessions are available inTable S1.
Data Availability
The following information was supplied regarding data availability:
MOST code for MLST and KmerID code are available here: https://github.com/phe-bioinformatics.
Supplemental Information
Supplemental information for this article can be found online athttp://dx.doi.org/10.7717/ peerj.1752#supplemental-information.
REFERENCES
Achtman M, Wain J, Weill FX, Nair S, Zhou Z, Sangal V, Krauland MG, Hale JL, Harbottle H, Uesbeck A, Dougan G, Harrison LH, Brisse S, S. Enterica MLST
Study Group. 2012.Multilocus sequence typing as a replacement for serotyping in
Salmonella enterica.PLoS Pathogens8(6):e1002776
DOI 10.1371/journal.ppat.1002776.
Ashton PM, Peters T, Ameh L, McAleer R, Petrie S, Nair S, Muscat I, De Pinna E,
Dallman T. 2015.Whole genome sequencing for the retrospective investigation
of an outbreak ofSalmonellaTyphimurium DT 8.PLoS CurrentsEpub ahead of print Feb 10 2015DOI 10.1371/currents.outbreaks.2c05a47d292f376afc5a6fcdd8a7a3b6.
Bolger AM, Lohse M, Usadel B. 2015.Trimmomatic: a flexible trimmer for Illumina
sequence data.Bioinformatics2014:1–7DOI 10.1093/bioinformatics/btu170.
Dallman TJ, Byrne L, Ashton PM, Cowley LA, Perry NT, Adak G, Petrovska L, Ellis RJ, Elson R, Underwood A, Green J, Hanage WP, Jenkins C, Grant K, Wain J. 2015.
Whole-genome sequencing for national surveillance of Shiga Toxin-producing
Escherichia coliO157.Clinical Infectious Diseases61(3):305–312 DOI 10.1093/cid/civ318.
DePristo MA, Banks E, Poplin RE, et al. 2011.A framework for variation discovery
and genotyping using next-generation DNA sequencing data.Nature Genetics
Didelot X, Bowden R, Street T, Golubchik T, Spencer C, McVean G, Sangal V,
Anjum MF, Achtman M, Falush D, Donnelly P. 2011.Recombination and
population structure inSalmonella enterica.PLoS Pathogens7:e1002191 DOI 10.1371/journal.ppat.1002191.
EFSA Panel on Biological Hazards (BIOHAZ). 2010.Scientific Opinion on monitoring
and assessment of the public health risk of ‘‘SalmonellaTyphimurium-like’’ strains.
EFSA Journal8(10):1826 DOI 10.2903/j.efsa.2010.1826./efsajournal.htm.
Gordon MA. 2011.Invasive nontyphoidalSalmonelladisease: epidemiology,
pathogenesis and diagnosis.Current Opinion Infectious Diseases24:484–489 DOI 10.1097/QCO.0b013e32834a9980.
Grimont PAD, Weill FX. 2007.Antigenic Formulae of the Salmonella Serovars (ninth
ed.). Paris: WHO Collaborating Center for Reference and Research on Salmonella, Institut Pasteur.
Guibourdenche M, Roggentin P, Mikoleit M, Fields PI, Bockemuhl J, Grimont PA,
Weill FX. 2010.Supplement 2003–2007 (No. 47) to the White-Kauffmann-Le Minor
scheme.Research in Microbiology161:26–29DOI 10.1016/j.resmic.2009.10.002.
Hopkins KL, De Pinna E, Wain J. 2012.Prevalence ofSalmonella entericaserovar
4,[5],12:i:- in England and Wales, 2010.Euro Surveillance17(37): 20275.
Hopkins KL, Lawson AJ, Connell S, Peters TM, De Pinna E. 2011.A novel real-time
polymerase chain reaction for identification ofSalmonella entericasubspecies
enterica.Diagnostic Microbiology & Infectious Disease70(2):278–280 DOI 10.1016/j.diagmicrobio.2011.01.015.
Hopkins KL, Peters TM, Lawson AJ, Owen RJ. 2009.Rapid identification ofSalmonella
enterica subsp. arizonae andS. entericasubsp. diarizonae by real-time polymerase chain reaction.Diagnostic Microbiology & Infectious Disease64(4):452–454 DOI 10.1016/j.diagmicrobio.2009.03.022.
Inouye M, Conway TC, Zobel J, Holt KE. 2012.Short read sequence typing (SRST):
multi-locus sequence types from short reads.BMC Genomics13(1):338 DOI 10.1186/1471-2164-13-338.
Issenhuth-Jeanjean S, Roggentin P, Mikoleit M, Guibourdenche M, De Pinna
E, Nair S, Fields PI, Weill FX. 2014.Supplement 2008–2010 (no. 48) to the
White-Kauffmann-Le Minor scheme.Research in Microbiology165(7):526–530 DOI 10.1016/j.resmic.2014.07.004.
Koser CU, Ellington MJ, Cartwright EJ, Gillespie SH, Brown NM, Farrington M,
Holden MT, Dougan G, Bentley SD, Parkhill J, Peacock SJ. 2012.Routine use of
microbial whole genome sequencing in diagnostic and public health microbiology.
PLoS Pathogens8:e1002824DOI 10.1371/journal.ppat.1002824.
Langridge GC, Fookes M, Connor TR, Feltwell T, Feasey N, Parsons BN, Seth-Smith HM, Barquist L, Stedman A, Humphrey T, Wigley P, Peters SE, Maskell DJ, Corander J, Chabalgoity JA, Barrow P, Parkhill J, Dougan G, Thomson NR. 2015.
Patterns of genome evolution that have accompanied host adaptation inSalmonella.
Proceedings of the National Academy of Sciences of the United States of America
Li H, Durbin R. 2009.Fast and accurate short read alignment with Burrows-Wheeler transform.Bioinformatics25(14):1754–1760DOI 10.1093/bioinformatics/btp324.
Majowicz SE, Musto J, Scallan E, Angulo FJ, Kirk M, O’Brien SJ, Jones TF, Fazil A,
Hoekstra RM. 2010.International collaboration on enteric disease ‘burden of illness’
studies.Clinical Infectious Diseases6:882–889.
Malorny B, Bunge C, Helmuth R. 2003.Discrimination of d-tartrate-fermenting
and -nonfermentingSalmonella entericasubsp.entericaisolates by genotypic and phenotypic methods.Journal of Clinical Microbiology41(9):4292–4297 DOI 10.1128/JCM.41.9.4292-4297.2003.
Prendergast DM, Hand D, Ní Ghallchóir E, McCabe E, Fanning S, Griffin M, Egan
J, Gutierrez M. 2013.A multiplex real-time PCR assay for the identification
and differentiation ofSalmonella entericaserovar Typhimurium and monopha-sic serovar 4,[5],12:i:-.International Journal Food Microbiology166(1):48–53 DOI 10.1016/j.ijfoodmicro.2013.05.031.
Ranieri ML, Shi C, Moreno Switt AI, Den Bakker HC, Wiedmann M. 2013.Comparison
of typing methods with a new procedure based on sequence characterization for
Salmonellaserovar prediction.Journal of Clinical Microbiology51(6):1786–1797
DOI 10.1128/JCM.03201-12.
Sangal V, Harbottle H, Mazzoni CJ, Helmuth R, Guerra B, Didelot X, Paglietti B,
Rabsch W, Brisse S, Weill FX, Roumagnac P, Achtman M. 2010.Evolution and
population structure ofSalmonella entericaserovar Newport.Journal of Bacteriology
192(24):6465–6476DOI 10.1128/JB.00969-10.
Shi C, Singh P, Ranieri ML, Wiedmann M, Moreno Switt AI. 2015.Molecular
methods for serovar determination ofSalmonella.Critical Reviews Microbiology
41(3):309–325DOI 10.3109/1040841X.2013.837862.
Soyer Y, Moreno SA, Davis MA, Maurer J, McDonough PL, Schoonmaker-Bopp DJ, Dumas NB, Root T, Warnick LD, Grohn YT, Wiedmann M. 2009. Salmonella entericaserotype 4,5,12:i:-, an emergingSalmonellaserotype that represents multiple distinct clones.Journal of Clinical Microbiology47:3546–3556 DOI 10.1128/JCM.00546-09.
Swaminathan B, Gerner-Smidt P, Ng LK, Lukinmaa S, Kam KM, Rolando S, Gutierrez
EP, Binsztein N. 2006.Building PulseNet International: an interconnected system
of laboratory networks to facilitate timely public health recognition and response to foodborne disease outbreaks and emerging foodborne diseases.Foodborne Pathogens
and Disease3:36–50DOI 10.1089/fpd.2006.3.36.
Switt AI, Soyer Y, Warnick LD, Wiedmann M. 2009.Emergence, distribution, and
molecular and phenotypic characteristics ofSalmonella entericaserotype 4,5,12:i:-.
Foodborne Pathogens and Disease6(4):407–415DOI 10.1089/fpd.2008.0213.
Tennant SM, Diallo S, Levy H, Livio S, Sow SO, Tapia M, Fields PI, Mikoleit M,
Tamboura B, Kotloff KL, Nataro JP, Galen JE, Levine MM. 2010.Identification
Thomson NR, Clayton DJ, Windhorst D, Vernikos G, Davidson S, Churcher C, Quail MA, Stevens M, Jones MA, Watson M, Barron A, Layton A, Pickard D, Kingsley RA, Bignell A, Clark L, Harris B, Ormond D, Abdellah Z, Brooks K, Cherevach I, Chillingworth T, Woodward J, Norberczak H, Lord A, Arrowsmith C, Jagels K, Moule S, Mungall K, Sanders M, Whitehead S, Chabalgoity JA, Maskell D,
Humphrey T, Roberts M, Barrow PA, Dougan G, Parkhill J. 2008.Comparative
genome analysis ofSalmonellaEnteritidis PT4 andSalmonellaGallinarum 287/91 provides insights into evolutionary and host adaptation pathways.Genome Research
18(10):1624–1637DOI 10.1101/gr.077404.108.
Threlfall J, Ward L, Old D. 1999.Changing the nomenclature ofSalmonella.
Communi-cable Diseases Public Health2(3):156–157.
Wain J, Hendriksen RS, Mikoleit ML, Keddy KH, Ochiai RL. 2015.Typhoid fever.
Lancet 385(9973):1136–1145DOI 10.1016/S0140-6736(13)62708-7.
Zhang S, Yin Y, Jones MB, Zhang Z, Deatherage Kaiser BL, Dinsmore BA,
Fitzgerald C, Fields PI, Deng X. 2015.Salmonella serotype determination utilizing
high-throughput genome sequencing data.Journal of Clinical Microbiology