Lymphocyte subpopulations during
cytomegalovirus disease in renal
transplant recipients
1Departamento de Farmacologia, Faculdade de Ciências Médicas,
Universidade Estadual de Campinas, Campinas, SP, and Faculdade de Farmácia, Universidade Federal do Rio Grande do Sul, Porto Alegre, RS, Brasil
2Laboratório de Immunologia de Transplante, and
3Departamento de Nefrologia, Hospital da Santa Casa, Porto Alegre, RS, Brasil 4Departamento de Clínica Médica, Faculdade de Ciências Médicas,
Universidade Estadual de Campinas, Campinas, SP, Brasil S.M. Castro1,
H. Sporleder2,
R. Schröeder2,
A. Santos3,
V. Garcia3,
J. Neumann2 and
S.C.B. Costa4
Abstract
We have determined the number of circulating T, B and natural killer cells in renal transplant recipients in order to detect changes during cytomegalovirus (CMV) infections. Serial blood samples were taken from 61 patients on standard triple immunosuppression therapy (cyclosporin A, azathioprine and prednisone). Using two-color flow cytometry analysis, the absolute number of CD3+, CD4+, CD8+, CD19+, CD3+HLA-DR+ and CD16+56+ cells was determined. Forty-eight patients (78.7%) developed active CMV infection, and all of them subsequently recovered. Twenty of the infected patients (32.8%) presented symptoms compatible with CMV disease during the infec-tious process. The number of lymphocytes and their main subpopula-tions were normal before the onset of CMV disease. During the disease there was a decrease followed by a significant increase (P<0.005) in the number of CD3+, CD4+, CD8+ and CD3+HLA-DR+ cells. No significant changes were observed in natural killer cells or B lymphocytes during the disease. We conclude, as observed in all viremic patients recovering from infection, that recovery is associated with an increase in the number of T cell subsets. The monitoring of different lymphocyte subsets along with antigenemia can be extremely useful in the detection of patients at high risk of developing CMV symptoms, allowing the early introduction of antiviral therapy or the reduction of immunosuppression therapy.
Correspondence
S.C.B. Costa
Disciplina de Medicina Interna Departamento de Clínica Médica FCM, UNICAMP
13081-970 Campinas, SP Brasil
Fax: +55-19-3289-4107 E-mail: costa@fcm.unicamp.br
Publication supported by FAPESP.
Received September 4, 2001 Accepted January 6, 2003
Key words •Transplantation
•Cytomegalovirus
•Antigenemia
•T lymphocytes
Introduction
Cytomegalovirus (CMV) is one of the most important causes of infectious compli-cations in organ transplant recipients (1,2). It occurs in 43-92% of kidney transplant re-cipients during the first months after
sero-positive and seronegative patients (6). The incidence and intensity of the infection are largely determined by the recipient’s pre-transplant CMV serostatus, with seronega-tive recipients of seroposiseronega-tive donors having the highest risk for a serious primary infec-tion. Reinfections may also be symptomatic and severe, probably because of the fact that a reinfection by a different strain of CMV transmitted via the seropositive allograft is also possible (7). In addition, antilympho-cyte immunoglobulin (antithymoantilympho-cyte glo-bulin, antilymphocyte gloglo-bulin, OKT3 mono-clonal antibodies), used either as induction therapy or for allograft rejection treatment, and the total dose of corticosteroids enhance the rate of symptomatic CMV infection, especially in CMV-seropositive individuals (8).
The immune response against CMV is complex and not fully understood. It is un-able to eliminate the virus completely, al-lowing it to persist in a latent state. The CMV infection is known to cause changes in pe-ripheral blood lymphocyte subpopulations. A fast detection of CMV in peripheral blood has been the goal of several studies in order to correlate viremia and a clinical response. However, while monitoring CMV disease, we should also consider how much the im-mune cell response is compromised.
Immunophenotyping has not been indi-cated as relevant for the diagnosis of CMV disease (9), but is considered important in the elucidation of immune processes that involve pre- and post-infection stages (9). For this reason, immunological assays using peripheral blood lymphocytes should be con-sidered. Results obtained with murine mod-els and observations on human material have demonstrated the importance of T lympho-cytes and natural killer (NK) cells in the recovery from CMV infections (5,10).
In the present study we monitored lym-phocyte subpopulations weekly, from pre-transplantation to the 12th week post-trans-plant, and correlated these results with CMV
disease events. We measured the subsets of different lymphocyte populations, including NK cells, in peripheral blood at weekly in-tervals for 12 weeks post-renal transplanta-tion, regardless of the presence or absence of CMV disease. We examined only pheno-typic changes in different cell populations, without measuring their specificity or func-tion.
Material and Methods
Patients and management
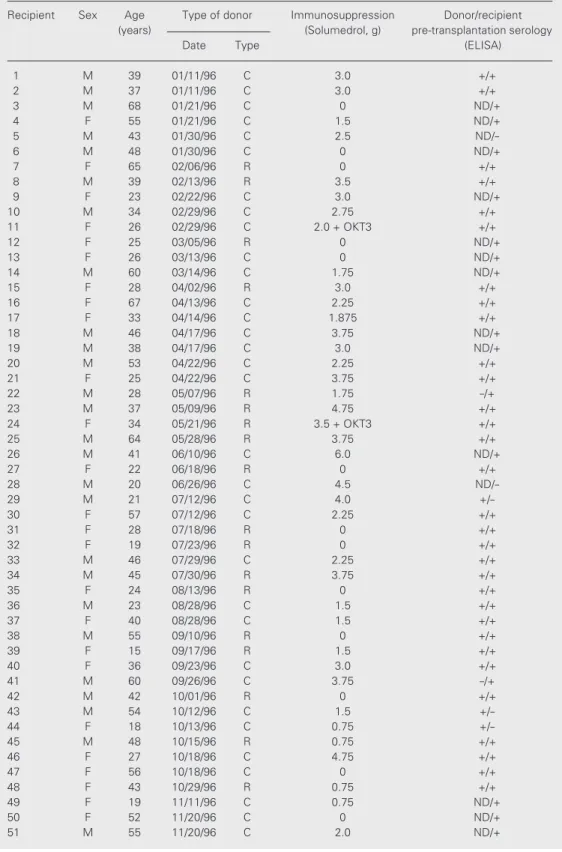
Sixty-one consecutive adult renal trans-plant recipients, with or without CMV infec-tion, were studied prospectively. Baseline immunosuppression consisted of a standard triple drug regimen consisting of cyclosporin A in combination with prednisone and aza-thioprine. None of the patients had received hyperimmune globulin or high-dose oral acyclovir as prophylaxis against CMV. Trans-plant rejections were documented by biopsy and treated with methylprednisolone pulses; steroid-resistant rejection was treated with OKT3. In cases of symptomatic CMV infec-tion, immunosuppression was reduced as a first-line measure. Ganciclovir was given when organs were involved or when CMV disease was clinically judged to be severe. The decision to initiate antiviral therapy was made on a clinical basis, and on the basis of the number of antigen-positive cells and with-out prior knowledge of the lymphocyte acti-vation status. The data of the patients studied are summarized in Table 1.
Blood samples
Table 1. Characteristics of renal transplant donors and recipients.
Recipient Sex Age Type of donor Immunosuppression Donor/recipient (years) (Solumedrol, g) pre-transplantation serology
Date Type (ELISA)
1 M 39 01/11/96 C 3.0 +/+
2 M 37 01/11/96 C 3.0 +/+
3 M 68 01/21/96 C 0 ND/+
4 F 55 01/21/96 C 1.5 ND/+
5 M 43 01/30/96 C 2.5
ND/-6 M 48 01/30/96 C 0 ND/+
7 F 65 02/06/96 R 0 +/+
8 M 39 02/13/96 R 3.5 +/+
9 F 23 02/22/96 C 3.0 ND/+
10 M 34 02/29/96 C 2.75 +/+
11 F 26 02/29/96 C 2.0 + OKT3 +/+
12 F 25 03/05/96 R 0 ND/+
13 F 26 03/13/96 C 0 ND/+
14 M 60 03/14/96 C 1.75 ND/+
15 F 28 04/02/96 R 3.0 +/+
16 F 67 04/13/96 C 2.25 +/+
17 F 33 04/14/96 C 1.875 +/+
18 M 46 04/17/96 C 3.75 ND/+
19 M 38 04/17/96 C 3.0 ND/+
20 M 53 04/22/96 C 2.25 +/+
21 F 25 04/22/96 C 3.75 +/+
22 M 28 05/07/96 R 1.75 -/+
23 M 37 05/09/96 R 4.75 +/+
24 F 34 05/21/96 R 3.5 + OKT3 +/+
25 M 64 05/28/96 R 3.75 +/+
26 M 41 06/10/96 C 6.0 ND/+
27 F 22 06/18/96 R 0 +/+
28 M 20 06/26/96 C 4.5
ND/-29 M 21 07/12/96 C 4.0
+/-30 F 57 07/12/96 C 2.25 +/+
31 F 28 07/18/96 R 0 +/+
32 F 19 07/23/96 R 0 +/+
33 M 46 07/29/96 C 2.25 +/+
34 M 45 07/30/96 R 3.75 +/+
35 F 24 08/13/96 R 0 +/+
36 M 23 08/28/96 C 1.5 +/+
37 F 40 08/28/96 C 1.5 +/+
38 M 55 09/10/96 R 0 +/+
39 F 15 09/17/96 R 1.5 +/+
40 F 36 09/23/96 C 3.0 +/+
41 M 60 09/26/96 C 3.75 -/+
42 M 42 10/01/96 R 0 +/+
43 M 54 10/12/96 C 1.5
+/-44 F 18 10/13/96 C 0.75
+/-45 M 48 10/15/96 R 0.75 +/+
46 F 27 10/18/96 C 4.75 +/+
47 F 56 10/18/96 C 0 +/+
48 F 43 10/29/96 R 0.75 +/+
49 F 19 11/11/96 C 0.75 ND/+
50 F 52 11/20/96 C 0 ND/+
51 M 55 11/20/96 C 2.0 ND/+
Virological methods
CMV antigenemia was determined as described previously (11), using the Clonab CMV - APAAP kit (Art. No. 812680, Biotest, Dreilich, Germany). Briefly, peripheral blood leukocytes were stained with immunoper-oxidase using a mixture of monoclonal anti-bodies C10 and C11, directed against the 65-kDa CMV lower matrix phosphoprotein (12). The number of antigen-positive cells per 105
polymorphonuclear leukocytes was counted and designated as the viral load. IgG and IgM antibodies against CMV were deter-mined by ELISA.
Lymphocyte immunophenotyping
A whole-blood staining method was used with the following monoclonal antibodies (Becton Dickinson, San Jose, CA, USA): anti-CD3-fluorescent isothiocyanate (T lym-phocytes), anti-CD4-phycoerythrin (PE) (TCD4 cells), anti-CD8-PE (TCD8 cells or NK cells), CD19-PE (B cells), anti-CD16+56-PE (NK cells), and anti-HLA-DR-PE (activated T, B or NK cells). A total of 2,500 cells in a lymphocyte gate were ana-lyzed with an Ortho Cytoron Absolute Flow
Cytometer (Ortho Diagnostic Systems Inc., Raritan, NJ, USA). Absolute numbers of cells were obtained using the same equipment.
Forty-one patients without clinical evi-dence of CMV disease 3 months after trans-plantation (at a time when all patients with CMV infection had manifested subset changes) served as controls.
Occurrence of CMV infection
Active CMV infection was defined by the presence of antigenemia in peripheral blood. Infection was considered to be pri-mary when the patient was CMV seronega-tive before transplantation and secondary in the presence of pre-transplant IgG antibodies against CMV (13).
Symptoms consistent with CMV disease include fever, leukopenia, thrombocytope-nia and/or elevation in serum transaminase levels (14). The diagnostic criteria for symp-tomatic CMV disease used in our study fol-lowed the recommendations made by the Workshop on Human CMV Disease (15). Work-up for microorganisms other than CMV included multiple bacteriological and fungal cultures of blood, urine and sputum, as well as serological tests and multiple chest
Recipient Sex Age Type of donor Immunosuppression Donor/recipient (years) (Solumedrol, g) pre-transplantation serology
Date Type (ELISA)
52 M 37 11/26/96 R 0 +/+
53 M 49 12/04/96 C 2.25 +/+
54 F 31 12/05/96 C 0 +/+
55 M 29 12/08/96 C 3.25 ND/+
56 M 61 12/08/96 C 0.375 + OKT3 ND/+
57 M 16 12/10/96 R 2.875 + OKT3 +/+
58 M 44 12/14/96 C 0 ND/+
59 M 29 12/17/96 R 0 +/+
60 M 31 12/31/96 C 2.5 +/+
61 M 24 12/31/96 C 1.875 +/+
R: related donor, C: cadaver donor, OKT3: antilymphocyte T, (+): positive serology for CMV, (-): negative serology for CMV, ND: not determined.
X-rays. CMV isolation was not attempted. Informed consent was obtained from all pa-tients and the protocol was approved by the Hospital’s Ethics Committee.
Statistical analysis
Since the data were not distributed nor-mally, the results are reported as medians. Differences between two groups were com-pared by the Mann-Whitney U-test. Differ-ences at this level were then determined by the minimum significant difference test after K-W ANOVA (ZAR or Altam). The signifi-cance level adopted was α = 0.05. All data
were processed and analyzed with the pro-grams Epi-Info V4 and Statistical Package for Social Sciences - SPSS V6.
Results
Sixty-one adult kidney graft recipients transplanted at Santa Casa Hospital, Porto Alegre, Brazil, were studied before trans-plantation and for 12 weeks after transplan-tation, from January to December 1996. Of the 61 patients studied, 41 (67.2%) did not show evidence of CMV disease in the first 3 months post-transplantation. Of these 41 patients, 28 (68.3%) presented active CMV infection at some time during the study, while the remaining 13 (31.7%) did not. Twenty (32.8%) patients showed symptoms compat-ible with mild or severe CMV disease at some point during the 3-month study period. The average time for the occurrence of CMV infection was 6 weeks post-transplantation, ranging from 4 to 11 weeks. Of the 20 pa-tients with CMV disease, 8 (40.0%) had a mild disease with leukopenia, fever and thrombocytopenia, and 12 (60.0%) presented severe CMV disease with fever and/or leu-kopenia and/or pericarditis and/or thrombo-cytopenia and/or hepatitis and/or gastroen-teritis and/or rejection, requiring treatment with ganciclovir. Of the 20 patients likely to have CMV disease, 17 (85.0%) were
posi-tive for antigenemia before or during the appearance of any clinical manifestation at-tributable to CMV disease, and the other 3 were positive for antigenemia after the ap-pearance of the clinical symptoms. All pa-tients with symptomatic infection healed spontaneously or after treatment with an an-tiviral drug (Tables 2 and 3).
Immunophenotyping of lymphocyte subpopulations
No cell population studied showed a sta-tistically significant difference in its abso-lute values before transplantation.
T lymphocytes (CD3+)
During the first week post-transplanta-tion, no alteration occurred in the absolute values of the total T lymphocyte population compared to the pre-transplantation period in either group (P= 0.3035). From week 2 to week 12 post-transplantation, the group with CMV disease showed lower T lymphocyte levels than the group without CMV disease. This difference between the two groups was statistically significant from week 2 (P = 0.0121) through week 8 (P= 0.0204). In the second month posttransplantation, the group with disease showed the lowest T
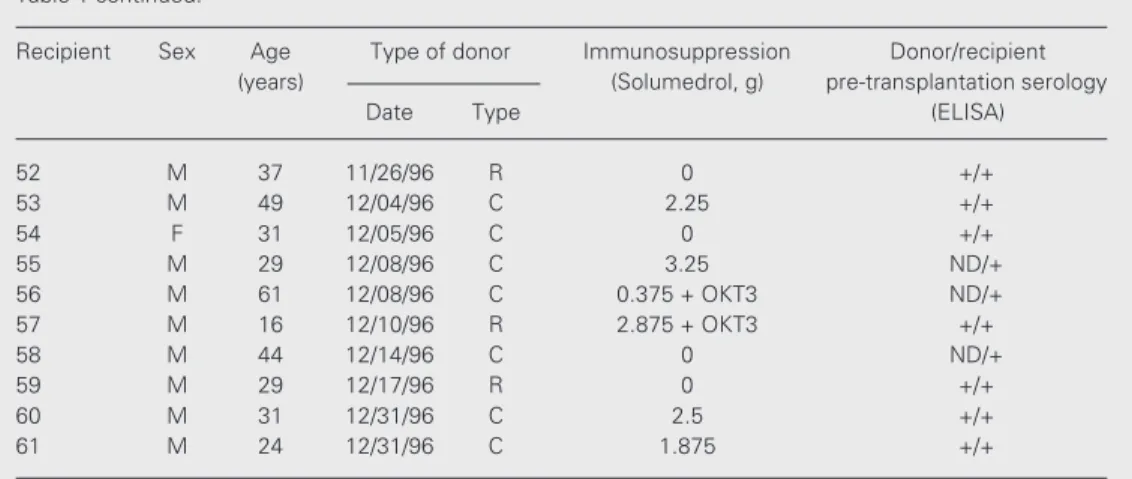
lympho-Table 2. Pre-transplantation serology of donors and recipients and presence or ab-sence of probable cytomegalovirus (CMV) disease during a period of 12 weeks post-transplantation in the 61 adult renal transplant patients studied.
Pre-transplantation Without CMV disease With probable CMV disease (IgG)
without active with active mild disease severe disease infection infection
D-/R- 0 0 0 0
D-/R+ 1 0 0 1
D+/R- 0 0 0 3
D+/R+ 10 15 6 7
Donor ND/R+ 2 12 2 0
Donor ND/R- 0 1 0 1
Total 13 28 8 12
cyte levels, coinciding with the period of greater incidence of the disease in our study. From week 8 on, T lymphocyte values started to increase in the group with disease, reaching a peak at week 10 (P= 0.0302) and returning to baseline at week 12 (P= 0.1150). Starting at week 2 post-transplantation, the group with-out CMV disease always presented 50% higher T lymphocytes values (P = 0.000) compared to the pre-transplantation period (Figure 1).
TCD4 cells (CD3+CD4+)
Prior to week 2 post-transplantation there were no significant alterations in TCD4 cell values in either group. From week 2 to week 12 post-transplantation, the group with CMV disease showed significantly lower absolute TCD4 cell values (P = 0.0003) than the group without disease. Between week 5 and 7 the group with disease reached its mini-mum TCD4 cell values, coinciding with the period of greater disease incidence in our
study. From week 8 on, TCD4 cell number started to increase in the group with CMV disease, remaining significantly lower than in the group without CMV disease until week 12 (Figure 2).
TCD8 cells (CD3+CD8+)
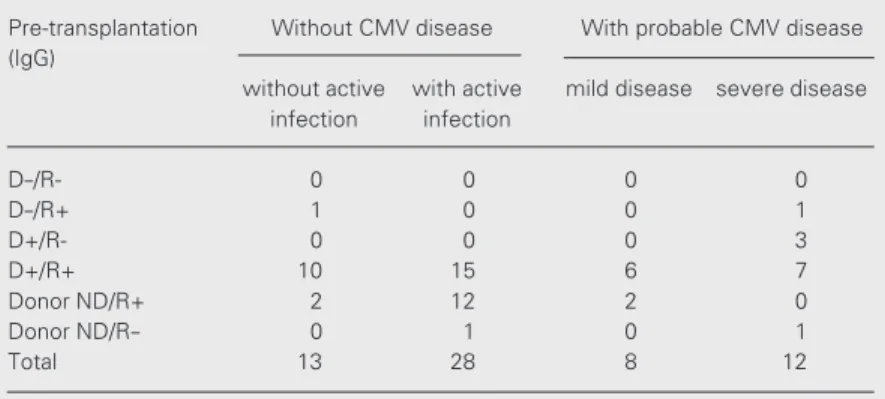
During week 1 post-transplantation there was a decrease in the total count of TCD8 cells in both groups. From week 2 post-transplantation on, the group with disease showed still decreasing TCD8 cell values, reaching minimum values at week 7. The differences between the two groups were statistically significant from week 2 to week 7 (P = 0.003). From week 8 on, TCD8 cell values in the group with CMV disease started to increase, reaching values close to baseline at week 12. The group without CMV disease had higher values than baseline from week 2 to the end of the 3-month post-transplanta-tion period (Figure 3).
Table 3. Clinical manifestations, treatment and outcome of the graft of the 20 patients with probable cytomegalovirus (CMV) disease.
Patient Signs, symptoms and laboratory Post-transplantation time Classification Treatment Outcome alterations at the beginning of clinical of CMV disease (ganciclovir)
manifestations (weeks) 10 mg kg-1 day-1 (days)
2 Fever, leukopenia, gastroenteritis 8 SD 24 Functioning
10 Fever, leukopenia 7 SD 21 Functioning
11 Fever, leukopenia, pericarditis 4 SD 21 Functioning
16 Leukopenia, thrombocytopenia 2 MD Not treated Functioning
17 Leukopenia, colitis 9 MD Not treated Functioning
20 Fever, leukopenia, thrombocytopenia 4 SD 14 Functioning
22 Fever, blister injuries on skin 7 SD 14 Functioning
24 Fever, leukopenia 4 SD 14 Functioning
25 Leukopenia 6 MD Not treated Functioning
28 Fever, leukopenia, epigastric pain 4 SD 14 Functioning
29 Fever, leukopenia, gastritis 7 SD 14 Functioning
30 Leukopenia 8 MD Not treated Functioning
40 Leukopenia 11 SD Not treated Functioning
43 Leukopenia, hepatitis 7 SD 14 Functioning
44 Fever, leukopenia, myalgia 4 SD 14 Functioning
46 Fever, leukopenia 5 SD 21 Functioning
47 Leukopenia 6 SD Not treated Functioning
53 Leukopenia 4 MD Not treated Functioning
56 Leukopenia 5 MD Not treated Functioning
58 Fever, leukopenia 5 MD Not treated Functioning
B lymphocytes (CD19+)
During the first and second week post-transplantation an increase in the total num-ber of B lymphocytes was observed both in the group without CMV and in the group with CMV disease. From the third week there was a decrease in B lymphocyte values in both groups. In the group without the disease, values remained higher than base-line during the 3-month study period, and in the group with disease, values remained lower than baseline from week 3 to week 12 post-transplantation. There were significant dif-ferences in B lymphocyte number between groups at week 4 and 7 (P = 0.0076) (data not shown).
Activated T lymphocytes (CD3+HLA-DR+)
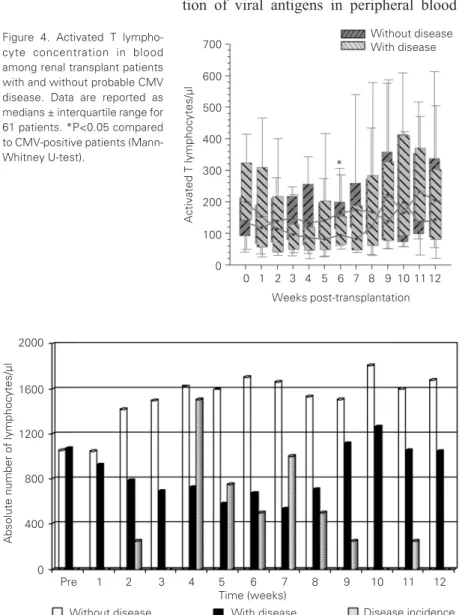
In the group with CMV disease the num-bers of activated T lymphocytes tended to decrease from week 1 to week 7 post-trans-plantation. From week 8, values increased, reaching the levels of the pre-transplantation period at week 12. The group without the disease continued to show values close to baseline throughout the 3 months of the study. At week 6 post-transplantation, both groups showed statistically significant dif-ferences in total activated T lymphocyte val-ues (P = 0.0422) (Figure 4).
NK cells (CD3-CD(16+56)+)
NK cell numbers were reduced by about 50% of their baseline values at week 1 post-transplantation, remaining low until week 12 in both groups. At week 7 the levels of NK cells decreased significantly in the group with CMV disease (P = 0.0155) (data not shown).
Discussion
Cytomegalovirus is one of the most
im-Figure 3. TCD8 cell concentra-tion in blood among renal trans-plant patients with and without probable CMV disease. Data are reported as medians ± interquar-tile range for 61 patients. *P<0.05 compared to CMV-posi-tive patients (Mann-Whitney U-test).
TCD8/µl
1500
1250
1000
750
500
250
0
0 1 2 3 4 5 6 7 8 9 10 11 12 Weeks post-transplantation
Without disease With disease
* *
* *
*
TCD4/µl
2500 2250 2000 1750 1500 1250 1000
0
0 1 2 3 4 5 6 7 8 9 10 11 12 Weeks post-transplantation
Without disease With disease
* * * * *
* * * *
* *
750 500 250
Figure 2. TCD4 cell concentra-tion in blood among renal trans-plant patients with and without probable CMV disease. Data are reported as medians ± interquar-tile range for 61 patients. *P<0.05 compared to CMV-posi-tive patients (Mann-Whitney U-test).
T lymphocytes/µl
3500 3000 2500 2000 1500 1000 500 0
0 1 2 3 4 5 6 7 8 9 10 11 12 Weeks post-transplantation
Without disease With disease
* * * *
*
* * *
Figure 1. T (CD3+) lymphocyte concentration in blood among renal transplant patients with and without probable CMV dis-ease. Data are reported as medi-ans ± interquartile range for 61 patients. *P<0.05 compared to CMV-positive patients (Mann-Whitney U-test).
portant infectious agents that attack trans-plant patients and is responsible for the sig-nificant morbidity and mortality presented by organ recipients (2,16).
Since antigenemia started to be used as a quantitative marker of viral load, more ex-tensive studies on the interaction between CMV and host immune response have be-come possible. This is a rapid, sensitive and specific technique (17-19). The early detec-tion of viral antigens in peripheral blood
leukocytes even before the disease is clini-cally apparent (12), seems to be more appro-priate to guide the beginning of early treat-ment than viral culture, and can also permit the monitoring of these cells during infec-tion (2,9). Our findings are consistent with previous studies showing that antigenemia is a suitable method for the diagnosis of active CMV infection and acts as an early marker for active CMV infection in most patients. No antigenemia-negative patient developed CMV disease over the 3-month study period (18,20), and of the 20 patients assumed to have CMV disease, 17 presented positive antigenemia prior to the appearance of clini-cal symptoms.
Of the 41 patients who did not show any signs of the disease at 3 months post-trans-plantation, 28 were positive for antigenemia at some point in the study, a fact supporting previous studies showing that CMV vire-mia/antigenemia may occur in asymptomat-ic patients (4,21,22).
The mean time for the occurrence of CMV disease was 6 weeks transplanta-tion, which confirms the first 3 months post-transplantation as the period of highest risk to contract CMV disease (22-24).
Several groups have demonstrated that the absence of cellular immunity in organ recipients is an important factor for the de-velopment of CMV disease (5,24-26). The hypothesis that the immune cell response can be monitored in vivo through
immuno-phenotyping by flow cytometry is of great practical interest. The reproducibility of this method permits serial sample analysis, as performed in the present study. In addition, the techniques for measuring the activity of cytotoxic T lymphocytes or NK cells are more expensive and laborious and require greater time and space to carry out.
The absolute number of the cells studied did not differ between the groups with and without CMV disease before transplanta-tion. Therefore, there was no difference in the numbers of any cells that would permit
Activated T lymphocytes/µl
700
600
500
400
300
200
0
0 1 2 3 4 5 6 7 8 9 10 11 12 Weeks post-transplantation
Without disease With disease
*
100 Figure 4. Activated T
lympho-cyte concentration in blood among renal transplant patients with and without probable CMV disease. Data are reported as medians ± interquartile range for 61 patients. *P<0.05 compared to CMV-positive patients (Mann-Whitney U-test).
Absolute number of lymphocytes/µl
2000
Without diseasePre 1 2 3 4 5 6 7 8 9 10 11 12 Time (weeks)
Without disease With disease Disease incidence 1600
1200
800
400
0
the prediction of behavior during the post-transplantation period, such as a tendency to contract or to resist CMV disease.
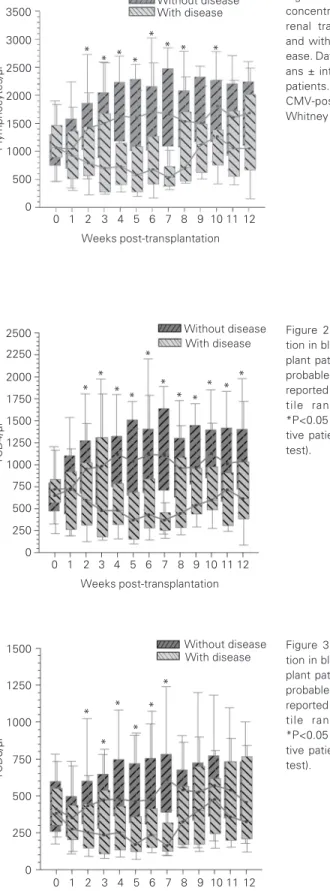
Between week 2 and 7 the absolute num-ber of total T lymphocytes, TCD4 cells and TCD8 cells in the group with CMV showed a pronounced decrease, significantly differ-ing from the group without disease. This period coincides with the mean period of CMV disease occurrence, characterized by a decrease in the cell response before the clini-cal event, with later onset of CMV disease. This pronounced reduction in the cell re-sponse seems to involve an association be-tween the immune system and CMV disease (Figure 5).
After week 7, a rise in the absolute values of total T lymphocytes occurred, with TCD8 cells showing the most significant increase. This increase in TCD8 cells may represent an effector path of activation involved in the process of recovery from CMV disease or may be nonspecific reflecting the activation of the immune system.
Since all patients recovered from CMV disease, our study agrees with the literature suggesting that TCD8 cells participate in the recovery from CMV infection (24,25,27,28). Since most patients presented infection through reactivation of the latent virus or through the acquisition of exogenous strains from transplanted organs, the TCD8 cell response does not seem to be correlated with suppression of the infection but it could be a protection against severe CMV disease (25). These effector cells seem to be involved in the control of the infection by limiting the systemic viral load.
While the role of TCD8 cells in the re-covery from CMV has been shown to be of capital importance, the participation of TCD4 cells still seems to be controversial. Our results, as well as those of Rager-Zisman et al. (29), suggest that both T cell subpopula-tions participate in the protection against fatal CMV disease. In the absence of TCD8 cells, TCD4 cells achieve a compensatory
protective activity which is absent in normal mice recovering from viral infection and TCD4 cells are believed to be instrumental in the initiation of TCD8 cell expansion via the stimulation of dendritic cells (30-32), but their role in maintaining adequate numbers and function of specific TCD8 cells is less well understood.
TCD8 and NK cells appear to play a complementary role in the recovery from CMV infection. The recovery from the dis-ease coincides with the expansion and acti-vation of TCD8 and NK cells. In a primary infection, both subpopulations act, while in secondary infections only TCD8 cells are supposed to be involved in the process. The activation of TCD8 cells was associated with the recovery from both primary and second-ary infections and with the low risk of re-lapse following antiviral therapy. NK cells mainly respond upon primary infection and seem to be less important in the recovery from secondary infection or in CMV rein-fection (33). A nonspecific cell response may limit viral replication and the spread of the disease at the early stage or upon primary infection, while a specific cell response would be necessary to control and keep the virus latent. In a secondary infection, this specific response could be more quickly activated, and NK cells would play a minor role.
We did not detect a significant quantita-tive alteration of NK cells in either group studied, probably due to the small number of primary infection cases, with the exception of week 7, when there was a significant decrease in the absolute number of NK cells in the group with CMV disease, not detected in the group without disease. The recovery period was not followed by a significant increase in NK cells.
HLA-DR expression in lymphocytes (34,35). This suggests that the activation of T cells by virus induction is not inhibited by this drug. Although changes in these cell subsets do not provide a definitive diagnosis of CMV disease, the consistency of the patterns de-scribed will provide diagnostic support for the suspicion of CMV disease, allowing the patient to be better monitored.
Our results have important clinical impli-cations, possibly establishing a “risk group” for the development of CMV disease. Thus,
the monitoring of different lymphocyte sub-sets along with antigenemia can be extremely useful in the detection of patients at high risk of developing CMV symptoms, allowing the early introduction of antiviral therapy or the reduction of immunosuppression therapy. Even though further studies are needed, es-pecially to verify the involvement of other cell populations, our results are relevant and of interest for later studies on the involve-ment of the human immune system in CMV disease.
References
1. Costa SCB, Miranda SRP, Alves G, Rossi CL, Figueiredo LTM & Costa FF (1999). Detection of cytomegalovirus infections by PCR in renal transplant patients. Brazilian Journal of Medical and Biological Research, 32: 953-959.
2. St George K & Rinaldo Jr CR (1999). Comparison of cytomegalovirus antigenemia and culture assays in patients on and off antiviral thera-py. Journal of Medical Virology, 59: 91-97.
3. Jong MD, Galasso FJ, Gazzard B, Griffiths PD, Jabs DS, Kern ER & Spector AS (1998). Summary of the II International Symposium on Cytomegalovirus. Antiviral Research, 39: 141-162.
4. van Dam JG, Damoiseaux JG, Christiaans MH & Bruggeman CA (2000). Acute primary infection with cytomegalovirus (CMV) in kid-ney transplant recipients results in the appearance of a phenotypi-cally aberrant CD8+ T cell population. Microbiology and Immunol-ogy, 44: 1011-1017.
5. Aguado S, Tejada F, Gómez E, Gago E, Tricas L, de Oña M & Alvarez-Grande J (1995). Cytomegaloviraemia and T cell subpopulations in renal transplant patients. Nephrology, Dialysis, Transplantation, 10 (Suppl 6): 120-121.
6. Larsson S, Söderberg-Nauclér C & Möller E (1998). Productive cy-tomegalovirus (CMV) infection exclusively in CD13-positive periph-eral blood mononuclear cells from CMV-infected individuals. Trans-plantation, 65: 411-415.
7. Drago F, Aragone MG, Lugani C & Rebora A (2000). Cytomegalovi-rus infection in normal and immunocompromised humans. A re-view. Dermatology, 200: 189-195.
8. Tegmeier GE (1986). Transfusion transmitted cytomegalovirus in-fections: significance and control. Vox Sanguinis, 51 (Suppl 1): 22-30.
9. Van den Berg AP, Van Son WJ, Janssen RAJ et al. (1992). Recovery from cytomegalovirus infection is associated with activation of pe-ripheral blood lymphocytes. Journal of Infectious Diseases, 166: 1228-1235.
10. Beik AI, Morris AG, Higgins RM & Lam FT (1998). Serial flow cytometric analysis of T-cell surface markers can be useful in differ-ential diagnosis of renal allograft dysfunction. Clinical Transplanta-tion, 12: 24-29.
11. van der Bij W, Torensma R, Van Son WJ, Anema J, Schirm J, Tegzess AM & The TH (1988). Rapid immunodiagnosis of active cytomegalovirus infection by monoclonal antibody staining of blood
leukocytes. Journal of Medical Virology, 25: 179-188.
12. Grefte JMM, van der Gun BTF, Schmolke S, van der Giessen M & van Son SJ (1992). Cytomegalovirus antigenemia assay - identifica-tion of the viral antigen as the lower matrix protein-pp65. Journal of Infectious Diseases, 166: 683-684.
13. Van der Giessen M, van den Berg AP, van der Bij W, Postma S, van Son WJ & The TH (1990). Quantitative measurement of cytomega-lovirus-specific IgG and IgM antibodies in relation to cytomegalovi-rus antigenemia and disease activity in kidney recipients with active cytomegalovirus infection. Clinical and Experimental Immunology, 80: 56-61.
14. Fryd DS, Peterson PK & Ferguson R (1980). Cytomegalovirus as a risk factor in renal transplantation. Transplantation, 30: 436-439. 15. Ljung P & Plotkin AS (1995). Workshop on CMV disease; definitions,
clinical severity scores and new syndromes. Scandinavian Journal of Infectious Diseases, 99 (Suppl): 87-89.
16. Rubin RH (1993). Infectious disease complications of renal trans-plantation. Kidney International, 44: 221-236.
17. Bitsch A, Kirchner H, Dennin R, Hoyer J, Fricke L, Steinhoff J, Sack K & Bein G (1993). The long persistence of CMV DNA in the blood of renal transplant patients after recovery from CMV infection. Trans-plantation, 56: 108-113.
18. Schröeder R, Mesko J, Santos A, Keitel E, Bittar A, Garcia V & Neumann J (1999). Cytomegalovirus antigenemia and renal function post-kidney-transplantation. Transplantation Proceedings, 31: 3027-3028.
19. Gotti E, Suter F, Baruzzo S, Perani V, Moioli F & Remuzzi G (1996). Early ganciclovir therapy effectively controls viremia and avoids the need for cytomegalovirus (CMV) prophylaxis in renal transplant pa-tients with cytomegalovirus antigenemia. Clinical Transplantation, 10: 550-555.
20. Gómez E, de Oña M, Mélon S, Alvarez R, Laures A, Rodríguez M, Pobes A & Alvarez-Grande J (1999). Control of cytomegalovirus disease in renal transplant patients treated with prednisone, azathio-prine and cyclosporine using intensive monitoring and decreased immunosuppression. Nephron, 82: 238-245.
Journal of Infectious Diseases, 164: 1-7.
22. Sester M, Sester U, Gartner B, Heine G, Girndt M, Mueller-Lantzsch N, Meyerhans A & Kuhler H (2001). Levels of virus-specific CD4 T cells correlate with cytomegalovirus control and predict virus-in-duced disease after renal transplantation. Transplantation, 71: 1287-1294.
23. Dafoe DC, Stoolman LM, Campbell Jr DA, Lorber MI, Waskerwitz J & Turcotte JG (1987). T cell subset patterns in cyclosporine-treated renal transplant recipients with primary cytomegalovirus disease.
Transplantation, 43: 452-454.
24. Rook AH, Qinnan Jr GV, Frederick WJR, Manischewitz JF, Dantzler T, Lee BB & Currier Jr CB (1984). Importance of cytotoxic lympho-cytes during cytomegalovirus infection in renal transplant recipients.
American Journal of Medicine, 76: 385-392.
25. Reusser P, Cathomas G, Attenhofer R, Tamm M & Thiel G (1999). Cytomegalovirus (CMV)-specific T cell immunity after renal trans-plantation mediates protection from CMV disease by limiting the systemic virus load. Journal of Infectious Diseases, 180: 247-253. 26. Zeevi A, Morel P, Spichty K et al. (1998). Clinical significance of
CMV-specific helper responses in lung transplant recipients. Human Immunology, 59: 768-775.
27. Nordøy I, Müller F, Nordal KP, Rollag H, Lien E, Aukrust P & Frøland SS (1999). Immunologic parameters as predictive factors of cytome-galovirus disease in renal allograft recipients. Journal of Infectious Diseases, 180: 195-198.
28. Reddehase MJ, Weiland F, Munch K, Jonjic S, Luske A & Koszinowski UH (1985). Interstitial murine cytomegalovirus pneu-monia after irradiation: characterization of cells that limit viral
replica-tion during established infecreplica-tion of the lungs. Journal of Virology, 55: 264-273.
29. Rager-Zisman B, Segeev Y, Blagerman S, Palmon A, Tel-Or S, Pecht M, Trainin N & Burstein Y (1994). Thymic humoral factor, THF-γ2, enhances immunotherapy of murine cytomegalovirus (MCMV) in-fection by both CD4+ and CD8+ immune T cells. Immunology Letters, 39: 23-31.
30. Ridge JP, Di Rosa F & Matzinger P (1998). A conditioned dendritic cell can be a temporal bridge between a CD4+ T-helper and a T-killer cell. Nature, 393: 474-478.
31. Schoenberger SP, Toes RE, van der Voort E, Offringa R & Melief CJ (1998). T-cell help for cytotoxic T lymphocytes is mediated by CD40-CD40L interactions. Nature, 393: 480-483.
32. Gamadia LE, Rentenaar RJ, Baars PA, Remmerswaal EBM, Surachno S, Weel JF, Toebes M, Schumacher TN, tem Berge IJ & van Lier RA (2001). Differentiation of cytomegalovirus-specific CD8+T cells in healthy and immunosuppressed virus carriers. Blood, 98: 754-761. 33. Van den Berg AP, van Son WJ, Tegzess AM & The TH (1993).
Cellular immune activation reflects antiviral immunity and is a favor-able prognostic marker in patients with cytomegalovirus infection.
Transplantation Proceedings, 25: 1419-1420.
34. Siegel DL, Fox I, Dafoe DC, Power M, Asplund M, Zellers L, Barker CF & Prystowsky MB (1989). Discriminating rejection from CMV infection in renal allograft recipients using flow cytometry. Clinical Immunology and Immunopathology, 51: 157-171.