ISSN 0100-879X
BIOMEDICAL SCIENCES
AND
CLINICAL INVESTIGATION
www.bjournal.com.br
www.bjournal.com.br
Volume 44 (7) 606-728 July 2011
Braz J Med Biol Res, July 2011, Volume 44(7) 652-659
Effect of silybin on high-fat-induced fatty liver in rats
Jiayin Yao, Min Zhi and Minhu Chen
doi: 10.1590/S0100-879X2011007500083
Faculdade de Medicina de Ribeirão Preto Campus
Ribeirão Preto
Institutional Sponsors
The Brazilian Journal of Medical and Biological Research is partially financed by
analiticaweb.com.br S C I E N T I F I C Hotsite of proteomics metabolomics
Effect of silybin on high-fat-induced
fatty liver in rats
Jiayin Yao
1, Min Zhi
1and Minhu Chen
21Department of Gastroenterology, the Sixth Affiliated Hospital,
Sun Yat-Sen University, Guangzhou, Guangdong Province, China
2Department of Gastroenterology, the First Affiliated Hospital,
Sun Yat-Sen University, Guangzhou, Guangdong Province, China
Abstract
Silybin, a natural antioxidant, has been traditionally used against a variety of liver ailments. To investigate its effect and the underlying mechanisms of action on non-alcoholic fatty liver in rats, we used 60 4-6-week-old male Sprague-Dawley rats to
establish fatty liver models by feeding a high-fat diet for 6 weeks. Hepatic enzyme, serum lipid levels, oxidative production, mitochondrial membrane fluidity, homeostasis model assessment-insulin resistance index (HOMA-IR), gene and protein expres -sion of adiponectin, and resistin were evaluated by biochemical, reverse transcription polymerase chain reaction (RT-PCR) and Western blot analysis. Compared with the model group, silybin treatment (26.25 mg·kg-1·day-1, started at the beginning of
the protocol) significantly protected against high-fat-induced fatty liver by stabilizing mitochondrial membrane fluidity, reducing
serum content of alanine aminotransferase (ALT) from 450 to 304 U/L, decreasing hepatic malondialdehyde (MDA) from 1.24
to 0.93 nmol/mg protein, but increasing superoxide dismutase (SOD) and glutathione (GSH) levels from 8.03 to 9.31 U/mg
protein and from 3.65 to 4.52 nmol/mg protein, respectively. Moreover, silybin enhanced the gene and protein expression of adiponectin from 215.95 to 552.40, but inhibited that of resistin from 0.118 to 0.018. Compared to rosiglitazone (0.5 mg·kg-1·day-1,
started at the beginning of the protocol), silybin was effective in stabilizing mitochondrial membrane fluidity, reducing SOD as
well as ALT, and regulating gene and protein expression of adiponectin (P < 0.05). These results suggest that mitochondrial membrane stabilization, oxidative stress inhibition, as well as improved insulin resistance, may be the essential mechanisms for the hepatoprotective effect of silybin on non-alcoholic fatty liver disease in rats. Silybin was more effective than rosiglitazone
in terms of maintaining mitochondrial membrane fluidity and reducing oxidative stress.
Key words: Non-alcoholic fatty liver disease; Mitochondrial membrane fluidity; Lipid peroxidation; Insulin resistance; Silybin
Introduction
Correspondence: Min Zhi, Department of Gastroenterology, the Sixth Affiliated Hospital, Sun Yat-Sen University, 26th Yuancun the
second Road, Guangzhou, Guangdong Province 510655, China. Fax: +86-020-3825-4116. E-mail: [email protected]
Received March 1, 2011. Accepted June 13, 2011. Available online July 8, 2011. Published July 25, 2011.
Non-alcoholic fatty liver disease (NAFLD), strongly as-sociated with insulin resistance and metabolic syndrome (1,2), is one of the common liver diseases affecting at least 24-42% of adults in the Western population (3) and 5-40% in the Asia-Pacific region (3,4). NAFLD represents a spectrum of liver disorders ranging from simple steatosis to non-alcoholic steatohepatitis (NASH) and advanced he -patic fibrosis or even cirrhosis (5). Approximately 12-24% of patients with simple steatosis are estimated to develop NASH after 8-13 years. Depending on the degree of fibrosis at baseline, 15-25% of patients with NASH go on to develop cirrhosis over a similar period of time (4,6).
NAFLD is considered to be one of the clinical features of metabolic syndrome in which insulin resistance plays a key role (7,8). As shown by Marchesini et al. (9) and Sanyal et
al. (10) using euglycemic-hyperinsulinemic clamping, insulin resistance is present in both hepatic steatosis and NASH. Over the last decade, adipose tissue has emerged as an endocrine organ producing adipocytokines, which play a central role in energy homeostasis and have an essential effect on the pathogenesis and progress of NAFLD (11). We particularly focused on insulin resistance and hepatic expression of adipocytokines in NAFLD models and on how they changed with the use of silybin and rosiglitazone.
im-Effect of silybin on NAFLD rats 653
pairs fatty liver homeostasis and induces overproduction of ROS that in turn trigger lipid peroxidation and cytokine release and even lead to cell death (13). Adaptive mito-chondrial membrane fluidity is considered to be a key factor in maintaining the functional integrity of hepatic mitochondria (14). It is important to evaluate the asso-ciation between mitochondrial membrane fluidity and the progression of NAFLD, which may lead to new insights into the pathogenesis and the promising treatment.
Silybin, a natural antioxidant, has long been used for the treatment of chronic liver diseases without a confirmed pathogenesis. We proposed to evaluate the effects of non-complex silybin on animal models of NAFLD induced by a high-fat diet for 6 weeks, in order to deter-mine the probable mechanisms of action of this agent, and to compare its effect to that of the insulin sensitizer thiazolidinedione.
Material and Methods
Animals
Sixty healthy 4-6-week-old male Sprague-Dawley rats were obtained from the Experimental Animal Center of Sun Yat-Sen University. Animals were maintained on a 12:12-h artificial light-dark cycle and housed in 12 cages with 5 rats each. The experiments were performed according to NIH guidelines (NIH Pub. No. 85-23, revised 1996) and were approved by the Animal Care and Use Committee of Sun Yat-Sen University (#20091201001). All experiments were performed in the city of Guangzhou, China.
Protocol
Non-complex silybin was purchased from Tianjin Tian-shili Pharmaceutical Co., Ltd., China, and rosiglitazone was purchased from Jinan Zhongke Yitong Chemical Co., Ltd., China. The doses of silybin and rosiglitazone were equivalent. We calculated the most suitable dose for rats according to the following formulas: dose for rats = (Xmg/ kg x 70 kg x 0.018) / 0.2 kg = 6.3 Xmg/kg, where X = the effective dose for man; 70 kg = the standard weight of a man; 0.018 = ratio of the equivalent dose between man and rat based on body surface area; 0.2 kg = the standard weight of a rat(15).
After a 1-week accommodation, the 60 Sprague-Dawley rats were divided randomly into four groups of 15 rats each: control group (standard diet + intragastric distilled water), model group (high-fat diet + intragastric distilled water), rosiglitazone group (high-fat diet + intra-gastric rosiglitazone, 0.5 mg·kg-1·day-1 for 42 days), and
silybin group (high-fat diet + intragastric silybin, 26.25 mg·kg-1·day-1 for 42 days).
Food intake was recorded throughout the 6-week treatment with silybin and rosiglitazone. A high-fat diet containing 20% lard + 1% cholesterol was provided by the Experimental Animal Center of Guangdong Province.
Autopsy
At the end of the 6th week, rats were anesthetized after 12 h of fasting, and blood samples were collected into tubes by cardiac puncture for blood biochemistry. Liver tissue was rapidly dissected, cut and fixed in 10% form -aldehyde saline solution for histological analysis. Another piece of fresh liver tissue was used for the mitochondrial membrane fluidity assay and for the determination of the hepatic content of malondialdehyde (MDA), superoxide dismutase (SOD) and glutathione (GSH) using commercial assay kits (Sigma-Aldrich, USA). The remaining tissue was snap frozen in liquid nitrogen and stored at -80°C for reverse transcription polymerase chain reaction (RT-PCR) and Western blot analysis.
All surgical and experimental procedures were per-formed according to the guidelines for the care and use of animals approved by the Sun Yat-Sen University.
Determination of serum aminotransferase and lipid levels
Blood samples were collected into tubes by cardiac puncture. Serum levels of aspartate aminotransferase (AST), alanine aminotransferase (ALT), total cholesterol (TC), triglycerides (TG), high-density lipoprotein (HDL-C) and low-density lipoprotein cholesterol (LDL-(HDL-C) were determined with an Olympus AU400 Clinical Chemistry analyzer (Japan).
Determination of hepatic oxidative enzymes and homeostasis model assessment-insulin
resistance (HOMA-IR)
Liver tissue was homogenized in 9 volumes of cold buffer at 4°C. The homogenates were then centrifuged at 4°C (3000 rpm/min, 15 min), and the supernatant was stored for later determinations. GSH levels and MDA and SOD activities were measured using commercial assay kits (Sigma-Aldrich) according to manufacturer instructions (16). HOMA-IR was calculated as follows: HOMA-IR = [fasting glucose (mM) x fasting insulin (μU/ mL) / 22.5] (17).
Liver histology
Mitochondrial membrane fluidity determination Liver samples were homogenized at 4°C after the addition of 5 mL homogenate containing 250 mM sucrose, 5 mM EDTA, and 10 mM phosphate buffer, pH 7.4. We isolated mitochondria by the method of differential centrifugation (19). Briefly, we added 3 mL 2 µM 1,6-diphenyl-1,3,5-hexatriene liquid (purchased from Sigma-Aldrich), to a 1-mL mitochondrial suspension, which was incubated at 25°C with continuous stirring for 30 min. Fluorescence was monitored with a Perkin Elmer LS 55 fluorescence spectrometer (Waltham, USA) at 22 ± 0.1°C. Fluorescent polarization (P) was measured at excitation and emission wavelengths of 360 and 432 nm, respectively. The emis-sion intensity of vertically polarized light was detected by an analyzer oriented parallel (IVV) or perpendicular (IVH) to the excitation plane. A correction factor for the optical system, G, was used. P was calculated according to Equation 1, and η according to Equation 2. The higher the value of η, the lower the fluidity of the mitochondrial membrane.
(Eq. 1)
(Eq. 2)
Isolation of total liver RNA and RT-PCR analysis
Total liver RNA was isolated using Trizol according to manufacturer instructions (Qiagen, USA). Total RNA (500 ng) was used for cDNA synthesis and 1 µL of each reverse transcription product was added to 9 µL of the reaction MasterMix (containing buffer, SYGB, Hotstart Taq poly -merase, and dNTPs), 0.2 µL 25 mM dNTPs, 0.5 µL 25 µM corresponding primers, and 9.3 µL ddH2O for PCR ampli
-fication. PCR was initiated at 94°C for 2 min followed by 40 cycles at 94°C for 25 s, 58°C for 30 s, and 68°C for 30 s, and a 5-min final extension at 68°C after the last cycle. Number of cycles and annealing temperature for each primer pair were optimized. The mRNAs examined and
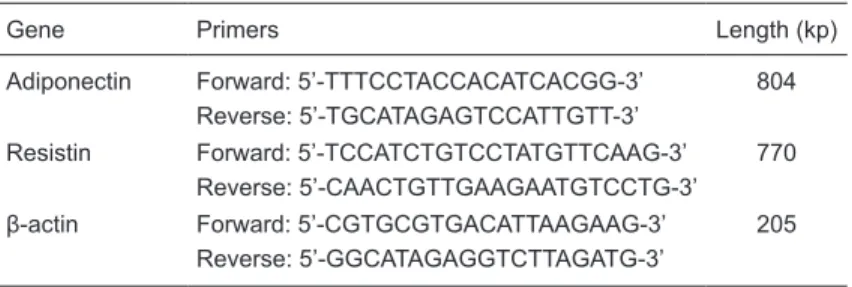
the sequences of the primers used are listed in Table 1. The relative levels of the target mRNAs were normalized to the correspond-ing levels of β-actin mRNA in the same cDNA sample by using a standard curve method recommended by the LightCycler Software Version 3.5 (Roche Molecular Diagnostics Systems, France).
Western blot analysis
Frozen liver tissue was homogenized in lysis buffer (20 mM Tris-HCl, 150 mM NaCl, 1
mM EDTA, 1 mM EGTA, 10 g/L Triton, 1 ng/L leupeptin and 1 mM PMSF, pH 7.5) at 100°C for 5 min. Protein content was estimated by the bicinchoninic acid (BCA) method. Twenty micrograms of total protein from each sample was separated on 10% polyacrylamide gels, transferred to a nitrocellulose membrane and blotted with goat anti-adiponectin (1:2000 dilution, from Roche Molecular Diagnostics Systems), goat anti-resistin (1:2000 dilution, from Santa Cruz Biotechnol-ogy, USA), and goat anti-β-actin (1:10,000 dilution, from Santa Cruz Biotechnology). The immunoreactive proteins were visualized with HRP-conjugated goat anti-mouse IgG (1:2000 dilutions, from Santa Cruz Biotechnology). After washing with PBST, an electrochemiluminescent reagent (ECL) was used for detection. Results are reported relative to the β-actin band density used as the load control.
Statistical analysis
Data are reported as means ± SD. Data groups were compared by one-way analysis of variance (ANOVA) followed by the Bonferroni multiple comparisons test. Statistical significance for expression analysis was also assessed by ANOVA and the differences identified were tested by the unpaired Student t-test. Nonparametric data are reported as the median (range) and were analyzed by the Mann-Whitney test. A P value of <0.05 was considered to be significant.
Results
Effects of the high-fat diet on gross hepatic manifestations
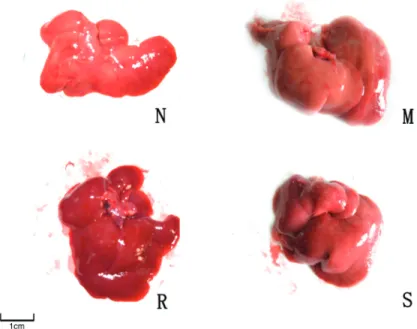
After a 6-week consumption of the high-fat diet, the liver of the control group was of moderate texture, with a smooth and red-brown surface. In contrast, hepatic volume was enlarged, and of darker color and hard texture in the model group. The liver conditions of the groups treated with silybin and rosiglitazone were intermediate between those of the above two groups (Figure 1).
Effects of the high-fat diet on hepatopathological manifestations
The liver lobules of the control group were distinct, and
Table 1. Primers and size of products for each target gene.
Gene Primers Length (kp)
Adiponectin Forward: 5’-TTTCCTACCACATCACGG-3’ 804 Reverse: 5’-TGCATAGAGTCCATTGTT-3’
Resistin Forward: 5’-TCCATCTGTCCTATGTTCAAG-3’ 770 Reverse: 5’-CAACTGTTGAAGAATGTCCTG-3’
Effect of silybin on NAFLD rats 655
the liver cell cords were arranged regularly (Figure 2, N). However, the model group (Figure 2, M) showed typical ste
-atosis accompanied by cytological ballooning and mild to moderate lobular inflammatory cell infiltration. The degree of hepatic injury including steatosis, cytological ballooning and lobular inflammation was attenuated in the silybin and rosiglitazone groups (Figure 2, S and R, respectively). The median scores were 0 (0-3) for the controls, 3.5 (2-4) for the model group (P < 0.05 vs control), 2 (0-3) for the rosiglitazone group (P < 0.05 vs the model group), and 2.3 (0-3) for the silybin group (P < 0.05 vs the model group).
Fat accumulated diffusely in the hepatic tissue of the model group (Figure 3, M). When stained with Sudan III, the cytochylema of hepatic cells was salmon pink in color. After treatment with rosiglitazone and silybin, fat accumulation was reduced, with fewer hepa-tocytes showing a salmon pink cytochylema (Figure 3, R and S, respectively).
Hepatic enzymes and serum lipid and HOMA-IR levels
After 6 weeks on a high-fat diet, rats in the model group exhibited increased TG, TC, LDL-C, ALT, and AST levels compared to control (P < 0.05). The serum levels of HDL-C tended to decline in the model group, but the difference was not statistically sig-nificant. After treatment with rosiglitazone and silybin, TG, AST and ALT levels were decreased compared to the model group (P < 0.05). The decline of AST and ALT was more obvious in the silybin group than in the rosiglitazone group (P < 0.05). As the index of insulin resistance, HOMA-IR tended to increase in the model group (P < 0.05 vs control), but showed a decline after treatment with silybin and rosiglitazone (P < 0.05 vs the model group) (Table 2).
Hepatic levels of MDA, SOD and GSH
The hepatic contents of antioxidant parameters, namely, MDA, SOD and GSH, were determined. As shown in Table 3, the high-fat diet caused an elevation of hepatic MDA, but a decline of GSH and SOD com -pared to control. The elevated MDA level was reduced by 22% and the GSH and SOD levels increased by 12 and 38% in the rosiglitazone group. Similarly, MDA decreased by 25% and GSH and SOD increased by 16 and 24% in the silybin group. Compared to rosiglitazone, silybin was more effective in elevating the content of hepatic SOD (8.96 ± 2.48 vs 9.31 ± 2.25, P < 0.05).
Figure 1. Rat liver characteristics of the control group (N), model group (M), rosiglitazone-treated group (R), and silybin-treated group (S). See legend to Ta-ble 2 for explanation of groups.
Figure 2. The micrographs show typical hepatic steatosis in the model group (M) with a mass of large fat granules (black arrows). In contrast, fewer and smaller
fat granules are observed in HE-stained sections from rosiglitazone- and
Determination of mitochondrial membrane fluidity The microviscosity of liver mitochondria increased in the model group (P < 0.05 vs control). After treatment with rosiglitazone and silybin, mitochondrial
mi-croviscosity was significantly decreased (P < 0.05 vs the model group). Since the fluidity of the mitochondrial membrane varies in-versely with microviscosity, we assumed that antioxidant therapy with silybin and insulin resistance amelioration with rosiglitazone would both reverse the destruction of mito-chondrial membrane integrity and stabilize the fluidity of the mitochondrial membrane. Although mean microviscosity was lower in the silybin group than in the rosiglitazone group, there was no statistically significant difference (P > 0.05; Table 3).
Hepatic gene and protein expression of adiponectin and resistin
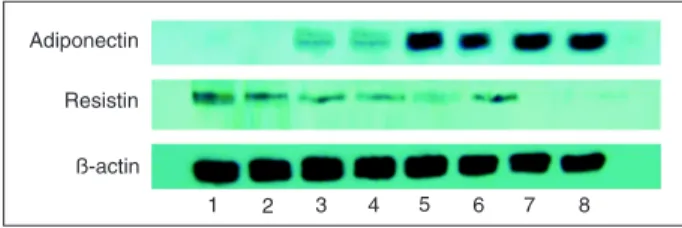
The gene and protein expression levels of adiponectin decreased in the NAFLD model compared to control and increased after treatment with rosiglitazone and silybin. However, the gene and protein expression of resistin increased in the model group, but decreased after pharmaceutical intervention (Table 4; Figure 4).
Discussion
NAFLD represents several liver diseases with the hallmark of fat infiltration (steatosis) in the absence of significant chronic alcohol consumption. The biological mechanism underlying the occurrence of steatosis and progression to NASH is not entirely under -stood.
Currently, the pathogenesis NASH is proposed to involve a response to fat ac-cumulation in the hepatocytes coupled with mitochondrial dysfunction, which may manifest as disrupted fatty acid oxidation, depressed bioenergetics and increased oxidative stress arising from enhanced generation of ROS and reactive nitrogen species (20,21). Indeed, a key functional change of liver mitochondria in animal models of high-fat-diet-induced fatty liver disease is the inability to maintain membrane fluidity. Since adaptive mitochondrial membrane fluidity is considered to be the key factor in maintaining the functional integrity of hepatic mitochondria, it represents a sensitive marker for mitochondrial function (13). Increased
ROS and their interaction with polyunsaturated fatty acids (PUFAs) induce lipid peroxidation within the cell and result in the formation of 4-hydroxy-2-nonenal (HNE), MDA and
Figure 3. The micrographs show more numerous and larger fat granules salmon pink in color when stained with Sudan III in the model group (M, black arrows). Fewer and smaller fat granules could be seen in rosiglitazone- and silybin-treated groups (R and S, respectively; black arrows). N = control group. See legend to Table 2 for explanation of groups.
Table 2. Effect of rosiglitazone and silybin administration on serum lipid levels,
hepatic enzymes and HOMA-IR of rats with fatty liver induced by 6 weeks of
high-fat diet.
Group TC (mM) TG (mM) HDL-C (mM) LDL-C (mM) Control 1.71 ± 0.37* 0.98 ± 0.51* 0.64 ± 0.15 0.17 ± 0.09* Model 2.74 ± 0.65 1.51 ± 0.37 0.47 ± 0.16 0.54 ± 0.23 Rosiglitazone 2.34 ± 0.41 1.27 ± 0.50* 0.53 ± 0.16 0.28 ± 0.09 Silybin 2.21 ± 0.57 1.14 ± 0.46* 0.59 ± 0.21 0.29 ± 0.12
Control group (N = 15) = standard diet + intragastric distilled water; model group (N = 14) = high-fat diet + intragastric distilled water; rosiglitazone group (N = 15) = high-fat diet + 0.5 mg·kg-1·day-1 intragastric rosiglitazone for 42 days; silybin
group (N = 15) = high-fat diet + 26.25 mg·kg-1·day-1 intragastric silybin for 42
days; TC = total cholesterol; TG = triglyceride; HDL-C = high-density lipoprotein
cholesterol; LDL-C = low-density lipoprotein cholesterol; ALT = alanine amin-otransferase; AST = aspartate aminotransferase; HOMA-IR = homeostasis model of assessment for insulin resistance index. *P< 0.05 vs the model group; #P <
0.05 vs the rosiglitazone group (Bonferroni multiple comparisons test). Group ALT(U/L) AST(U/L) HOMA-IR
Effect of silybin on NAFLD rats 657
SOD (22), which can freely diffuse into the extracellular space to affect distant cells, therefore amplifying the effects of oxidative stress, decreasing the capacity for ATP syn-thesis, resulting in disorder of mitochondrial function and of structure integrity manifested by a decline in mitochondrial membrane fluidity (23,24).
In the present study, we found that our high-fat diet led to the development of NAFLD in rats, as confirmed by histological findings. We observed decreased mitochondrial membrane fluidity in the model group, which indicated ultrastructural mitochondrial alterations and mitochondrial dysfunction. Moreover, we observed increased ALT and AST levels in the model group, demonstrating liver impair-ment. Increased hepatic enzymes affected nucleotide and protein synthesis, increased proinflammatory cytokine levels and activated stellate cells, ultimately leading to liver dysfunction. Levels of peroxidation products such as MDA increased while hepatic GSH and SOD content decreased in the model group. The elevation of MDA and the decline of SOD originated from lipid peroxidation in hepatocytes due to mitochondrial dysfunction. In addition, serum TG, TC and LDL-C levels were increased in NAFLD rats, prob-ably due to lipid oxidation and mitochondrial impairment. Our findings agree with the viewpoint that mitochondrial
dysfunction participates in the pathogenesis of NASH at different levels, mainly including lipid oxidation impairment and the induction of peroxidative production.
Insulin resistance may play an important role in the de-velopment of NAFLD since the disease itself is commonly observed in patients with obesity or type II diabetes. Insulin resistance leads to defective insulin-mediated inhibition of lipolysis, while hyperinsulinemia enhances the hepatic synthesis of free fatty acids and inhibits the synthesis of apolipoprotein (25,26). Thus, insulin resistance results in both increased adipose tissue lipolysis and increased he-patic lipogenesis leading to lipid accumulation, ultimately leading to NASH. In this study, serum HOMA-IR levels tended to increase in the model group compared to control, indicating that hyperinsulinemia and insulin resistance were present in rats with NAFLD.
Adiponectin increases β-oxidation of free fatty acids and/or decreases de novo free fatty acid production within the hepatocytes, thus preventing lipid accumulation (27,28). Kamada et al. (29) showed that adiponectin knockout rats develop more severe hepatic steatosis than wild-type rats when fed a diet aiming to induce NASH. Resistin, an adipokine secreted by adipose tissue and macrophages (30), may stimulate TNF-α and IL-12 in macrophages by a nuclear factor (NF)-kappa B-dependent pathway (31). Treatment with resistin markedly induces the gene expres-sion of the suppressor of cytokine signaling 3 (SOCS3), a known inhibitor of insulin signaling (32). In our study, we Figure 4. Protein expression of adiponectin and resistin in the liver. Lanes 1 and 2, Model group; lanes 3 and 4, silybin group;
lanes 5 and 6, rosiglitazone group; lanes 7 and 8, control group. See legend to Table 2 for explanation of groups.
Table 3. Effects of rosiglitazone and silybin on hepatic MDA, SOD and GSH levels and mitochondrial membrane fluidity in rats with
fatty livers.
Group MDA (nmol/mg protein) SOD (U/mg protein) GSH (nmol/mg protein) P η Control (N = 15) 0.42 ± 0.05* 11.21 ± 2.13* 6.01 ± 1.22* 0.188 ± 0.017* 1.397 ± 0.215* Model (N = 14) 1.24 ± 0.33 8.03 ± 1.42 3.65 ± 1.54 0.285 ± 0.012 3.277 ± 0.350 Rosiglitazone (N = 15) 0.97 ± 0.27* 8.96 ± 2.48* 5.02 ± 1.76* 0.272 ± 0.012* 2.924 ± 0.323* Silybin (N = 15) 0.93 ± 0.13* 9.31 ± 2.25*# 4.52 ± 1.09* 0.266 ± 0.011*# 2.765 ± 0.303*#
MDA = malondialdehyde; SOD = superoxide dismutase; GSH = glutathione; P = fluorescent polarization; η = microviscosity. See
legend to Table 2 for explanation of groups. *P< 0.05 vs the model group; #P< 0.05 vs the rosiglitazone group (Bonferroni multiple
comparisons test).
Table 4. Effect of rosiglitazone and silybin administration on mRNA expression of adiponectin and resistin by rats with fatty livers.
Group Adiponectin Resistin Control (N = 15) 666.12 ± 273.45* 0.0150 ± 0.0013* Model (N = 14) 215.95 ± 135.87 0.1179 ± 0.0076 Rosiglitazone (N = 15) 453.34 ± 261.79* 0.0221 ± 0.0061* Silybin (N = 15) 552.40 ± 268.13*# 0.0180 ± 0.00813*
The relative levels of the target mRNAs were normalized to the
corresponding levels of β-actin mRNA in the same cDNA sample.
See legend to Table 2 for explanation of groups. *P< 0.05 vs the model group; #P< 0.05 vs the rosiglitazone group (Bonferroni
observed a decline in hepatic adiponectin expression as well as an elevation in resistin expression in the model group, in agreement with previous studies. The changes in the expression of adiponectin and resistin were associated with insulin resistance and hepatic vulnerability.
Silymarin, extracted from the milk thistle, is a mixture of the three isomeric compounds silybin, silidianin, and silichristin (33,34). Some randomized controlled trials have shown beneficial effects of silymarin such as antioxidant therapy and improved survival against a variety of liver ailments (35). Silybin, the main isomer, was shown to prevent liver fibrosis induced by CCl4 in rats (36). It has been demonstrated that silybin in combination with vitamin E and phospholipids proved to be effective when used as a complementary approach to chronic liver damage (37). In our study, we used non-complexed silybin as a pharma-ceutical intervention. We observed that hepatic enzymes, serum lipid levels and MDA decreased while GSH and SOD increased after silybin treatment, and mitochondrial mem-brane fluidity was restored in comparison to the model group. Histopathological analysis revealed that macrovesicular and microvesicular steatosis and ballooning degeneration were significantly decreased after treatment with silybin, indicating that silybin helps regenerate the hepatocytes by improving mitochondrial membrane fluidity and inhibiting the oxidative process. In addition, serum levels of HOMA-IR decreased after treatment with silybin compared to the model group. Moreover, silybin up-regulated the expression of
adiponec-tin, which reduces inflammation, and down-regulated the expression of resistin both at the gene and protein levels, indicating that silybin could effectively enhance hepatic sen-sitivity to insulin. Insulin-sensitizing effects may be another important mechanism of silybin in NAFLD.
Acting as the high-affinity agonist of peroxisome prolifer -ator-activated receptor gamma (PPARγ), rosiglitazone can significantly enhance the tissue sensitivity to insulin (38,39). Our results showed that rosiglitazone could effectively de -crease serum HOMA-IR levels, up-regulate adiponectin ex -pression and down-regulate resistin ex-pression. However, its mitochondrial membrane stabilizing and antioxidative effects are not as significant as those of silybin.
In conclusion, we observed insulin resistance and mitochondrial dysfunction induced by a high-fat diet for 6 weeks in the liver of rats. Silybin, superior to rosiglitazone, could effectively improve hepatic function and prevent the progression to NASH. Mitochondrial membrane stabiliza -tion, oxidative stress inhibition as well as insulin resistance improvement may be the main mechanisms underlying the hepatoprotective effect of silybin in NAFLD.
Acknowledgments
Research supported by a grant from the National Natural Science Foundation of China (#30600845) and a grant from the federal office of public health of Guangdong Province of China (#B2006135).
References
1. de la Monte SM, Longato L, Tong M, Wands JR. Insulin resistance and neurodegeneration: roles of obesity, type 2 diabetes mellitus and non-alcoholic steatohepatitis. Curr Opin Investig Drugs 2009; 10: 1049-1060.
2. Macias-Rodriguez RU, Torre A. [Pathophysiology of
non-alcoholic steatohepatitis. An insulin resistance overview].
Rev Invest Clin 2009; 61: 161-172.
3. Amarapurkar DN, Hashimoto E, Lesmana LA, Sollano JD, Chen PJ, Goh KL. How common is non-alcoholic fatty liver disease in the Asia-Pacific region and are there local differ -ences? J Gastroenterol Hepatol 2007; 22: 788-793.
4. de Silva HJ, Dassanayake AS. Non-alcoholic fatty liver
disease: confronting the global epidemic requires better awareness. J Gastroenterol Hepatol 2009; 24: 1705-1707.
5. Argo CK, Caldwell SH. Epidemiology and natural history of
non-alcoholic steatohepatitis. Clin Liver Dis 2009; 13: 511-531.
6. Ekstedt M, Franzen LE, Mathiesen UL, Thorelius L, Hol -mqvist M, Bodemar G, et al. Long-term follow-up of patients with NAFLD and elevated liver enzymes. Hepatology 2006; 44: 865-873.
7. Bugianesi E, McCullough AJ, Marchesini G. Insulin resis-tance: a metabolic pathway to chronic liver disease. Hepatol-ogy 2005; 42: 987-1000.
8. Aller R, Castrillon JL, de Luis DA, Conde R, Izaola O, Sa -grado MG, et al. Relation of osteocalcin with insulin
resis-tance and histopathological changes of non alcoholic fatty liver disease. Ann Hepatol 2011; 10: 50-55.
9. Marchesini G, Brizi M, Bianchi G, Tomassetti S, Bugianesi E, Lenzi M, et al. Nonalcoholic fatty liver disease: a feature of the metabolic syndrome. Diabetes 2001; 50: 1844-1850. 10. Sanyal AJ, Campbell-Sargent C, Mirshahi F, Rizzo WB,
Contos MJ, Sterling RK, et al. Nonalcoholic steatohepatitis: association of insulin resistance and mitochondrial abnor-malities. Gastroenterology 2001; 120: 1183-1192.
11. Salman TA, Allam N, Azab GI, Shaarawy AA, Hassouna MM, El-Haddad OM. Study of adiponectin in chronic liver disease
and cholestasis. Hepatol Int 2010; 4: 767-774.
12. Perez-Carreras M, Del Hoyo P, Martin MA, Rubio JC, Martin
A, Castellano G, et al. Defective hepatic mitochondrial re-spiratory chain in patients with nonalcoholic steatohepatitis.
Hepatology 2003; 38: 999-1007.
13. Begriche K, Igoudjil A, Pessayre D, Fromenty B.
Mitochon-drial dysfunction in NASH: causes, consequences and pos -sible means to prevent it. Mitochondrion 2006; 6: 1-28. 14. Serviddio G, Sastre J, Bellanti F, Vina J, Vendemiale G,
Altomare E. Mitochondrial involvement in non-alcoholic steatohepatitis. Mol Aspects Med 2008; 29: 22-35. 15. Chen Qi. Chinese traditional medicine pharmacological
research methodology. Guangzhou: People’s Medical Pub-lishing Company; 2006.
Effect of silybin on NAFLD rats 659
Gentiana manshurica Kitagawa reverses acute alcohol-induced liver steatosis through blocking sterol regulatory element-binding protein-1 maturation. J Agric Food Chem
2010; 58: 13013-13019.
17. Bonora E, Targher G, Alberiche M, Bonadonna RC, Saggiani
F, Zenere MB, et al. Homeostasis model assessment closely
mirrors the glucose clamp technique in the assessment of insulin sensitivity: studies in subjects with various degrees of glucose tolerance and insulin sensitivity. Diabetes Care
2000; 23: 57-63.
18. Kleiner DE, Brunt EM, Van Natta M, Behling C, Contos MJ,
Cummings OW, et al. Design and validation of a histological
scoring system for nonalcoholic fatty liver disease. Hepatol-ogy 2005; 41: 1313-1321.
19. Serviddio G, Bellanti F, Romano AD, Tamborra R, Rollo T, Altomare E, et al. Bioenergetics in aging: mitochondrial proton leak in aging rat liver, kidney and heart. Redox Rep
2007; 12: 91-95.
20. Mantena SK, King AL, Andringa KK, Eccleston HB, Bailey
SM. Mitochondrial dysfunction and oxidative stress in the pathogenesis of alcohol- and obesity-induced fatty liver diseases. Free Radic Biol Med 2008; 44: 1259-1272.
21. Mantena SK, Vaughn DP, Andringa KK, Eccleston HB, King AL, Abrams GA, et al. High fat diet induces dysregulation of
hepatic oxygen gradients and mitochondrial function in vivo.
Biochem J 2009; 417: 183-193.
22. Pessayre D. Role of mitochondria in non-alcoholic fatty liver disease. J Gastroenterol Hepatol 2007; 22 (Suppl 1): S20-S27.
23. Rector RS, Thyfault JP, Uptergrove GM, Morris EM, Naples SP, Borengasser SJ, et al. Mitochondrial dysfunction pre-cedes insulin resistance and hepatic steatosis and contrib-utes to the natural history of non-alcoholic fatty liver disease in an obese rodent model. J Hepatol 2010; 52: 727-736. 24. Mollica MP, Lionetti L, Moreno M, Lombardi A, De Lange
P, Antonelli A, et al. 3,5-diiodo-l-thyronine, by modulating mitochondrial functions, reverses hepatic fat accumulation in rats fed a high-fat diet. J Hepatol 2009; 51: 363-370.
25. Lyles BE, Akinyeke TO, Moss PE, Stewart LV. Thiazolidin -ediones regulate expression of cell cycle proteins in human prostate cancer cells via PPARgamma-dependent and PPARgamma-independent pathways. Cell Cycle 2009; 8: 268-277.
26. Ackerman Z, Oron-Herman M, Pappo O, Peleg E, Safadi R, Schmilovitz-Weiss H, et al. Hepatic effects of rosiglitazone
in rats with the metabolic syndrome. Basic Clin Pharmacol Toxicol 2010; 107: 663-668.
27. Anania FA. Adiponectin and alcoholic fatty liver: Is it, after
all, about what you eat? Hepatology 2005; 42: 530-532. 28. You M, Considine RV, Leone TC, Kelly DP, Crabb DW. Role
of adiponectin in the protective action of dietary saturated fat against alcoholic fatty liver in mice. Hepatology 2005; 42: 568-577.
29. Kamada Y, Matsumoto H, Tamura S, Fukushima J, Kiso S, Fukui K, et al. Hypoadiponectinemia accelerates hepatic
tumor formation in a nonalcoholic steatohepatitis mouse model. J Hepatol 2007; 47: 556-564.
30. Hillenbrand A, Knippschild U, Weiss M, Schrezenmeier H, Henne-Bruns D, Huber-Lang M, et al. Sepsis induced
changes of adipokines and cytokines - septic patients com-pared to morbidly obese patients. BMC Surg 2010; 10: 26. 31. Silswal N, Singh AK, Aruna B, Mukhopadhyay S, Ghosh S,
Ehtesham NZ. Human resistin stimulates the pro-inflam -matory cytokines TNF-alpha and IL-12 in macrophages by NF-kappaB-dependent pathway. Biochem Biophys Res Commun 2005; 334: 1092-1101.
32. Briancon N, McNay DE, Maratos-Flier E, Flier JS. Combined neural inactivation of suppressor of cytokine signaling-3 and protein-tyrosine phosphatase-1B reveals additive,
synergis-tic, and factor-specific roles in the regulation of body energy
balance. Diabetes 2010; 59: 3074-3084.
33. Feher J, Lengyel G. [Silymarin in the treatment of chronic
liver diseases: past and future]. Orv Hetil 2008; 149: 2413-2418.
34. Crocenzi FA, Roma MG. Silymarin as a new hepatoprotec-tive agent in experimental cholestasis: new possibilities for an ancient medication. Curr Med Chem 2006; 13: 1055-1074.
35. Polyak SJ, Morishima C, Lohmann V, Pal S, Lee DY, Liu Y,
et al. Identification of hepatoprotective flavonolignans from
silymarin. Proc Natl Acad Sci U S A 2010; 107: 5995-5999. 36. Patel N, Joseph C, Corcoran GB, Ray SD. Silymarin modu-lates doxorubicin-induced oxidative stress, Bcl-xL and p53 expression while preventing apoptotic and necrotic cell death in the liver. Toxicol Appl Pharmacol 2010; 245: 143-152.
37. Loguercio C, Federico A, Trappoliere M, Tuccillo C, de Sio I, Di Leva A, et al. The effect of a silybin-vitamin e-phospholipid complex on nonalcoholic fatty liver disease: a pilot study. Dig Dis Sci 2007; 52: 2387-2395.
38. Yki-Jarvinen H. Thiazolidinediones and the liver in humans. Curr Opin Lipidol 2009; 20: 477-483.
39. Harrison SA. Thiazolidinedione therapy for nonalcoholic ste -atohepatitis: go, stop, or proceed with caution? Hepatology