SPATIAL AND TEMPORAL DISTRIBUTION OF LARVAE
AND JUVENILES OF
Hoplias
aff
. malabaricus
(CHARACIFORMES, ERYTHRINIDAE) IN THE UPPER
PARANÁ RIVER FLOODPLAIN, BRAZIL
BIALETZKI, A.,1,2 NAKATANI, K.,1,2 SANCHES, P. V.1,3 and BAUMGARTNER, G.1,4
1Universidade Estadual de Maringá, Departamento de Biologia, Pós-graduação em Ecologia de Ambientes
Aquáticos Continentais, Av. Colombo, 5790, Bloco G-90, CEP 87020-900, Maringá, PR, Brazil
2Núcleo de Pesquisas em Limnologia, Ictiologia e Aqüicultura – Nupélia 3Universidade Paranaense, Av. Parigot de Souza, 3636, Toledo, PR, Brazil
4Universidade Estadual do Oeste do Paraná, Centro de Engenharias e Ciências Exatas, Rua da Faculdade, 2550,
CEP 87030-900, Toledo, PR, Brazil
Correspondence to: Andréa Bialetzki, Universidade Estadual de Maringá, Núcleo de Pesquisas em Limnologia, Ictiologia e Aqüicultura, Av. Colombo, 5790, Bloco G-90, CEP 87020-900, Maringá, PR, Brazil,
e-mail: [email protected]
Received September 14, 2000 – Accepted July 12, 2001 – Distributed May 31, 2002 (With 9 figures)
ABSTRACT
Spatial and temporal distribution of larvae and juveniles of trahira, Hoplias aff. malabaricus
(Erythrinidae), and their relationship with environmental parameters in the Upper Paraná River floodplain were analyzed. Sampling of larvae and juveniles of H. aff. malabaricus has been conducted during
the period from November 1991 through February 1995, with 42 sampling stations distributed in four sub-areas: Ivinhema I, Ivinhema II, Baía, and Paraná. During the same period, data were obtained for water temperature, dissolved oxygen, pH, electrical conductivity, river level, precipitation index, and photoperiod. The largest catches of larvae were in the Ivinhema I sub-area (47.06%), and of juve-niles in the Paraná sub-area (54.55%). Larvae and juvejuve-niles were caught from October to February. Larvae were mainly collected at night and in all types of environments sampled (lotic, semi-lotic, and lentic). Principal Component Analysis of the environmental parameters and larval density showed that the largest catches were obtained in dry season months, with low values for temperature, electrical conductivity, river level, and photoperiod, and with high concentrations of dissolved oxygen and pH. This reproductive strategy may minimizes predation and maximizes food utilization, as it enables the fish to reach advanced developmental stages, while most other species are spawning.
Key words: Upper Paraná River, Hoplias aff. malabaricus, larvae, juveniles, floodplain.
RESUMO
Distribuição espaço-temporal de larvas e juvenis de Hoplias aff. malabaricus
(Characiformes, Erythrinidae) na planície de inundação do alto rio Paraná, Brasil
Analisou-se a distribuição espaço-temporal de larvas e juvenis de Hoplias aff. malabaricus (Erythrinidae)
na subárea Ivinhema I (47,06%) e, de juvenis, na subárea Paraná (54,55%). As larvas foram encontradas entre outubro e fevereiro em todas as subáreas, já os juvenis foram encontrados até abril. As larvas foram capturadas principalmente durante o período noturno em todos os tipos de ambientes amostrados (lótico, semilótico e lêntico). A Análise de Componentes Principais, aplicada entre as variáveis ambien-tais e a densidade de larvas, revelou que as maiores capturas são obtidas em meses em que predominam baixos valores de temperatura, condutividade elétrica, nível fluviométrico e fotoperíodo e elevadas concentrações de oxigênio dissolvido e de pH, ou seja, em meses de seca. Esta estratégia reprodutiva minimiza a predação e maximiza o aproveitamento alimentar, uma vez que lhe permite alcançar estágios avançados enquanto a maioria das espécies está desovando.
Palavras-chave: alto rio Paraná, Hoplias aff. malabaricus, larvas, juvenis, planície de inundação.
INTRODUCTION
Floodplains are heterogeneous environments with particular characteristics. The formation of lakes, intermittently flooded areas, and channels enrich the habitat, which offers a wide availability of food, and refuges where many organisms find suitable conditions for development. Fishes inhabi-ting these environments show great diversity of reproductive strategies, as a result mainly of the rapid fluctuations in water level and the often extreme physical and chemical conditions imposed by this flood regime. The wide diversity of habitats allows the many species of fishes to utilize them in different ways, such as natural nurseries and habitats for adults, during their life cycles (Wel-comme, 1979).
Hoplias aff. malabaricus (Bloch), the trahira
(traíra in Portuguese), is one of the most widely distributed freshwater fish, occurring in almost all hydrographic basins of South America, except west of the Andes and rivers in the Patagonia (Fowler, 1950). This species can be found in a wide diversity of aquatic environments, including lakes, ponds, impoundments, reservoirs, and even in streams and occasionally larger watercourses with strong current flow (Azevedo & Gomes, 1942).
This species is sedentary, and develops its entire life cycle within a relatively small geographic area. According to Winemiller (1989), H. malabaricus has an equilibrium reproductive
stra-tegy, with well-developed parental care (by the ma-les); a prolonged reproductive period; multiple spawning; size classes uniformly distributed throu-ghout the year; a long period of reproduction; large ovocytes and body size; and small population fluc-tuations during the year. The eggs are adhesive and placed in nests prepared on the bottom of
shallow, low-flow watercourses (Godoy, 1975; Vazzoler et al., 1997).
There is no published information at present on the initial development of H. aff. malabaricus
in the Upper Paraná River floodplain. The objective of the present investigation is to analyze the spatial and temporal distribution of larvae and juveniles and their relationship with environmental para-meters, and to determine preferential habitats for reproduction and initial development.
MATERIAL AND METHODS
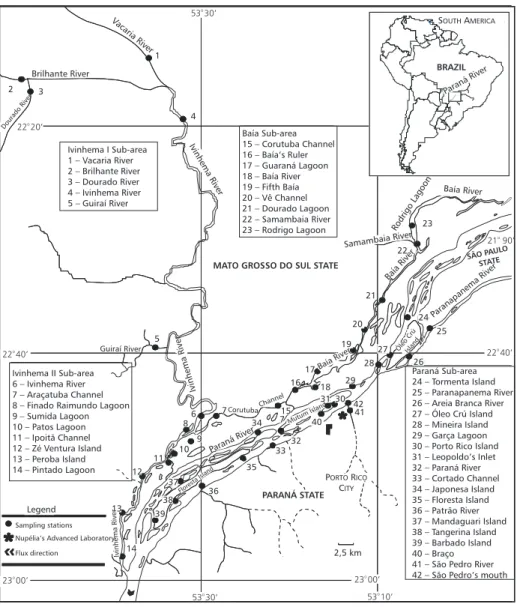
In the sampling area, 42 sampling sites were established, distributed in four sub-areas: Ivinhema I, Ivinhema II, Baía, and Paraná (Fig. 1).
Collections were made from November 1991 through February 1995. These were divided into four phases:
Phase 1 was November 1991 through January 1992, with sampling conducted in the Ivinhema I sub-area (stations 1 to 5). In this phase, as in the others, we used conical-cylindrical plankton nets, of 0.5 mm mesh, equipped with a flowmeter. The nets were attached to a cable stretched perpen-dicularly to the river current, and set out in it for 30 minutes, at the surface and bottom of the river. Collections were carried out in 24-hour cycles, with 3-hour intervals between samples.
stations 6, 10, 17, 18, 32, and 33 collections were made in the vegetation along the bank using a large screen, 1.5 m long by 1.0 m wide, with 0.5 mm mesh; the screen was cast three times at each station. Phase 3 was March 1993 through February 1994, with sampling done at the Ivinhema II (sta-tions 6 to 14), Baía (15 to 23), and Paraná (24 to 39, 41, and 42) sub-areas. The plankton nets were cast and held against the current for 10 minutes, with the boat moving slowly. Samples were taken only at the surface, and only a one-night collection was made at each station. At stations 6, 10, 18, 33, and 42, collections were made in the vegetation
along the bank, using a large screen with three casts of the screen at each station.
Phase 4 was September 1994 through Fe-bruary 1995, with sampling done in the Ivinhema I sub-area (stations 1 to 4). The plankton nets were attached to a cable stretched perpendicularly to the river. The nets were held in the current for 30 minutes, at the surface and bottom of the river. The collections were made in 24-hour cycles, with 3-hour intervals between samples. At all the sta-tions, collections were made in the bank vege-tation, using a large screen cast three times at each station.
Fig. 1 — Map of the region indicating the sampling sites.
BRAZIL
Paraná River
SOUTHAMERICA
Ivinhema I Sub-area 1 – Vacaria River 2 – Brilhante River 3 – Dourado River 4 – Ivinhema River 5 – Guiraí River
Baía Sub-area 15 – Corutuba Channel 16 – Baía’s Ruler 17 – Guaraná Lagoon 18 – Baía River 19 – Fifth Baía 20 – Vê Channel 21 – Dourado Lagoon 22 – Samambaia River 23 – Rodrigo Lagoon
Ivinhema II Sub-area 6 – Ivinhema River 7 – Araçatuba Channel 8 – Finado Raimundo Lagoon 9 – Sumida Lagoon 10 – Patos Lagoon 11 – Ipoitã Channel 12 – Zé Ventura Island 13 – Peroba Island 14 – Pintado Lagoon
22 40’
Legend
Sampling stations Nupélia’s Advanced Laboratory
Flux direction
Paraná Sub-area 24
Island 35 – Floresta Island 36 – Patrão River 37 – Mandaguari Island 38 – Tangerina Island 39 – Barbado Island 40 – Braço 41 – São Pedro River 42 – São Pedro’s mouth
– Tormenta Island 25 – Paranapanema River 26 – Areia Branca River 27 – Óleo Crú Island 28 – Mineira Island 29 – Garça Lagoon 30 – Porto Rico Island 31 – Leopoldo’s Inlet 32 – Paraná River 33 – Cortado Channel 34 – Japonesa
22 40’
25
24 Paranapanema
River SÃOPAULO
STATE 21 90’ Baía River SamambaiaRiver Rodrigo Lagoon 23 22 Baía River 21 20 19 27 28 26 Óleo Crú Island 17 16 18 29
31 30 42 41 40 BaíaRiver CorutubaChannel Paraná River 7 6 8 9 34 10 35 37 36 38 Floresta Island 11 12 Mutum Island 32 33 15 7 13 39 14 Ivinhema River 53 30’ 23 00’ 53 10’ 2,5 km 23 00’ PARANÁ STATE
PORTORICO
CITY
MATO GROSSO DO SUL STATE
Ivinhema
River
Ivinhema River Guiraí River 5
During the collections, water samples were taken for determination of environmental para-meters (temperature, pH, electrical conductivity, and dissolved oxygen). Concentrations of dissolved oxygen were determined by the Winkler method as modified by Golterman et al. (1978). The results
of these measurements are expressed as the monthly mean for each sub-area. Data for the precipitation index and river level were furnished by DNAEE (National Department of Water and Electric Energy) and Itaipu Binacional. Photoperiod data were obtai-ned from Vazzoler et al. (1997).
For analysis of spatial and temporal distri-bution, the samples of larvae and juveniles of H.
aff. malabaricus were standardized to a volume
of 10 m3 of filtered water, following Tanaka (1973), with modifications. For samples collected in the littoral aquatic vegetation, the number of larvae or juveniles per m2(Z) was obtained using the following formula: Z = X/A . L,where X = the number of larvae or juveniles collected, A = the area of the sieve (1.50 m2), and L = the number of throws in which larvae or juveniles occurred. The relative densities of fish per sampling station (D) for the pelagic zone (larvae or juveniles/ 10m3) and for the aquatic vegetation (larvae or juveniles/m2) were obtained by the following for-mula: D = C/B,where C = the total number of larvae or juveniles caught, and B = the number of stations where or throws in which larvae or juveniles occurred.
H. aff. malabaricus were separated into
deve-lopmental stages: preflexion, flexion, postflexion, and juvenile, according to the terminology pro-posed by Ahlstrom et al. (1976).
For analysis of diurnal variation, collection schedules were grouped into classes (excluding phase 2, when only night collections were made). For analysis of distribution of larvae by type of environment, the stations were separated according to current speed into lotic (with high velocity cur-rent) (stations 1 to 6, 11 to 13, 20 to 22, 24 to 30, and 32 to 42), semi-lotic (with low velocity current) (7, 15, 16, 18, 19, and 31), and lentic (with no directional current) (8 to 10, 14, 17, and 23).
Larval distribution (larvae/10 m3) during col-lection period was analyzed by ANOVA with re-peated measures (Von Ende, 1993). The model evaluated the influence on larvae distribution of the month (from January to December), time (6:00
to 17:00 h versus 18:00 to 5:00 h), and type of en-vironment (lotic, semi-lotic, and lentic), together with the interaction of these variables. To achieve normal distributions the data were previously square-root-transformed with addition of a constant (1). The association between environmental para-meters and larval densities was calculated by Prin-cipal Components Analysis (PCA), in order to verify the interdependence among variables (Manly, 1995). The data matrix was composed of 7 va-riables (water temperature, dissolved oxygen, pH, electrical conductivity, river level, precipitation index, and photoperiod), with 24 observations in sub-areas Ivinhema II, Baía, and Paraná, and 9 observations in sub-area Ivinhema I. The data for the means were pre-standardized, since they were derived from different measurement units. The PCA scores applied to the environmental parameters were used as explanatory variables for larval den-sities, which were transformed as log (x + 1).
RESULTS
Spatial distribution
During the study period, 323 larvae and 22 juvenile fish were caught in the plankton and large screen samples. The largest catch of larvae was in sub-area Ivinhema I, which contributed 47.06% of the catch, followed by the sub-areas Ivinhema II (29.10%), Baía (17.96%), and Paraná (5.88%). For juveniles, the highest percentage catch was in the Paraná sub-area with 54.55%, followed by sub-areas Ivinhema I (27.27%) and Baía (18.18%) (Fig. 2a, b).
In all habitats sampled, larvae and juvenile
H. aff malabaricus were found only at or near the
surface. Larvae caught in plankton and in littoral aquatic vegetation were in the preflexion and fle-xion stages. Juveniles were also found in both types of sites. Figures 3 and 4 show the results for spatial distribution of larvae and juveniles collected in the plankton and littoral aquatic vegetation.
Fig. 2 — Frequencies of larvae (a) and juveniles (b) of Hoplias aff. malabaricus by sub-area.
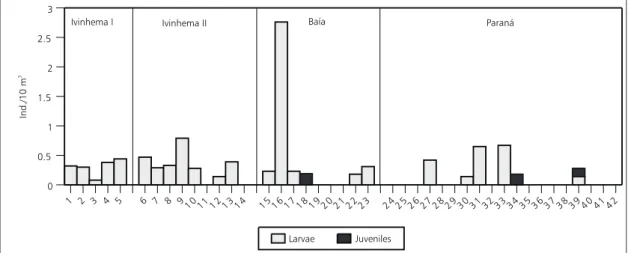
Fig. 3 — Spatial distribution of larvae and juveniles of Hoplias aff. malabaricus, collected in the plankton during study period.
Fig. 4 — Spatial distribution of larvae and juveniles of Hoplias aff. malabaricus, collected in the littoral aquatic vegeta-tion during study period.
1 2 3 4 5 6 7 8 910 11 12 13 14 15 16 17 18 19 20 21 22 23 24 25 26 27 28 29 30 31 32 33 34 35 36 37 38 39 40 41 42 0
0.5 1 1.5 2 2.5 3
Larvae Juveniles
Baía
Ivinhema I Ivinhema II Paraná
Ind./10
m
3
1 2 3 4 6 10 17 18 32 33 42
0 2 4 6 8
Larvae Juveniles Baía
Ivinhema I Ivinhema II Paraná
Ind./m
For sub-area Ivinhema II, fish were caught at seven of nine stations sampled. The highest density was recorded at station 9, with 0.79 larvae/ 10 m3 (Fig. 3). No individual of this species was found in the material from the littoral aquatic ve-getation.
In sub-area Baía, this species was caught at six of nine stations sampled. The highest density, 2.76 larvae/10 m3, was found at station 16. Only juveniles were caught at station 18 (0.19 juveniles/ 10 m3) (Fig. 3). In the littoral aquatic vegetation at station 18, larvae (0.67 larvae/m2) as well as juveniles (1.00 juveniles/m2) were found (Fig. 4). In the Paraná sub-area, the species was caught only at stations 27, 30, 31, 33, 34, and 39, with the largest catch at station 33 (0.67 larvae/10 m3). Juveniles were caught at stations 34 and 39 (0.18 and 0.14 juveniles/10 m3, respectively) (Fig. 3). In the littoral aquatic vegetation, we caught ju-veniles only at stations 33 and 42 (both with 1.33 juveniles/m2) (Fig. 4).
Temporal distribution
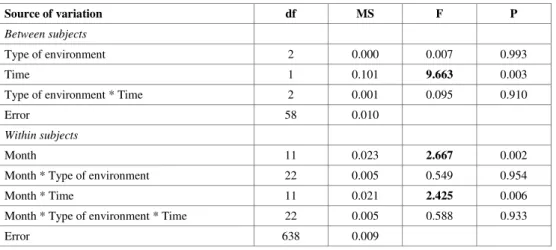
The results of the analysis of variance with repeated measurements (Table 1) showed that the larvae density differed considerably from month to month (df = 11; F = 2.67; p < 0.05) and among collection periods (df = 1; F = 9.66; p < 0.05). In general, the highest catches were observed from
October through February, and at night. The sig-nificant interaction between month and collection period (df = 11; F = 2.43; p < 0.05) indicates that the pattern of catch depends on both (Figs. 5 and 6).
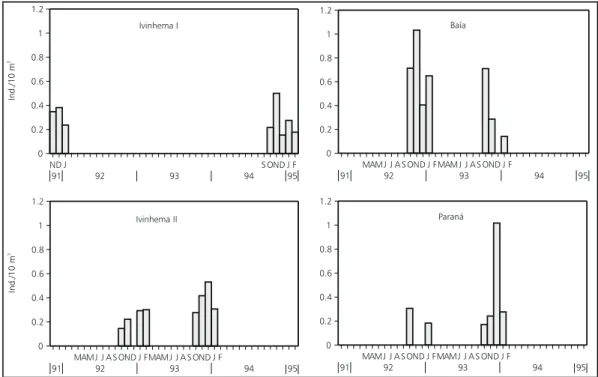
Figure 5 shows the temporal variation of larval H. aff. malabaricus in each sub-area.
Be-cause of the small number of juveniles (only 3) caught in the plankton, they were not included in the graphs. The temporal variation of the collec-tions in the littoral aquatic vegetation is presented only in descriptive form.
In the Ivinhema I sub-area, highest densities were seen in December 1991, with 0.38 larvae/ 10 m3, and in November 1994, with 0.50 larvae/ 10 m3 (Fig. 5). In the littoral aquatic vegetation, most larvae occurred in September 1994 (3.33 larvae/m2), and most juveniles in October (1.33 juveniles/m2).
In the Ivinhema II sub-area, highest densities were seen in December 1993, with 0.53 larvae/ 10 m3, and November 1993, with 0.42 larvae/10 m3 (Fig. 5). For the Baía sub-area, December 1993 showed a high density in relation to the other phases, with 1.02 larvae/10 m3, followed by October 1992, with 0.31 larvae/10 m3 (Fig. 5).
In the littoral aquatic vegetation, larvae were caught in December 1993 (0.67 larvae/m2), and juveniles in November 1992 (1.33 juveniles/m2).
TABLE 1
Summary of the analysis of variance with repeated measurements evaluating the influence of the sources of variation: month; type of environment; period of catch (time); and the interactions among these sources of variation and the density of larvae of Hoplias aff. malabaricus. The values in bold are significant (p < 0.05).
Source of variation df MS F P
Between subjects
Type of environment 2 0.000 0.007 0.993
Time 1 0.101 9.663 0.003
Type of environment * Time 2 0.001 0.095 0.910
Error 58 0.010
Within subjects
Month 11 0.023 2.667 0.002
Month * Type of environment 22 0.005 0.549 0.954
Month * Time 11 0.021 2.425 0.006
Month * Type of environment * Time 22 0.005 0.588 0.933
Fig. 6— Diurnal distribution of larvae of Hoplias aff. malabaricus by time period.
Fig. 5 — Temporal distribution of larvae of Hoplias aff. malabaricus by sub-area. (Only the months in which collections were made in each sub-area are shown.)
In the Paraná sub-area, the highest densities were found in November 1992, with 1.03 larvae/ 10 m3, and October 1992 and 1993, both with 0.71 larvae/10 m3 (Fig. 5), while in the littoral aquatic vegetation there were only juveniles, with the largest catch in November 1992 (2.00 juveniles/m2).
Larvae were not taken in daylight samples (9:00-11:00 and 12:00-14:00 hours).
Most larvae were caught after midnight (0-2:00 hours, with 0.35 larvae/10 m3) and early eve-ning (18:00-20:00 hours, with 0.44 larvae/10 m3) (Fig. 6).
ND J FMAMJ J A S OND J FMAMJ J A S OND J FMAMJ J A S OND J F
91 92 93 94 95
0 0.2 0.4 0.6 0.8 1 1.2
Ivinhema I
ND J FMAMJ J A S OND J FMAMJ J A S OND J FMAMJ J A S OND J F
91 92 93 94 95
0 0.2 0.4 0.6 0.8 1 1.2
Ivinhema II
ND J FMAMJ J A S OND J FMAMJ J A S OND J FMAMJ J A S OND J F
91 92 93 94 95
0 0.2 0.4 0.6 0.8 1 1.2
Paraná
ND J FMAMJ J A S OND J FMAMJ J A S OND J FMAMJ J A S OND J F
91 92 93 94 95
0 0.2 0.4 0.6 0.8 1 1.2
Baía
Paraná
Ind./10
m
3
Ind./10
m
3
12-14 15-17 18-20 21-23 0-02 3-05 6-08 9-11
Hours 0
0.1 0.2 0.3 0.4 0.5
Ind./10
m
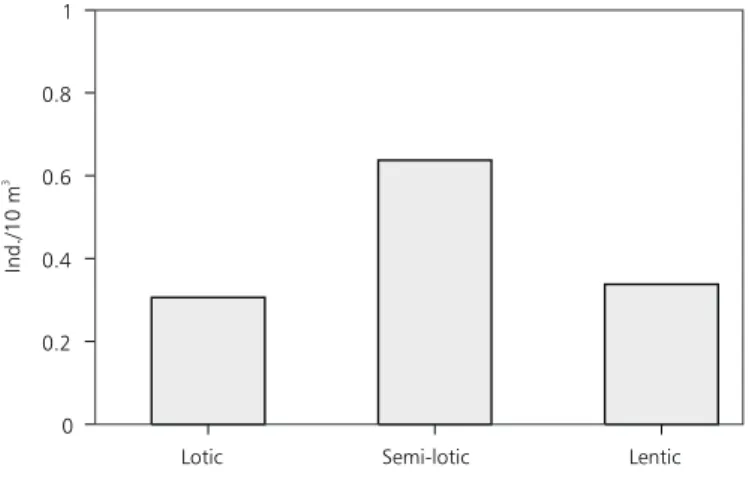
Analysis of catch by type of environment, although not differentiated statistically (Table 1), showed a predominance of larvae in semi-lotic
environments (0.64/10 m3), followed by lentic (0.38 larvae/10 m3) and lotic (0.30 larvae/10 m3) locations (Fig. 7).
Fig. 7 — Distribution of larvae of Hoplias aff. malabaricus according to current flow in the several environments.
Environmental parameters
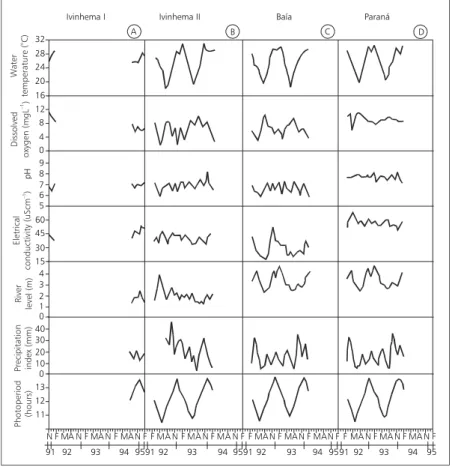
The results for environmental parameters in the four sub-areas during the study period are shown in Fig. 8. Temperature varied similarly in the various sub-areas. Dissolved oxygen and pH changed most in Ivinhema II and Baía sub-areas. Lowest values for electrical conductivity were found in sub-area Baía and the highest in sub-area Paraná, with inter-mediate values in sub-areas Ivinhema I e II.
Relationship between larval density and environmental parameters
Table 2 shows the results of the Principal Components Analysis and Pearson’s correlation between larval density and the environmental pa-rameters measured in the four sub-areas. Only two of the possible principal components in the Ivinhema I, Baía, and Paraná sub-areas, and the first three components in the Ivinhema II sub-area were used for interpretation, since only these had eigenvalues greater than 1.0 (Kaiser-Guttman’s criterion, see Jackson, 1993). PC1 and 2 together explained 81.91%, 71.68%, and 61.67% of the variability of abiotic data in sub-areas Ivinhema I, Baía, and Paraná respectively. For sub-area Ivinhema II, PC1, 2, and 3 explained 82.83% of the variability.
For sub-area Ivinhema I, PC1 was positively correlated with temperature, electrical conductivity,
river level, and photoperiod, and negatively corre-lated with dissolved oxygen and the precipitation index, all with structural coefficients above 0.5. PC2 was positively correlated only with dissolved oxygen, pH, and the precipitation index.
In sub-area Ivinhema II, PC1 was related positively to temperature, electrical conductivity, river level, and photoperiod, and negatively to dissolved oxygen. PC2 showed positive corre-lations only with temperature, pH, and photoperiod, and PC3 with the precipitation index.
PC1 at the Baía sub-area was positively corre-lated with temperature, electrical conductivity, river level, and photoperiod, and negatively only with dissolved oxygen. PC2 showed positive correla-tions with dissolved oxygen and pH.
For the Paraná sub-area, PC1 was positively correlated with temperature, river level, and photo-period, and negatively with dissolved oxygen. Electrical conductivity was negatively correlated with PC2.
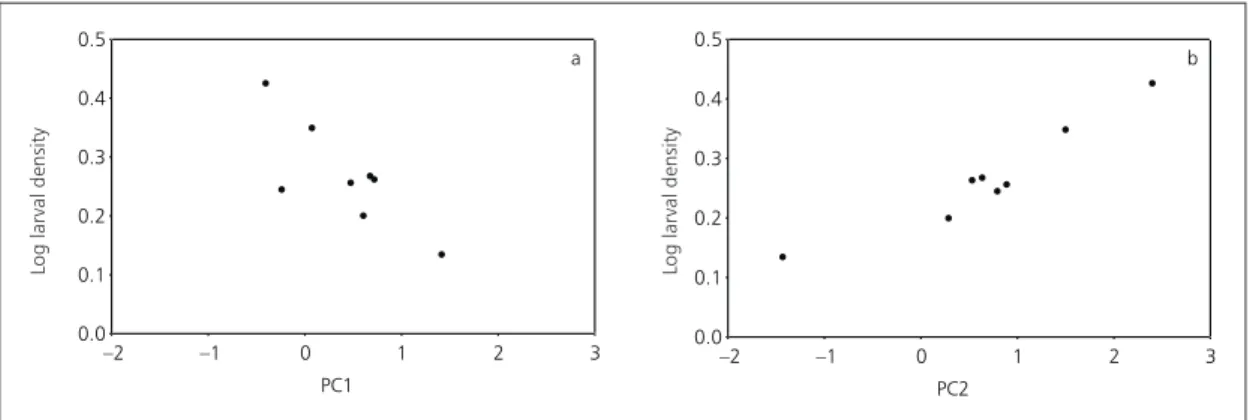
Pearson’s correlation between the scores of PC1, 2, and 3 and the log-transformed values for larval density was significant only for PC1 and 2 in sub-area Ivinhema II (Fig. 9).
For the remaining sub-areas, there were no significant correlations with any linear combi-nation.
Lotic Semi-lotic Lentic
0 0.2 0.4 0.6 0.8 1
Ind./10
m
Fig. 8 — Mean monthly values of water temperature, dissolved oxygen, pH, electrical conductivity, river level, precipitation
index, and photoperiod, measured in the Ivinhema I (A), Ivinhema II (B), Baía (C), and Paraná (D) sub-areas.
Ivinhema I Ivinhema II Baía Paraná
Parameters/Components
PC1 PC2 PC1 PC2 PC3 PC1 PC2 PC1 PC2
Water temperature 0.817 0.363 0.767 0.551 –0.146 0.936 0.184 0.927 0.070
Dissolved oxygen –0.659 0.735 –0.898 0.280 0.110 –0.742 0.606 –0.729 0.385
pH 0.109 0.948 –0.491 0.730 0.296 0.071 0.888 –0.088 0.404
Electrical conductivity 0.928 0.169 0.824 –0.079 –0.206 0.814 0.284 –0.363 –0.836
River level 0.924 0.308 0.508 –0.375 0.580 0.863 –0.164 0.771 –0.495
Precipitation index –0.557 0.652 0.288 0.052 0.839 0.286 –0.419 0.384 –0.011
Photoperiod 0.690 0.008 0.718 0.597 –0.015 0.709 0.345 0.772 0.432
Eigenvalues 3.615 2.119 3.172 1.422 1.204 3.425 1.593 2.870 1.447
% explanation 51.65 30.27 45.31 20.31 17.21 48.92 22.75 40.99 20.68
Correlation with log of
larval density 0.716 –0.193 –0.798 0.952 –0.105 –0.188 0.596 –0.527 –0.446
Probability ns ns 0.018 0.000 ns ns ns ns ns
TABLE 2
Results for Pearson’s correlations between the scores of the principal components and the log-transformed values for larval densities of Hoplias aff. malabaricus, in the four sub-areas.
(ns) not significant at level of significance selected (p < 0.05).
Ivinhema I Ivinhema II Baía Paraná
A B C D
N 91
pH
32 28 24 20 16 12 8 4 0 9 8 7 6 5 60 45 30 15 4 3 2 1 0 40 30 20 10 0 13 12 11
91 91 91
92 93 94 95 92 93 9495 92 93 94 95 92 93 94 95
F MA N F MA N FMA NFF MANFMA NFMA NFF MA N FMA NFMANFF MANFMANFMANF
W
ater
temperature
(
C)
Eletrical
River
level
(m)
Precipitation index
(mm)
Photoperiod
DISCUSSION
The role of lentic and semi-lotic environments as breeding habitats of small and medium-sized fishes is quite evident on the floodplain of the Upper Paraná River. Nevertheless, many of the species are also able to reproduce in the more lotic affluents of these environments (Vazzoler et al.,
1997).
H. aff. malabaricus, a sedentary fish, is widely
distributed in diverse habitats of the Paraná River. It occurs in low numbers or only sporadically at sites with high-velocity current and is abundant in permanent and temporary lakes. It reproduces in all these locations (Agostinho et al., 1997; Vazzoler et al., 1997). The higher densities at stations 5
(lotic), 9 (lentic), 16 (semi-lotic), and 33 (lotic) corroborate previous results.
Larvae found in lotic environments, mainly in the first stages of development (preflexion and flexion stages), probably came from the nests cons-tructed nearshore and among littoral aquatic vege-tation, mainly grasses and sedges, as observed by Machado-Allison (1990). At these early stages, the larvae have no developed organs of locomotion and, therefore, are caught more easily. Individuals in more advanced stages of development (postflexion or juvenile) tend to escape from sampling gears, as seen in our results, where the capture of some juveniles was possibly accidental.
In all the sub-areas except for Ivinhema II, larvae and/or juveniles were found associated with
banks of macrophytes. This species probably com-pletes its initial development in these banks, where it finds abundant food and shelter. The disruptive coloration patterns during early development blends in with a vegetation background (Machado-Allison, 1987, 1990). In studies in Amazonia, Araújo-Lima
et al. (1986) and Araújo-Lima (1994) found juvenile H.malabaricus in aquatic vegetation, suggesting
that when they are present in lotic environments, they spawn in the littoral zone.
The large catch of larvae in sub-area Ivinhema I corroborates results obtained by Vazzoler et al.
(1997), who found H. malabaricus in full breeding
condition in the Ivinhema River, mainly at stations 4 and 5. Although it is a predominantly lotic envi-ronment, this sub-area has many banks of macro-phytes, favoring the development of this species as discussed previously. Moreover, this area is also important for those floodplain species which mi-grate during their breeding period, and is therefore a nursery for many species (Nakatani et al., 1997).
The period of highest larval density (Sep-tember through February) found by us agrees with the results obtained by Vazzoler (1996) in the same environment. He established that between September and March the trahira has gonads in the repro-ductive state. According to Machado-Allison (1987),
H. malabaricus in the Venezuelan llanos begin to
mature sexually during the dry season. Maturation occurs before that of the migrating species, pro-bably because of its independence from environ-mental factors such as the rise in water level.
Fig. 9 — Relationship between log of larval density of Hoplias aff. malabaricus and principal components 1 (a) and 2 (b)
of the Ivinhema II sub-area.
PC2 0.0
0.1 0.2 0.3 0.4 0.5
–2 –1 0 1 2 3
b
PC1 0.0
0.1 0.2 0.3 0.4 0.5
–2 –1 0 1 2 3
Log
larval
density
Log
larval
density
H. aff. malabaricus has different food
re-quirements during the course of its ontogenetic development. In the larval phase it is exclusively planktophagous, becoming insectivorous in the juvenile phase and essentially piscivorous as an adult, feeding during the evening and night (Oliveros & Rossi, 1991; Hahn et al., 1997). The large
cat-ches at night may have been caused by feeding behaviour observed for the early stages. The large quantities of food provided by the vertical mi-gration of zooplankton lead to greater larvae mo-vement during the nocturnal period. Moreover, at night the larvae are protected from plankton-feeding visual predators (Baumgartner et al., 1997).
Vazzoler (1996) suggested that the factors that initiate and stimulate reproduction of fishes in floodplains still remained undetermined, although very many have been implicated, including changes in physical conditions as well as the array of con-ditions that marks the beginning of rising water. It is probable that each species is affected diffe-rently by multiple factors, and that the external initiating factors are only effective when imposed on the internal physiology of the fish. The Principal Components Analysis between the environmental parameters and larval density showed that the lar-gest catches were obtained in the dry months when low water temperature, electrical conductivity, river level, and photoperiod, and high pH and concen-trations of dissolved oxygen obtained. The non-significant correlations in the remaining sub-areas may be a result of insufficient observations.
The reproductive strategy to spawn before the high water period, allows the H. aff malabaricus
to reach more advanced developmental stages, while most other species are still spawning. In this way they can minimize predation and maximize use of available food, and consequently there should be better offspring survival.
Acknowledgments — We extend our thanks to the Núcleo de Pesquisas em Limnologia, Ictiologia e Aqüicultura (Nupélia) for logistical support; to PADCT/CIAMB for making the project possible; to CAPES for awarding a study grant; Dr. Luiz C. Gomes and Dr. Ricardo P. Ribeiro for the help given in statis-tical analyses; and to our friends Sebastião Rodrigues, Valmir Alves Teixeira, Francisco Alves Teixeira, Valdir Aparecido Capatti, and Alfredo Soares, for their assistance with fieldwork. Janet W. Reid translated the manuscript into English.
REFERENCES
AGOSTINHO, A. A., JÚLIO Jr., H. F., GOMES, L. C., BINI, L. M. & AGOSTINHO, C. S., 1997, Composição, abun-dância e distribuição espaço-temporal da ictiofauna. In:
A. E. A. M. Vazzoler, A. A. Agostinho & N. S. Hahn (eds.),
A planície de inundação do alto rio Paraná: aspectos fí-sicos, biológicos e socioeconômicos. EDUEM, Maringá, pp. 179-208.
AHLSTROM, E. H., BUTLER, J. L. & SUMIDA, B. Y., 1976, Pelagic stromateoid fish (Pisces, Perciformes) of the Eastern Pacific: kinds, distributions, and early life histories and observations on five of these from the Northwest Atlantic. Bulletin of Marine Science, 26(3): 285-402. ARAÚJO-LIMA, C. A. R. M., 1994, Egg size and larval
de-velopment in Central Amazonian fish. Journal of Fish Biology, 44: 371-389.
ARAÚJO-LIMA, C. A. R. M., PORTUGAL, L. P. S. & FERREIRA, E. G., 1986, Fish-macrophyte relationship in the Anavillhanas Archipelago, a black water system in the Central Amazon. Journal of Fish Biology, 29: 1-11.
AZEVEDO, P. & GOMES, A. L., 1942, Contribuição ao es-tudo da biologia da traíra Hoplias malabarica (Bloch,
1794). Boletim de Indústria Animal, 5(4): 15-64.
BAUMGARTNER, G., NAKATANI, K., CAVICCHIOLI, M. & BAUMGARTNER, M. S. T., 1997, Some aspects of the ecology of fishes larvae in the floodplain of the high Pa-raná river, Brazil.Revista Brasileira de Zoologia, 14(3): 551-563.
FOWLER, H. W., 1950, Os peixes de água doce do Brasil.
Arquivos de Zoologia do Estado de São Paulo, 6(2): 205-404.
GODOY, M. P., 1975, Peixes do Brasil – Subordem Characoidei. Bacia do rio Mogi Guassu. Editora Fran-ciscana, Piracicaba, 4o vol., pp. 400-440.
GOLTERMAN, H. L., CLYMO, R. S. & CHONOTAD, M. A. M., 1978, Methods for physical and chemical analysis of freshwater. Blackwell Scient. Publ. (IBP n.8), Oxford,
213p.
HAHN, N. S., ANDRIAN, I. F., FUGI, R. & ALMEIDA, V. L. L., 1997, Ecologia trófica. In: A. E. A. M. Vazzoler,
A. A. Agostinho & N. S. Hahn (eds.), A planície de inun-dação do alto rio Paraná: aspectos físicos, biológicos e socioeconômicos. EDUEM, Maringá, pp. 209-228. JACKSON, D. A., 1993, Stopping rules in principal
compo-nents analysis: a comparison of heuristical and statistical approaches. Ecology, 74(8): 2204-2214.
MACHADO-ALLISON, A., 1987, Los peces de los llanos de Venezuela: un ensayo sobre su historia natural.
Uni-versidade Central de Venezuela, Caracas, 144p. MACHADO-ALLISON, A., 1990, Ecologia de los peces de
las areas inundables de los llanos de Venezuela.
MANLY, B. F. J., 1995, Multivariate statistical methods: A primer. Chapman & Hall, London, XIII+215p.
NAKATANI, K., BAUMGARTNER, G. & CAVICCHIOLI, M., 1997, Ecologia de ovos e larvas de peixes. In: A. E. A. M. Vazzoler, A. A. Agostinho & N. S. Hahn (eds.), A planície de inundação do alto rio Paraná: aspectos fí-sicos, biológicos e socioeconômicos. EDUEM, Maringá, pp. 281-306.
OLIVEROS, O. B. & ROSSI, L. M., 1991, Ecología trófica de Hoplias malabaricus malabaricus (Pisces, Erythrini
dae). Revista de la Asociación de Ciencias Naturales del Litoral, 22(2): 55-68.
TANAKA, S., 1973, Stock assessment by means of ichtyo-plankton surveys. FAO-Fisheries Technical Paper, 122:
33-51.
VAZZOLER, A. E. A. M., 1996, Biologia da reprodução de peixes teleósteos: teoria e prática. EDUEM, Maringá, 169p.
VAZZOLER, A. E. M. M., SUZUKI, H. I., MARQUES, E. E. & LIZAMA, M. A. P., 1997, Primeira maturação go-nadal, períodos e áreas de reprodução. In: A. E. A. M. Vazzoler, A. A. Agostinho & N. S. Hahn (eds.), A planície de inundação do alto rio Paraná: aspectos físicos, bio-lógicos e socioeconômicos. EDUEM, Maringá, pp. 249-265.
VON ENDE, C., 1993, Repeated-measures analysis: growth and other time-dependent measures. In: S. M. Scheiner & J. Gurevitch (eds.), Design and Analysis of Ecological Experiments. Chapman & Hall, New York, pp. 113-137.
WELCOMME, R. L., 1979, Fisheries ecology of floodplain rivers. Longman, London, 317p.