ABSTRACT
Objective: To evaluate the impact that the distribution of emphysema has on clinical and functional severity in patients with COPD. Methods: The distribution of the emphysema was analyzed in COPD patients, who were classiied according to a 5-point visual classiication system of lung CT indings. We assessed the inluence of emphysema distribution type on the clinical and functional presentation of COPD. We also evaluated hypoxemia after the six-minute walk test (6MWT) and determined the six-minute walk distance (6MWD). Results: Eighty-six patients were included. The mean age was 65.2 ± 12.2 years, 91.9% were male, and all but one were smokers (mean smoking history, 62.7 ± 38.4 pack-years). The emphysema distribution was categorized as obviously upper lung-predominant (type 1), in 36.0% of the patients; slightly upper lung-predominant (type 2), in 25.6%; homogeneous between the upper and lower lung (type 3), in 16.3%; and slightly lower lung-predominant (type 4), in 22.1%. Type 2 emphysema distribution was associated with lower FEV1, FVC, FEV1/FVC ratio, and DLCO. In comparison with the type 1 patients, the type 4 patients were more likely to have an FEV1 < 65% of the predicted value (OR = 6.91, 95% CI: 1.43-33.45; p = 0.016), a 6MWD < 350 m (OR = 6.36, 95% CI: 1.26-32.18; p = 0.025), and post-6MWT hypoxemia (OR = 32.66, 95% CI: 3.26-326.84; p = 0.003). The type 3 patients had a higher RV/TLC ratio, although the difference was not signiicant. Conclusions: The severity of COPD appears to be greater in type 4 patients, and type 3 patients tend to have greater hyperinlation. The distribution of emphysema could have a major impact on functional parameters and should be considered in the evaluation of COPD patients.
Keywords: Pulmonary disease, chronic obstructive; Pulmonary emphysema; Respiratory function tests; Tomography, X-ray computed.
Inluence of emphysema distribution on
pulmonary function parameters in COPD
patients
Helder Novais e Bastos1,2,3, Inês Neves1, Margarida Redondo1, Rui Cunha4,5, José Miguel Pereira4,5, Adriana Magalhães1, Gabriela Fernandes1,5
Correspondence to:
Helder Novais e Bastos. Serviço de Pneumologia, Centro Hospitalar de São João EPE, Alameda Prof. Hernâni Monteiro, 4200-319, Porto, Portugal. Tel.: 351 225 512 100. Mobile: 351 962 250 784. Fax: 351 225 025 766. E-mail: [email protected]
Financial support: None.
INTRODUCTION
The lung disease known as COPD is characterized by persistent airlow limitation that is usually progressive, consisting of a combination of small airways disease (obstructive bronchiolitis) and parenchymal destruction (emphysema).(1) There is increasing evidence to suggest that distinguishing different phenotypic proiles of patients with COPD has prognostic and therapeutic implications.(2-4) In fact, COPD patients with conirmed emphysema have more severe lung function impairment, more intense airway inlammation, and possibly more important extrapulmonary disability than do those without emphysema.(2,5,6) The lung hyperinlation caused by the loss of lung elastic recoil has been associated with limitations in the functional capacity of these patients. (7,8) In addition, the destruction of the alveolar-capillary membrane in emphysema is responsible for more profound hypoxemia.(9)
Advances in CT scanning and image processing software have allowed the precise measurement of the extent of low-attenuation areas corresponding to emphysema. In validation studies, the results obtained with these tech -niques have been found to correlate well with pathologic
and functional features.(10-13) This kind of assessment has been mainly used in order to evaluate patients for lung volume reduction procedures and to monitor replacement therapy in alpha-1 antitrypsin-deicient patients.(14-16) However, quantifying emphysema might have broader utility, given that some reports have shown that the heterogeneity of the distribution of parenchymal damage might be associated with different degrees of clinical severity.(13,17-19) Nevertheless, the results are contradictory, which might be attributable to the different methods that have been used in those analyses. The majority of authors have employed computer-assisted measurements, which are expensive and not widely available. In order to promote a deinitive widespread use of imaging data in the clinical evaluation of patients with emphysema, we believe that there is also a need to standardize qualitative methods.
The aim of the present study was to evaluate the impact that the distribution of emphysema has on clinical and functional features in COPD patients. In order to test our hypothesis, we used a visual classiication system to categorize patients according to the regional distribution of their emphysema.
1. Serviço de Pneumologia, Centro Hospitalar de São João EPE, Porto, Portugal.
2. Instituto de Investigação em Ciências da Vida e Saúde – ICVS –, Escola de Ciências da Saúde, Universidade do Minho, Braga, Portugal. 3. Laboratório Associado ICVS/3B’s,
Instituto de Investigação em Ciências da Vida e Saúde e Grupo de Investigação em Biomateriais, Biodegradáveis e Biomiméticos, Braga/ Guimarães, Portugal.
4. Serviço de Radiologia, Centro Hospitalar de São João EPE, Porto, Portugal. 5. Faculdade de Medicina, Universidade
do Porto, Porto, Portugal. Submitted: 14 June 2015. Accepted: 4 November 2015.
METHODS
Study subjects
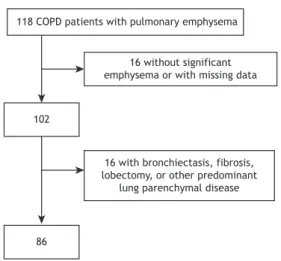
This was a cross-sectional observational study involving COPD patients with emphysema, recruited between August of 2011 and August of 2012 from the pulmonology outpatient clinic of the Centro Hospitalar de São João, a tertiary care medical center located in the city of Porto, Portugal. We included patients with pulmonary emphysema and any degree of airlow limitation who had been clinically stable in the 3 months prior to their inclusion in the study. The inclusion criteria were having a post-bronchodilator FEV1/FVC < 0.70 and showing evidence of emphysema on visual inspection of CT images, estimated to involve > 25% of the lung parenchyma.(20) Patients with a history of asthma, bronchiectasis, tuberculosis sequelae, lung ibrosis, thoracic surgery, or other confounding diseases were excluded (Figure 1). The study was approved by the local research ethics committee, and all patients gave written informed consent.
Clinical and pulmonary function assessment We recorded demographic and anthropometric data, namely age, gender, and BMI.(21) Patients also underwent clinical evaluation, which included the completion of the COPD Assessment Test (CAT) and the modiied Medical Research Council (mMRC) scale (for the determination of dyspnea severity),(22) as well as the evaluation of smoking status (current smoker, former smoker, or nonsmoker), smoking history (in pack-years), the presence of signiicant comorbidities, and current medication use. The number of COPD exacerbations in the last year(23,24) was retrospectively obtained by patient recall, and, in most cases, hospital records were used in order to corroborate the information. Each patient was submitted to spirometry (MasterScreen™ Body; Jaeger, Ẅrzburg, Germany), lung volumes and DLCO also being determined, in accordance with international guidelines.(25,26) The six-minute walk test (6MWT) was performed using the methodology described by the
American Thoracic Society.(27) Arterial blood gases were measured (RapidLab™ 1265; Siemens, Munich, Germany) after a minimum 30-min rest period in a sitting position. We deined hypoxemia as a PaO2 < 60 mmHg at an FiO2 of 0.21.
CT evaluation
All patients underwent multidetector CT of the chest at suspended full inspiration, from the thoracic inlet to the adrenal glands, using a 64-detector row scanner (Somatom Sensation 64; Siemens Healthcare, Erlangen, Germany). The following imaging parameters were used: tube voltage, 120 kVp; tube current, 40 mAs; rotation time, 0.33 s; pitch, 1.3; detector collimation, 32 × 0.6 mm; and slice acquisition by means of a z-lying focal spot, 64 × 0.6 mm. No contrast media were used. From the raw data, 1 mm-thick sections were obtained using a soft tissue kernel reconstruction (B50f; Siemens Healthcare). For the subjects submitted to multiple CT scans, the one performed the closest to study enrollment was used.
Two thoracic radiologists independently reviewed the CT imaging studies. Both were blinded to the clinical information of the patients. Disagreement between the two radiologists was resolved by consensus. They reviewed CT images on the coronal and sagittal planes to assess the heterogeneity of emphysematous changes in an apical-to-caudal direction. For image interpretation, we used a window level of −700 to −900 HU and a window width of 600-1,600 HU.(28) A ive-point visual classiication system was applied, as previously described.(18) This qualitative evaluation ranks pulmonary emphysema according to its predominant distribution, as follows: type 1, obviously predominant in the upper lung; type 2, somewhat predominant in the upper lung; type 3, equal extent in the upper and lower lung (homogeneous distribution); type 4, somewhat predominant in the lower lung; and type 5, obviously predominant in the lower lung.
Statistical analysis
Variables with normal distribution are expressed as means and standard deviations, whereas those with non-normal distribution are expressed as median and interquartile range (25th to 75th percentile) and categorical variables are expressed as absolute values and proportion. The Student’s t-test for independent samples was used in order to compare variables with normal distribution, and the Mann-Whitney U rank test was used in order to compare variables with non-normal distribution. The Pearson’s chi-square test was used for categorical variables. One-way ANOVA was used in order to compare the emphysema distribution groups, together with Tukey’s post hoc test to identify signiicant differences. Odds ratios and the corresponding 95% conidence intervals were calculated using binary logistic regression. Odds ratios were adjusted for age and BMI. Statistical signiicance was set at p < 0.05 (two-tailed), and all statistical analyses were performed with the SPSS Statistics software package, version 19.0 (IBM Corporation, Armonk, NY, USA).
118 COPD patients with pulmonary emphysema
16 without significant emphysema or with missing data
102
86
16 with bronchiectasis, fibrosis, lobectomy, or other predominant
lung parenchymal disease
RESULTS
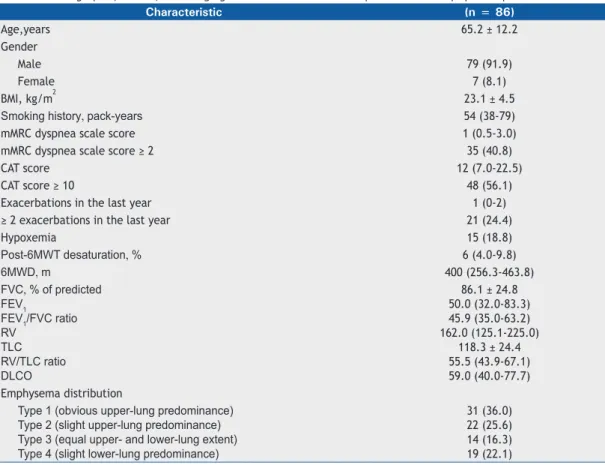
During the study period, 86 COPD patients with pulmonary emphysema were selected, the character -istics of whom are shown in Table 1. Male gender was predominant in this population, all but one of the patients were current or former smokers, and 1 patient presented with homozygous PiZZ alpha-1 antitrypsin deiciency. The CAT scores indicated severe symptoms more often than did the mMRC dyspnea scale scores: 56.1% of the patients had CAT scores ≥ 10, whereas only 40.8% had mMRC scale scores ≥ 2. Only 24.4% of the patients had frequent exacerbations (≥ 2 exacerbations in the last year). Hypoxemia was present in 15 patients (18.8%). The characteristics of the patients demonstrated a wide range of airlow limitation, with an even distribution across the Global Initiative for Chronic Obstructive Lung Disease severity classiication,(1) which is based on FEV1—mild, in 27.9%; moderate, in 22.1%; severe, in 29.1%; and very severe, in 20.9%—relecting the spectrum of the disease encountered in clinical practice. However, there was a clear tendency for hyperinlation to be seen in this group of patients, with a median residual volume/total lung capacity (RV/TLC) ratio of 55.5% and a signiicant median oxygen desaturation during the 6MWT of 6%.
In most (36.0%) of the patients, the emphysema was obviously predominant in the upper lung (type 1
distribution). The next most common distributions were types 2 and 4 (somewhat predominant in the upper lung and somewhat predominant in the lower lung, seen in 25.6% and 22.1% of the patients, respectively). Type 3 emphysema distribution (homogeneous distribution between the upper and lower lung) was the least common, seen in only 16.3%. None of the patients in our sample were classiied as presenting with type 5 emphysema distribution (obviously predominant in the lower lung). The interobserver correlation for emphysema classiication scores was good (rs = 0.621, p < 0.001).
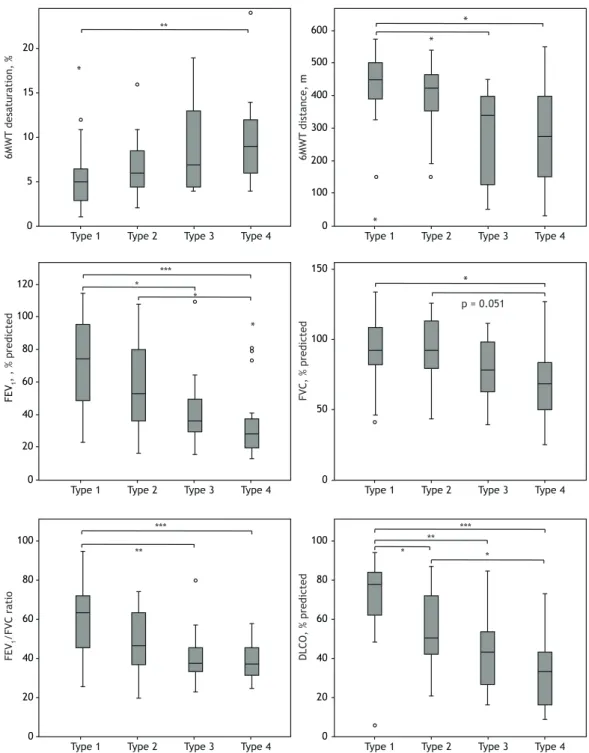
Figure 2 shows the differences found in the clinical parameters according to CT scan classiication of emphysema distribution. The six-minute walk distance (6MWD), post-6MWT oxygen desaturation, FVC, FEV1, and FEV1/FVC ratio (in % of the predicted values), as well as DLCO, were found to differ signiicantly among the groups. Tukey’s post hoc test revealed that there were signiicant differences in all of the abovementioned variables between the patients classiied as type 1 than those classiied as type 4. In fact, all of those variables appear to get worse in upper-to-lower predominance direction. Patients classiied as type 3 showed the highest RV/TLC ratio, although it did not reach statistical signiicance (p = 0.064).
The logistic regression analysis for different dimensions of the functional status revealed that type 4 patients had a signiicantly higher risk for having
Table 1. Demographic, clinical, and imaging characteristics of selected patients with emphysema-predominant COPD.a
Characteristic (n = 86)
Age,years 65.2 ± 12.2
Gender
Male 79 (91.9)
Female 7 (8.1)
BMI, kg/m2 23.1 ± 4.5
Smoking history, pack-years 54 (38-79)
mMRC dyspnea scale score 1 (0.5-3.0)
mMRC dyspnea scale score ≥ 2 35 (40.8)
CAT score 12 (7.0-22.5)
CAT score ≥ 10 48 (56.1)
Exacerbations in the last year 1 (0-2)
≥ 2 exacerbations in the last year 21 (24.4)
Hypoxemia 15 (18.8)
Post-6MWT desaturation, % 6 (4.0-9.8)
6MWD, m 400 (256.3-463.8)
FVC, % of predicted FEV1
FEV1/FVC ratio RV
TLC RV/TLC ratio DLCO
86.1 ± 24.8 50.0 (32.0-83.3) 45.9 (35.0-63.2) 162.0 (125.1-225.0)
118.3 ± 24.4 55.5 (43.9-67.1) 59.0 (40.0-77.7) Emphysema distribution
Type 1 (obvious upper-lung predominance) Type 2 (slight upper-lung predominance) Type 3 (equal upper- and lower-lung extent) Type 4 (slight lower-lung predominance)
31 (36.0) 22 (25.6) 14 (16.3) 19 (22.1)
FEV1 < 65% of the predicted value (adjusted OR = 6.92; 95% CI: 1.43-33.45; p = 0.016), 6MWD < 350 m (adjusted OR = 6.36; 95% CI: 1.26-32.18; p = 0.025), and hypoxemia (adjusted OR = 32.66; 95% CI: 3.26-326.84; p = 0.003; Table 2). However, none of the different types of emphysema distribution were found to be signiicant predictors of BMI ≤ 21 kg/m2, ≥ 2 exacerbations in the last year, mMRC dyspnea scale score ≥ 2, or post-6MWT oxygen desaturation ≥ 4%.
DISCUSSION
Although COPD is a highly heterogeneous disease, its phenotyping can be more precise when CT of the lung parenchyma is combined with an evaluation of the clinical and physiological characteristics. Here, we describe the role of using a qualitative analysis of CT indings in order to determine the distribution of pulmonary emphysema and the potential contribution
*
*
*
* *
*
6MWT
desaturation
, %
6MWT
distance
, m
FEV
1
,
, % predicted
FVC, % predicted
FEV
1
/FVC ratio
DL
CO, % predicte
d
Type 1 Type 2 Type 3 Type 4 Type 1 Type 2 Type 3 Type 4
Type 1 Type 2 Type 3 Type 4 Type 1 Type 2 Type 3 Type 4
Type 1 Type 2 Type 3 Type 4 Type 1 Type 2 Type 3 Type 4
20
10 15
5
0
600
150
100
50
0 500
300 400
200
100
0
120
100
60 80
40
20
0
100
60 80
40
20
0
100
60 80
40
20
0
***
*** ***
** **
**
*
* *
* p = 0.051
of that distribution to further characterizing the clinical severity of these patients.
Patients with COPD were classiied according to a subjective heterogeneity analysis of upper versus lower lung distribution of pulmonary emphysema, using a visual scoring system irst described by Chae et al.(18) In their assessments of the regional heterogeneity of the distribution of emphysema, those authors found a signiicant correlation between the quantitative assessment (with a computer algorithm) and the visual assessment. They also found that there was a considerable interobserver agreement in the visual assessment. Therefore, visual assessment of the distribution of pulmonary emphysema could be a reliable method, with one major advantage, which is the fact that everyone can use it, especially when CT analysis software is not available.
Our results suggest that, among COPD patients with emphysema, there is greater COPD severity, deined as a higher degree of airlow obstruction and lower alveolar-capillary diffusing capacity, in those with predominantly lower-lung emphysema, whereas functional status is better in those with predominantly upper-lung emphysema. These results can be explained, in part, by the smaller area of the lung affected when emphysema is predominantly in the upper lobes.
Regarding the COPD patients with homogeneous emphysema (type 3), our data indicate a tendency toward higher hyperinlation, with a higher RV/TLC ratio (Figure 2), although the difference did not reach statistical signiicance. That is probably associated with the broader, more uniform distribution of parenchymal destruction, together with the fact had a median pack-year smoking history was higher among the patients with type 3 emphysema distribution (60 pack-years vs. 40.5 pack-years for those with type 1 emphysema distribution; p = 0.012).
After stratifying the study population according to the cut-off values for the assignment of at least 1 point on the Body mass index, airlow Obstruction,
Dyspnea, and Exercise capacity (BODE) index,(21) which assesses the risk of death for COPD patients, we observed that type 4 emphysema distribution (slightly predominant in the lower lung) signiicantly increases the risk of severe airway obstruction (FEV1 < 65% of predicted) and reduced the 6MWD to < 350 m (Table 2). Hypoxemia was identiied as another risk factor for mortality in COPD.(21,29) Our results show that patients with emphysema that is slightly predominant in the lower lung are more likely to be hypoxemic.
Our indings are consistent with those of previous studies showing a strong association between lower-zone emphysema and airlow limitation.(18,19,30) In another study, however, upper-zone predominance of emphy -sema was associated with a worse total St George’s Respiratory Questionnaire score, although it was not signiicantly associate with FEV1 (% of predicted).
(17)
Reports are also inconsistent concerning the relationship between diffusing capacity and regional differences in emphysema distribution. Gurney et al.(31) observed that DLCO is more strongly affected by lower-lung emphysema than by upper-lung emphysema, whereas Parr et al.(32) found DLCO to be relatively preserved in patients with lower-lung emphysema. Those differences might be attributable to the different methods applied for assessing the regional distribution of emphysema. The present study has a number of limitations. First, the female gender is not well represented in this study group. However, that is representative of the gender distribution of emphysema patients treated at our outpatient clinic. Second, our sample did not include any subjects with clearly lower lung-predominant emphysema (type 5). Because most of the patients were smokers, that type of emphysema distribution (sparing the upper lung) would be expected to be rather rare. We can presume that the clinical-radiological correlations for type 5 emphysema would be similar to those found for type 4. In order to extrapolate our results, a larger study sample, with similar gender proportions and including all types of emphysema distribution, will be needed. Finally, some interobserver
Table 2. Distribution of pulmonary emphysema according to functional status and the respective functional severity.
Variable Emphysema distribution
Frequencya Adjusted ORb (95%
CI)
p n (%)
FEV1 < 65% of predictedc
Type 1 Type 2 Type 3 Type 4
14 (45.2%) 13 (61.9%) 12 (85.7%) 15 (78.9%)
1 (reference) 1.69 (0.32-8.92) 5.79 (1.06-31.64) 6.92 (1.43-33.45)
0.045* 0.537 0.043* 0.016*
6MWD < 350 mc
Type 1 Type 2 Type 3 Type 4
1 (3.6%) 2 (9.5%) 3 (21.4%) 9 (52.9%)
1 (reference) 1.63 (0.31-8.70) 5.58 (1.01-30.84) 6.36 (1.26-32.18)
0.064 0.567 0.049* 0.025*
Hypoxemiad
Type 1 Type 2 Type 3 Type 4
3 (13.0%) 4 (20.0%) 6 (50.0%) 9 (52.9%)
1 (reference) 2.85 (0.24-33.89) 7.60 (0.67-86.19) 32.66 (3.26-326.84)
0.006* 0.408 0.102 0.003* 6MWD: six-minute walk distance; type 1: obvious upper-lung predominance; type 2: slight upper-lung predominance; type 3: equal upper- and lower-lung extent; type 4: slight lower-lung predominance. aCorresponds only to patients with the lowest functional status, as deined in the irst column. bAdjusted for age and body mass index. cCut-off value for the assignment of at least 1 point on the Body mass index, airlow Obstruction, Dyspnea, and Exercise capacity (BODE) index. dDeined as a PaO
variability is predictable, as previously noticed.(18,33,34) Such disagreement can be seen primarily for patients with the least severe emphysema and with only partial upper or lower lung predominance. In fact, most discordant cases were related to classiication differences between contiguous types.
In the past, direct visual observation and subjective visual grading were considered to have similar precision as the computer-assisted methods of emphysema quantiication on CT scans.(35-39) Although we have not provided a direct measure of emphysema severity, the purpose of this study was to present a qualitative (rather than quantitative), simple, affordable alternative method that could be widely used by clinicians to classify the heterogeneity of pulmonary emphysema.
In summary, in this group of COPD patients with pulmonary emphysema, lower lung-dominant distribu -tion, as assessed by a subjective score, was found to have a signiicant impact on physiologic parameters, including pulmonary function test results and exercise capacity, although not on the clinical presentation of the disease, as assessed by the mMRC dyspnea scale score and the number of exacerbations in the last year. Further studies are warranted in order to conirm the importance of our indings.
ACKNOWLEDGMENTS
We thank Cristina Carrondo, Elisabete Santa Clara, Ermelinda Eusébio, Joana Pipa, Patrícia Dantas, Paulo Viana, and Teresa Santiago for performing the pulmonary function tests.
REFERENCES
1. Global Initiative for Chronic Obstructive Lung Disease [homepage on the Internet]. Bethesda: Global Initiative for Chronic Obstructive Lung Disease. [cited 2012 Dec 1]. Global Strategy for the Diagnosis, Management and Prevention of COPD--revised 2011. [Adobe Acrobat document, 90p.]. Available from: http://www.goldcopd.org/ uploads/users/iles/GOLD_Report_2011_Feb21.pdf
2. de Torres JP, Bastarrika G, Zagaceta J, Sáiz-Mendiguren R, Alcaide AB, Seijo LM, et al. Emphysema presence, severity, and distribution has little impact on the clinical presentation of a cohort of patients with mild to moderate COPD. Chest. 2011;139(1):36-42. http:// dx.doi.org/10.1378/chest.10-0984
3. Celli BR. Roger s. Mitchell lecture. Chronic obstructive pulmonary disease phenotypes and their clinical relevance. Proc Am Thorac Soc. 2006;3(6):461-6. http://dx.doi.org/10.1513/pats.200603-029MS
4. Marsh SE, Travers J, Weatherall M, Williams MV, Aldington S, Shirtcliffe PM, et al. Proportional classiications of COPD phenotypes. Thorax. 2008;63(9):761-7. http://dx.doi.org/10.1136/thx.2007.089193
5. Boschetto P, Quintavalle S, Zeni E, Leprotti S, Potena A, Ballerin L, et al. Association between markers of emphysema and more severe chronic obstructive pulmonary disease. Thorax. 2006;61(12):1037-42. http://dx.doi.org/10.1136/thx.2006.058321
6. Boschetto P, Miniati M, Miotto D, Braccioni F, De Rosa E, Bononi I, et al. Predominant emphysema phenotype in chronic obstructive pulmonary. Eur Respir J. 2003;21(3):450-4.
7. O’Donnell DE, Revill SM, Webb KA. Dynamic hyperinlation and exercise intolerance in chronic obstructive pulmonary disease. Am J Respir Crit Care Med. 2001;164(5):770-7. http://dx.doi.org/10.1164/ ajrccm.164.5.2012122
8. Diaz O, Villafranca C, Ghezzo H, Borzone G, Leiva A, Milic-Emil J, et al. Role of inspiratory capacity on exercise tolerance in COPD patients with and without tidal expiratory low limitation at rest. Eur Respir J. 2000;16(2):269-75. http://dx.doi.org/10.1034/j.1399-3003.2000.16b14.x
9. Kent BD, Mitchell PD, McNicholas WT. Hypoxemia in patients with COPD: cause, effects, and disease progression. Int J Chron Obstruct Pulmon Dis. 2011;6:199-208.
10. Hayhurst MD, MacNee W, Flenley DC, Wright D, McLean A, Lamb D, et al. Diagnosis of pulmonary emphysema by computed tomography. Lancet. 1984;2(8398):320-2. http://dx.doi.org/10.1016/ S0140-6736(84)92689-8
11. Müller NL, Staples CA, Miller RR, Abboud RT. ‘’Density Mask’’. An objective method to quantitate emphysema using computed tomography. Chest. 1988;94(4):782-7. http://dx.doi.org/10.1378/ chest.94.4.782
12. Gould GA, Redpath AT, Ryan M, Warren PM, Best JJ, Flenley DC, et al. Lung CT density correlates with measurements of airlow limitation and the diffusing capacity. Eur Respir J. 1991;4(2):141-6.
13. Haraguchi M, Shimura S, Hida W, Shirato K. Pulmonary function and regional distribution of emphysema as determined by high-resolution computed tomography. Respiration. 1998;65(2):125-9. http://dx.doi. org/10.1159/000029243
14. Edwards MA, Hazelrigg S, Naunheim KS. The National Emphysema Treatment Trial: summary and update. Thorac Surg Clin. 2009;19(2):169-85. http://dx.doi.org/10.1016/j.thorsurg.2009.02.007
15. Ingenito EP, Wood DE, Utz JP. Bronchoscopic lung volume reduction
in severe emphysema. Proc Am Thorac Soc. 2008;5(4):454-60. http:// dx.doi.org/10.1513/pats.200707-085ET
16. Silverman EK, Sandhaus RA. Clinical practice. Alpha1-antitrypsin deiciency. N Engl J Med. 2009;360(26):2749-57. http://dx.doi. org/10.1056/NEJMcp0900449
17. Mair G, Miller JJ, McAllister D, Maclay J, Connell M, Murchison JT, et al. Computed tomographic emphysema distribution: relationship to clinical features in a cohort of smokers. Eur Respir J. 2009;33(3):536-42. http://dx.doi.org/10.1183/09031936.00111808
18. Chae EJ, Seo JB, Song JW, Kim N, Park BW, Lee YK, et al. Slope of emphysema index: an objective descriptor of regional heterogeneity of emphysema and an independent determinant of pulmonary function. AJR Am J Roentgenol. 2010;194(3):W248-55. http://dx.doi. org/10.2214/AJR.09.2672
19. Nakano Y, Sakai H, Muro S, Hirai T, Oku Y, Nishimura K, et al. Comparison of low attenuation areas on computed tomographic scans between inner and outer segments of the lung in patients with chronic obstructive pulmonary disease: incidence and contribution to lung function. Thorax. 1999;54(5):384-9. http://dx.doi.org/10.1136/ thx.54.5.384
20. Park KJ, Bergin CJ, Clausen JL. Quantitation of emphysema with three-dimensional CT densitometry: comparison with two-dimensional analysis, visual emphysema scores, and pulmonary function test results. Radiology. 1999;211(2):541-7. http://dx.doi. org/10.1148/radiology.211.2.r99ma52541
21. Celli BR, Cote CG, Marin JM, Casanova C, Montes de Oca M, Mendez RA, et al. The body-mass index, airlow obstruction, dyspnea, and exercise capacity index in chronic obstructive pulmonary disease. N Engl J Med. 2004;350(10):1005-12. http://dx.doi.org/10.1056/ NEJMoa021322
22. Mahler DA, Wells CK. Evaluation of clinical methods for rating dyspnea. Chest. 1988;93(3):580-6. http://dx.doi.org/10.1378/ chest.93.3.580
23. Rodriguez-Roisin R. Toward a consensus deinition for COPD exacerbations. Chest. 2000; 117(5 Suppl 2):398S-401S. http://dx.doi. org/10.1378/chest.117.5_suppl_2.398S
24. Burge S, Wedzicha JA. COPD exacerbations: deinitions and
classiications. Eur Respir J Suppl. 2003;41:46s-53s. http://dx.doi.org /10.1183/09031936.03.00078002
25. Celli BR, MacNee W; ATS/ERS Task Force. Standards for the
diagnosis and treatment of patients with COPD: a summary of the ATS/ERS position paper. Eur Respir J. 2004;23(6):932-46. http:// dx.doi.org/10.1183/09031936.04.00014304
27. ATS Committee on Proiciency Standards for Clinical Pulmonary Function Laboratories. ATS statement: guidelines for the six-minute walk test. Am J Respir Crit Care Med. 2002;166(1):111-7. http:// dx.doi.org/10.1164/ajrccm.166.1.at1102
28. Webb WR. Radiology of obstructive pulmonary disease. AJR
Am J Roentgenol. 1997;169(3):637-47. http://dx.doi.org/10.2214/ ajr.169.3.9275869
29. Continuous or nocturnal oxygen therapy in hypoxemic chronic obstructive lung disease: a clinical trial. Nocturnal Oxygen Therapy Trial Group. Ann Intern Med. 1980;93(3):391-8. http://dx.doi. org/10.7326/0003-4819-93-3-391
30. Saitoh T, Koba H, Shijubo N, Tanaka H, Sugaya F. Lobar distribution of emphysema in computed tomographic densitometric analysis. Invest Radiol. 2000;35(4):235-43. http://dx.doi.org/10.1097/00004424-200004000-00004
31. Gurney JW, Jones KK, Robbins RA, Gossman GL, Nelson KJ, Daughton D, et al. Regional distribution of emphysema: correlation of high-resolution CT with pulmonary function tests in unselected smokers. Radiology. 1992;183(2):457-63. http://dx.doi.org/10.1148/ radiology.183.2.1561350
32. Parr DG, Stoel BC, Stolk J, Stockley RA. Pattern of emphysema distribution in alpha1-antitrypsin deiciency inluences lung function impairment. Am J Respir Crit Care Med. 2004;170(8):1172-8. http:// dx.doi.org/10.1164/rccm.200406-761OC
33. Hersh CP, Washko GR, Jacobson FL, Gill R, Estepar RS, Reilly JJ,
et al. Interobserver variability in the determination of upper lobe-predominant emphysema. Chest. 2007;131(2):424-31. http://dx.doi.
org/10.1378/chest.06-1040
34. Bankier AA, De Maertelaer V, Keyzer C, Gevenois PA. Pulmonary emphysema: subjective visual grading versus objective quantiication with macroscopic morphometry and thin-section CT densitometry. Radiology. 1999;211(3):851-8. http://dx.doi.org/10.1148/ radiology.211.3.r99jn05851
35. Bergin C, Müller NL, Nichols DM, Lillington G, Hogg JC, Mullen B, et al. The diagnosis of emphysema. A computed tomographic– pathologic correlation. Am Rev Respir Dis. 1986;133(4):541-6.
36. Hruban RH, Mezian MA, Zerhouni EA, Khouri NF, Fishman EK, Wheeler PS, et al. High resolution computed tomography of inlation-ixed lungs. Pathologic-radiologic correlation of centrilobular emphysema. Am Rev Respir Dis. 1987;136(4):935-40. http://dx.doi. org/10.1164/ajrccm/136.4.935
37. Miller RR, Müller NL, Vedal S, Morrison NJ, Staples CA. Limitations of computed tomography in the assessment of emphysema. Am Rev Respir Dis. 1989;139(4):980-3. http://dx.doi.org/10.1164/ ajrccm/139.4.980
38. Kuwano K, Matsuba K, Ikeda T, Murakami J, Araki A, Nishitani
H, et al. The diagnosis of mild emphysema. Correlation of computed tomography and pathology scores. Am Rev Respir Dis. 1990;141(1):169-78. http://dx.doi.org/10.1164/ajrccm/141.1.169