* Corresponding author. Tel: +989123509871 E-mail addresses: [email protected] (L. Mohajeri)
© 2012 Growing Science Ltd. All rights reserved. doi: 10.5267/j.msl.2011.12.022
Contents lists available atGrowingScience
Management Science Letters
homepage: www.GrowingScience.com/msl
The effects of intellectual capital on financial performance: A case study of petrochemical and pharmaceutical firms
Naser Azada Leyla Mohajerib*
aDepartment of Management, Islamic Azad University, South Tehran Branch, Tehran, Iran
bDepartment of Management, Islamic Azad University, Arak Branch, Arak, Iran
A R T I C L E I N F O A B S T R A C T
Article history:
Received July 5, 2011 Received in Revised form October, 12, 2011
Accepted 18 December 2011 Available online
28 December 2011
There is no doubt that traditional accounting does not provide actual value of assets since they only measure tangible assets. Intellectual capital provides a new concept for measuring actual value of the assets and we can calculate future values of the firm. In this paper, we first calculate intellectual capital based on the ratio of market value/book value for three years period. Then we investigate the relationship between intellectual capital and growth rate of intellectual capital as well as financial performance of some publicly traded petrochemical and pharmaceutical firms. The results of our survey indicate that there is a positive relationship between intellectual capital and equity growth with EVA and return of assets. However, there is no meaningful relationship between intellectual assets with net earnings.
© 2012 Growing Science Ltd. All rights reserved.
Keywords:
Intellectual capital Financial return EVA
Return of assets Earning per share
1. Introduction
There are many governmental managers believe that intellectual capital (IC) represent basic assets, which guarantee the success of any society. Intellectual assets increase productivity and efficiency, which influence positively on the market. However, we could rarely observe IC on firms' balance sheets and this is in serious conflict with knowledge economy where the basis of knowledge of established on knowledge (Boekestein, 2009). Therefore, firms are able to reach competitive advantage through maintaining intellectual assets and we need to find out on how to assess IC and the impact of IC on other financial figures.
items, which could substantially contribute to business models. In other words, IA is normally an exclusive part of a business unit. This could normally include various items such as good will, reputation, brand, etc. (Huggins, 2007; Boekestein, 2009). According to Isaac and Herremans (2009), IC is an exclusive intellectual property, which allows firms have continuous improvement proportion to changes on the environment.
The difference between book value and market value is one of the most controversial studies in the past few years. An official balance sheet normally shows the difference between total assets and total liabilities as the total equities and this can be interpreted very easily. However, stock market does not normally assign value based on what we see on balance sheet and in some cases, market appreciate the shares of a company solely based on intangible assets, which would not be traced in official transcript such as financial statement or balance sheet (Soler, 2007; Lee et al., 2010). Therefore, there is no doubt that tangible assets do not represent actual value of the firms and the focus must be concentrated more on intangible assets (Cordazzo, 2007). Innovation, change on culture, market leadership and other important factors cannot be described, very easily. They are simply the reflection of continuous improvement or market investment (Burgman & Roos, 2007; Dumay & Cuganesan,
2011). Wang (2008) explained that there are many advantages on changing intangible assets into
intellectual capital. An increase in competitive advantage in the market based on knowledge, organization, technique, professional skills and customer relationship management and experience could establish sustainable assets for modern economy. In current environment, most companies require to learn and control their intellectual capitals. Therefore, measuring the performance of IC plays an important role for the success of various firms. Tan et al. (2007) also specified that IC is one of the most important components for having successful organizations. According to Boekestein (2009) acquisitions reveal the intellectual capital of pharmaceutical companies. Huang (2010) studied contingency factors influencing the availability of internal intellectual capital information. Ting and Lean (2009) investigated Intellectual capital performance of financial institution in Malaysia and revealed that IC significantly impacts the performance of the firms in this country. In this paper, we first calculate intellectual capital based on the ratio of market value/book value for three years period. Then we investigate the relationship between intellectual capital and growth rate of intellectual capital as well as financial performance of some publicly traded petrochemical and pharmaceutical firms.
2. The proposed study
The following hypotheses are investigated for the some of the publicly traded companies whose shares are traded on Tehran Stock Exchange (TSE).
2.1 First main hypothesis: There is a relationship between IC and performance of the companies.
2.1.1 There is a positive relationship between IC and return on equity (ROE).
2.1.2 There is a positive relationship between IC and earning per share (EPS).
2.1.3 There is a positive relationship between IC and return on asset (ROA).
2.2. Second main hypothesis: There is a positive relationship between IC and performance.
2.2.1 There is a positive relationship between IC and ROA.
2.2.2 There is a positive relationship between IC and EPS.
2.2.3 There is a positive relationship between IC and ROE.
2.3 There is a positive relationship between industry and performance.
2.3.1 There is a positive relationship between industry and ROA.
M.R. Rahimi Shasabadi and N Azad / Management Science Letters 2 (2012)
513
2.3.3 There is a positive relationship between industry and ROE.
To perform the survey, we calculate market value (MV), EPS and ROA based on the official statements and balance sheets of companies for three fiscal years of 2007 to 2010. The sample size includes all related companies whose shares were traded on TSE. In this paper, we calculate market brand (MB) as the difference between market value (MV) and book value (BV), e.g. MB= MV- BV. Intellectual capital is also calculated as IC=MV-BV. The growth on IC in each year is calculated compared with the previous year. Return of equities is calculated as the ration of net profit on total equities. Another ratio is the return on assets, which is calculated as follows,
Net earning Total assets
ROA (1)
Return on investment is also calculated as follows,
Operating profit Total assets
ROI . (2)
Finally, the ration of price on earning (P/E) is also calculated as follows,
Price of the each share traded on the market /
Net profit per share
P E . (3)
There are three independent variables of Intellectual capital (IC), growth of IC and IC in different industries. The dependent variables are ROA, ROE and EPS.
3. Results
In this research, we have gathered the data from official statements and balance sheets provided on stock market.
3.1 The results of the first sub-hypothesis
Table 1 summarizes details of our survey for the first hypothesis of the survey.
Table 1
The results of the relationship between IC and ROE
B Standard deviation Standardized coefficient t-student P-value
Intercept 1.992 0.056 35.684 0.000
IC 2.768E-7 0.000 0.548 3.652 0.001
As we can observe from the results of the regression analysis, t-students are highly valid indicating that there is a meaningful relationship between ROE and IC. In other words, an increase of a unit in IC would result to an increase of 0.548 to ROE.
3.2 The results of the second sub-hypothesis
Table 2 summarizes details of our survey for the impact of independent variable, IC, on EPS using ANOVA test.
Table 2
ANOVA test results for the relationship between IC and EPS
Sum of Square df Mean Square F-value P-value
The change of independent variable on
dependent variable .434
1 .434 .514 0.479
The change of independent variable on
stochastic factors 25.323
30 0.844
no linear relationship between EPS and IC.
3.3 The results of the third sub-hypothesis
Table 3 summarizes details of our survey for the first hypothesis of the survey.
Table 3
The results of the relationship between IC and ROA
B Standard deviation Standardized coefficient t-student P-value
Intercept 16.575 2.383 6.956 .000
IC 4.329E-6 .000 .376 2.402 .022
As we can observe from the results of the regression analysis, t-students are highly valid indicating that there is a meaningful relationship between ROA and IC. In other words, an increase of a unit in IC would result to an increase of 0.378 to ROA.
3.4. The results of our survey on the first sub-hypothesis from the second main hypothesis
In order to study the relationship between ROE and IC we have performed correlation test and the coefficient was calculated as 0.607 with standard deviation of 0.25338 and Dourbin Watson ration of 1.693. In other word, we can conclude that there is meaningful relationship between these two variables leaving us to conclude that an increase of one unit in IC would result to an increase of 0.607 to ROE.
3.5. The results of our survey on the second sub-hypothesis from the second main hypothesis
Table 4 summarizes details of our survey for the impact of independent variable, IC, on EPS using ANOVA test.
Table 4
ANOVA test results for the relationship between IC and EPS
Sum of Square df Mean Square F-value P-value
The change of independent variable on dependent variable
2.044 1 2.044 2.561 0.119
The change of independent variable on stochastic factors
26.341 33 .798
Sum 28.385 34
As we can observe from the result of our ANOVA test, F-value is meaningless indicating that there is no linear relationship between EPS and IC.
3.6. The results of our survey on the third sub-hypothesis from the second main hypothesis
Table 5 summarizes details of our survey for the impact of independent variable, IC, on EPS using ANOVA test.
Table 5
ANOVA test results for the relationship between IC and ROI
Sum of Square df Mean Square F-value P-value
The change of independent variable on
dependent variable 338.975
1
338.975 1.768 0.192
The change of independent variable on
stochastic factors 6901.248
36
191.701
M.R. Rahimi Shasabadi and N Azad / Management Science Letters 2 (2012)
515
As we can observe from the result of our ANOVA test, F-value is meaningless indicating that there is no linear relationship between ROI and IC.
3.7 The results of our survey on the first sub-hypothesis from the third main hypothesis
Table 6 summarizes details of our survey for the first part of the third hypothesis of the survey.
Table 6
The results of the relationship between industry as independent variable and ROA
B Standard deviation Standardized coefficient t-student P-value
Intercept 1.743 0.192 9.076 .000
Industry .216 0.110 0.324 1.969 .047
As we can observe from the results of the regression analysis, t-students are highly valid indicating that there is a meaningful relationship between ROA and Industry. In other words, an increase of a unit in industry would result to an increase of 0.324 to ROA.
3.8 The results of our survey on the second sub-hypothesis from the third main hypothesis
Table 7 summarizes details of our survey for the impact of independent variable, Industry, on EPS using ANOVA test.
Table 7
ANOVA test results for the relationship between Industry and EPS
Sum of Square df Mean Square F-value P-value
The change of independent variable
on dependent variable 338.975
1
338.975 1.768 0.192
The change of independent variable
on stochastic factors 6901.248
36
191.701
Sum 7240.223 37
As we can observe from the result of our ANOVA test, F-value is meaningless indicating that there is no linear relationship between ROI and industry.
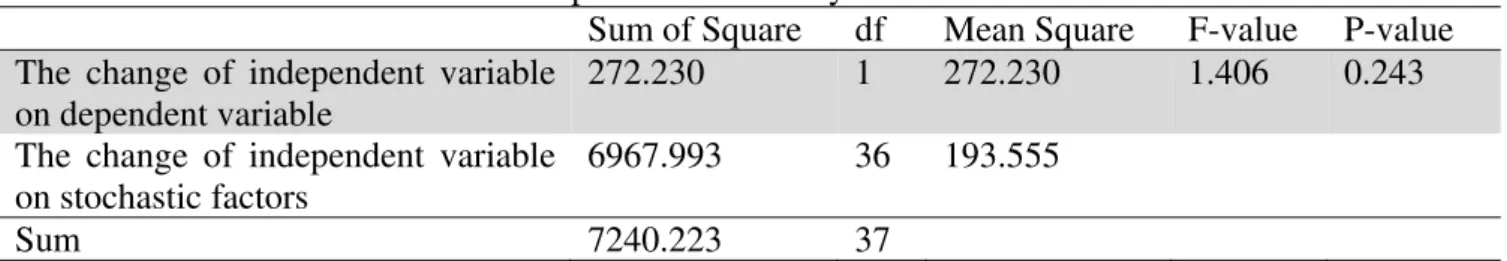
3.9 The results of our survey on the third sub-hypothesis from the third main hypothesis
Table 8 summarizes details of our survey for the impact of independent variable, Industry, on EPS using ANOVA test.
Table 8
ANOVA test results for the relationship between Industry and ROI
Sum of Square df Mean Square F-value P-value
The change of independent variable on dependent variable
272.230 1 272.230 1.406 0.243
The change of independent variable on stochastic factors
6967.993 36 193.555
Sum 7240.223 37
In this paper, we have presented a conceptual model to investigate the effect of intellectual capital on financial performance. We calculated intellectual capital based on the ratio of market value/book value for three years period. Then we investigated the relationship between intellectual capital and growth rate of intellectual capital as well as financial performance of some publicly traded petrochemical and pharmaceutical firms. The results of our survey indicated that there was a positive relationship between intellectual capital and equity growth with EVA and return of assets. However, there was no meaningful relationship between intellectual assets with net earnings.
References
Boekestein, B. (2009). Acquisitions reveal the intellectual capital of pharmaceutical companies.
Journal of intellectual capital, 10(3), 389-400.
Burgman, R., & Roos, G. (2007). The importance of intellectual capital reporting: evidence and
implications. Journal of Intellectual capital, 8(1), 7-51.
Cordazzo M. (2007). Intangibles and Italian IPO prospectuses: a disclosure analysis. Journal of
Intellectual capital, 8(2), 288-305.
Choong, K.K. (2008). Intellectual capital: definitions, categorization and reporting models. Journal
of intellectual capital, 10(1), 81-92.
Dumay, J., & Cuganesan, S. ( 2011). Making sense of intellectual capital complexity: measuring
through narrative. Journal of Human Resource Costing & Accunting, 15(1), 24-49.
Delgado-verde, M., de castro, G.M., & Navas- Lopez, J. E.(2011). organizational knowledge assets
and innovation capability Evidence from Spanish manufacturing firms. Journal of intellectual
capital, 12(1), 5-19.
Huang, C.C. (2010). Contingency factors influencing the availability of internal intellectual capital
information. Journal of financial Reporting and Accounting, 8(1), 1-21.
Huggins, R. (2007). Intellectual assets and public policy. Journal of Intellectual, 8(4), 708-720.
Isaac, R. G., & Herremans, I.M. (2009). Intellectual capital management :pathway to wealth creation.
Journal of intellectual capital, 10(1), 81-92.
Lee, L.L. (2010). Visualising and measuring intellectual in capital markets :a research method. Journal of intellectual capital, 11(1), 4-22.
Martin, G. (2008). Intellectual capital in high- teach firm: the case of Spain. Journal of Intellectual
capital, 9(1), 25-36.
Marı´a Dı´ez, J., Ochoa, M.L., Begon˜a Prieto, M., & Santidria´n , A. (2010). Intellectual capital
value creation in Spanish firms. Journal of intellectual capital, 11(3), 348-367.
Soler, L.E.V. (2007). Evaluating the scope of IC in firms value. Journal of intellectual capital , 8(3),
470-493.
Tan, H.P., Plowman, D., & Hancock, P. (2007). Intellectual capital and financial returns of
companies. Journal of Intellectual Capital, 8(1), 76-95.
Ting, I.W.K., & Lean, H. H. (2009). Intellectual capital performance of financial institution in
Malaysia. Journal of Intellectual capital , 10(4), 588-599.
Wang, J.C. (2008). Investigating market value and intellectual capital for S & P 500. Journal