REGULATION OF T LYMPHOCYTE SUBPOPULATIONS IN SPECIFIC PATHOGEN-FREE CHICKENS
FOLLOWING EXPERIMENTAL FOWL ADENOVIRUS-Ⅷ INFECTION
Chun-jie Wang*1, Siriguleng Yu1, Ao-ri-ge-le2, De-gang Jia1, Hong-qiang Yao1, Huai-ping Zhao1, H.S. Lillehoj3, Si-mu-ji-de2, Andrew CL Postnikoff4, Si-ri-gu-leng Xu1
1
Department of Basic Veterinary, College of Veterinary Science, Inner Mongolia Agricultural University, Huhhot, Inner
Mongolia, China, 010018; 2 Department of Animal Production and Management, College of Animal Science, Inner Mongolia
Agricultural University, Huhhot, Inner Mongolia, China, 010018 ;3 Animal Parasitic Diseases Laboratory, Animal and Natural
Resources Institute, U. S. Department of Agriculture-ARS, Beltsville, MD. 20705, USA; 4 College of Ecology and Environmental
Science, Inner Mongolia Agricultural University, Huhhot, Inner Mongolia, China, 010018.
Submitted: April 02, 2011; Returned to authors for corrections: November 25, 2011; Approved: June 07, 2012.
ABSTRACT
Two-day-old specific pathogen-free (SPF) chickens were divided into two groups. Group I was inoculated
orally with fowl adenovirus Ⅷ (FAV-Ⅷ). Group II served as a negative control. Chickens were investigated at various days post-inoculation (dpi) by flow cytometric analysis for changes in T lymphocyte
subpopulations in immune system and blood. In the thymus, CD3+T lymphocytes were increased at 25 dpi,
with significant increases in the FAV infected noted at 1, 12, 20dpi (p<0.05). This was accompanied by a
corresponding increase of CD4+ and CD8+ T lymphocytes. In the spleen, CD3+ and CD4+ T lymphocytes were increased significantly at 30 dpi (p<0.01) whereas CD8+ and TCR γδ+ T lymphocytes were decreased at 1 (p<0.05), 30 dpi (p<0.01). An increase of CD3+, CD4+ and CD8+ T lymphocytes was noticed in
peripheral blood, and accompanied by a decrease of TCR γδ+ T lymphocytes. These results demonstrated that infection with FAV-Ⅷ causes significant fluctuations in T lymphocyte subpopulations in thymus, blood
and spleen. It can be concluded that an infection with FAV-Ⅷ has profound effects on the immune system, especially on cell mediated immune competency.
Key words:Cell mediated immune competency, Fowl adenovirus Ⅷ, Immune system, Peripheral blood, T lymphocyte subpopulations
INTRODUCTION
Inclusion body hepatitis (IBH) is caused by fowl
adenovirus (FAV) and induces acute infection in chickens.
FAV is mainly infectious for young chickens, and is
characterized by many pathological changes including necrotic
hepatitis, acidophilus or basophilic inclusion body in the
nucleus of liver cells. The main clinical symptoms of IBH
include anemia and severe dysentery. IBH is most commonly
seen in chickens between 3 and 7 week of age but has been
reported as early as 7 days of age with high mortality (Howell
et al. 1970). Normally IBH infection persists for 7~10 days.
However, in some cases, persistence of IBH up to 20 days been
reported (Reece et al. 1986). The outbreak of IBH has been
reported in many countries, including an outbreak in Hohhot
City of Inner Mongolia in 1991. The inclusion body hepatitis
viruses are characterized as AAV Ⅷ and AAV Ⅱ, and
designated as AAV-HB and AAV-HA respectively. There have
been numerous studies on their pathology and pathogenesis
(Wang et al. 1999). Gross lesion of IBH consists of
hemorrhagic, pale yellow, swollen, friable livers. Typically,
pancreas, leg, musculi thoracis, thymus and bursa are all
hemorrhagic. Pathological changes of tissues, which are mainly
expressed as necrosis of liver, eosinophilic and basophilic
intranuclear inclusion bodies, have occurred in hepatocyte,
Kupffer cell and pancreatic cells with karyomegaly.
Histological sections from bursa, spleen and the thymus
showed severe depletion, reticular cells and macrophage
hyperplasia. In young chicks with IBH, the spleen and thymus
were not fully developed (Hao et al. 1996; Pilkington et al.
1997). These chicks easily succumbed to other infectious
diseases, such as infectious bursal disease virus (Sentíes-Cué
CG et al. 2010). In the humoral immunity of IBH,
broiler-breeder progenies from 30- to 50-wk-old grandparents
vaccinated with AAV 8/11 vaccine were adequately protected
against the AAV 8 and 11 serotypes and the Stanford strain
(Alvarado IR et al. 2007). In order to analyze host immune
response to FAV, we also investigated changes in T
lymphocyte subpopulations in various lymphoid tissues
following IBH infection.
MATERIALS AND METHODS
Chicken
Specified pathogen-free (SPF) eggs were obtained from
the research centre of Beijing experimental animal, hatched in
the Inner Mongolia Biological medicine plant, and raised at the
Inner Mongolia Agricultural University. Chickens were
separated into two groups: uninfected and FAV Ⅷ-infected, and kept separately. They were raised by two people in two
rooms, were supplied air disinfected with potassium
permanganate three times, fed with hyperbaric steamed forage
and boiled water. Ventilation was directly outside.
Virus
Fowl adenovirus Ⅷ was obtained from China medicine checking institute, plaque purified and diluted in PH 7.4 0.01%
PBS. Infection of chickens with FAV Ⅷ was carried out by oral inoculation of 2-day-old chickens with 105 plaque forming
units (PFU) of FAV Ⅷ.
Experimental design and flow cytometry detection
Ten chickens from both the uninfected and FAV-infected
groups were separately sacrificed by taking blood from heart
via injector till death at 1, 3, 5, 7, 9, 12, 15, 20, 25 and 30 days
post inoculation. Lymphocytes were purified by density
gradient separation using 1ml heparin anticoagulative blood
and 1ml PH 7.4, 0.001 % PBS mixture added gently on the 1ml
density gradient separation (the main components were
glucosan and diatrizoate meglumine) (1.077, HongRi Biotec.).
Lymphocytes from thymus and spleen were prepared by
filtrating through 200-mesh cell screen after softly mincing on
it (Yin & Liu 1999). For each antibody, 1×10⁶/ml live
lymphocytes were incubated with FITC/CD4-R-PE,
CD3-FITC/CD8-R-PE or CD3-FITC/TCR γ δ-R-PE antibodies
(Serotec.) at 4℃ for 30 minuets, washed with PBS (PH7.4,
0.01M, 4℃) 3 times by centrifuging at 2000rpm for 5min each
time at 4℃. Staining was assessed by flow cytometry on 10,000 live cells, data from flow cytometry was analyzed using
with the Cell Quest software (BD Biotec.).
Statistics
Data from the two samples was analyzed using parametric
t tests (Kiyoshi 2001).
RESULTS
Gross lesions
Infected chickens showed hemorrhagic, pale yellow,
swollen, friable livers with white foci of necrosis. Hemorrhagic
tissues were present in pancreas, leg and musculi thoracis etc
yet. Hemorrhagic tissue was also seen in the thymus and bursa.
Three chickens died separately at 5dpi, and two more died at
6dpi, providing a mortality rate of 0.05%. The other infected
chickens' body weights were also lower than control.
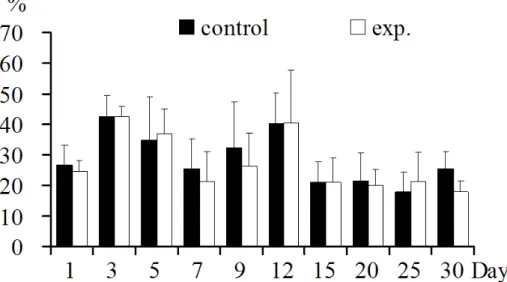
Regulations of T lymphocytes and its subpopulations In thymus: Thymus CD3+T lymphocyte was increased significantly at 1, 12, 20 dpi(p<0.05), was not increased
significantly at 7, 9, 25 dpi (p>0.05), and was decreased
significantly at 3, 15 dpi (p<0.05) (Fig.1).
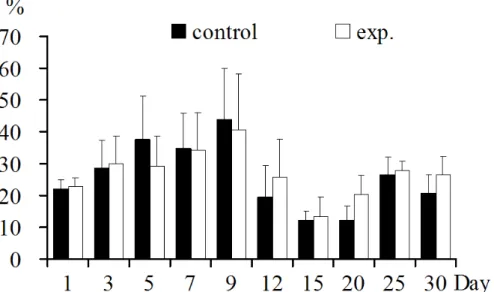
CD3+CD4+T lymphocyte increased significantly at 12 dpi
(p<0.05), and decreased extremely significantly at 30dpi
(p<0.01) (Fig.2).
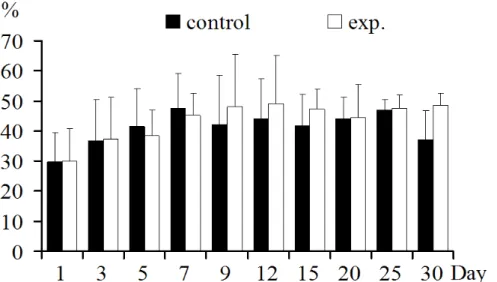
CD3+CD8+ T lymphocyte increased in 1-3, 12-30 dpi,
with significant increase at 20, 30 dpi (p<0.05). However, there
was significant decrease at 5-9dpi(p>0.05) (Fig.3).
Figure 1. CD3+T lymphocytes in thymus: CD3+T lymphocyte increased significantly in 1,12, 20 days post inoculation (p<0.05) or not significantly in 7, 9, 25 days, decreased significantly in 3, 15 days post inoculation (p<0.05).
Figure 3. CD8+T lymphocytes in thymus: CD8+T lymphocyte increased 1-3, 12-30 dpi and significantly in 20, 30 dpi (p<0.05). Decreased in 5-9 dpi.
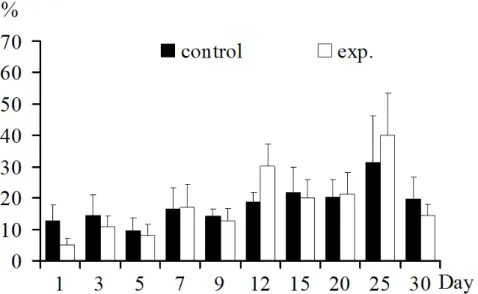
In spleen: Spleen TCR γδ+ T lymphocyte increased only on 5, 7, 15, 20 dpi (p>0.05). It decreased on all other days post
inoculation (p>0.05) (Fig.4).
CD3+T lymphocyte increased in 1-3, 9-30dpi (p>0.05) and
extremely significantly in 30 dpi (p<0.01). Non significant
decrease was noted on 5, 7 dpi (Fig.5).
CD3+CD4+T lymphocytes all increased and were
extremely significantly at 30 dpi (p<0.01). There was only non
significant decrease in 1, 5, 7 dpi (Fig.6).
CD3+CD8+T lymphocyte increased in 9-15 dpi (p<0.05),
with non significant decrease in 1-7, 20-30 dpi (Fig.7).
Figure 4. TCR γδ+ T lymphocytes in spleen: TCR γδ+ T lymphocyte increased only in 5, 7, 15, 20 dpi. Decreased in other days post inoculation.
Figure 5. CD3+T lymphocytes in spleen: CD3+T lymphocyte increased 1-3, 9-30dpi and extremely significantly in 30-day post inoculation (p<0.01).
Figure 6. CD4+T lymphocytes in spleen: CD4+T lymphocyte increased except1, 5-7 dpi and extremely significantly in 30 dpi (p<0.01).
In blood: Blood/TCR γ δ+ T lymphocyte: TCR γ δ+ T lymphocyte decreased, except in 3, 5 dpi. The decrease was
significant in 7 dpi (p<0.05) (Fig.8).
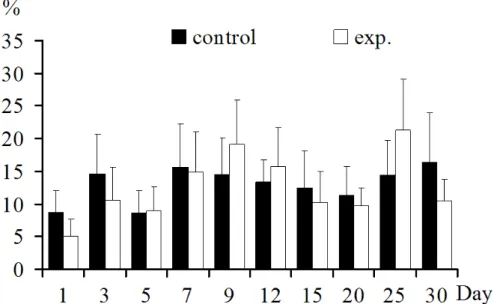
CD3+T lymphocyte increased significantly in 12 dpi
(p<0.01). It decreased significantly in 1 (p<0.01), 30 (p<0.05)
dpi (Fig.9).
CD3+CD4+T lymphocyte increased significantly in 25 dpi
(p<0.05). It decreased significantly in 1, 30 dpi (p<0.05)
(Fig.10).
CD3+CD8+T lymphocyte increased significantly in 9
(p<0.05), 25 (p<0.01) dpi. It decreased significantly in 1-3, 30
dpi (p<0.05) (Fig.11).
Figure 8. TCR γ δ+ T lymphocytes in blood: TCR γ δ+ T lymphocyte increased in 3-5 days, and decreased in other days and significantly in 7-day (p<0.05) post inoculation.
Figure 9. CD3+T lymphocytes in blood: CD3+T lymphocyte increased extremely significantly in 12-day (p<0.01) post inoculation. Decreased significantly in 1 (p<0.01), 30 (p<0.05) days post inoculation.
Figure 10. CD4+T lymphocytes in blood: CD4+T lymphocyte increased significantly in 25-day post inoculation (p<0.05). Decreased significantly in 1, 30 days post inoculation (p<0.05).
Figure 11. CD8+T lymphocytes in blood: CD8+T lymphocyte increased 9-15 and significantly in 9 (p<0.05), 25 (p<0.01) days post inoculation. Decreased in 1-7, 20, 30 and significantly in 1-3(p<0.05), 30(p<0.01) days post inoculation.
DISCUSSION
Several workers have used ELISA and CIE to evaluate the
humoral immune response of chicks infected with different
clinical isolates (Maiti & Sarkar 1997; Dawson & Pronovost
1980; Calnek et al. 1982). The present study demonstrates for
the first time that virulent fowl adenovirus induces the
response of T lymphocyte and its subpopulations in infected
chicken in lymph organs and blood.
All gross lesions and pathological changes in the present
study were the same as those reported before (Saifudin & wilks
necrosis appeared severely in day 3-7 and day 12 of post
inoculation (dpi) and also appeared slightly at 25 dpi in a few
chickens. pathological change, including pathological changes
of other organs, has 3 peaks during 1-30 dpi. The peaks were at
3-7 dpi, 12dpi and 25 dpi. These indicate that IBH will occur
many times with only one exposure, but less severely every
time. Body weight in the affected appeared less than the
uninfected (Sentíes-Cué CG et al. 2010). This maybe due to
lesions of liver cells influencing endocrine growth factors or
other. Hemorrhagic and lymphocyte depletion also occurred in
lymph organs. Lymphocytes proliferated in liver, pancreas and
other organs both as dispersed and clumped groups. The
immunology in the current IBH procedure interestingly differs
from earlier studies made by Md. Saifuddin measuring
neutralize antibody (Saifudin & wilks 1991) which reported no
T lymphocyte in IBH.
The thymus is essential for the maturation of T cells and
the development of cell mediated immunity. CD3+T
lymphocyte increased significantly at 1, 12, 20 dpi. These days
correspond to the start and the beginning stage of every
pathological change. Significantly decrease occurred at 3, 15
dpi, which were after the virus invasions of 1, 12 dpi. These
values indicate that mature T lymphocyte in the thymus
activated and was significantly increased by the invasion of
FAV- at every beginning stage of pathological change. This
was often followed by a significant decrease, which might be
caused by the infection moving into spleen, blood or damaged
by virus, because all necrosis and lymphocyte loss were seen in
thymus at 3-15 dpi in the most sharply pathological changing.
CD3+CD8+T lymphocyte increased significantly at 20, 30
dpi, and they all were in the preparing for serving into spleen
and blood. CD8+T lymphocyte was more active than CD4+T
cell in this case, because CD8+ Tc (TCL) can recognize the cell
expressing antigen (virus) combined with MHC I and kill it;
since the thymus was also infected with the virus here, and
appeared hemorrhagic and depleted, so CD8+T lymphocyte
more activate and prolific in the infected than in the control
(uninfected) population, except at 5-9 dpi which showed
damage from the first attack by the virus.
The main immunological function of the spleen is to filter
the blood by trapping blood borne micro-organisms and
producing an immune response to them.
Spleen CD3+TCR γ δ+ T lymphocyte showed no
significant change, which means that CD3+TCR γ δ+ T lymphocyte was neither degraded nor activated significantly by
FAV-. Blood TCR γ δ+ T lymphocyte levels generally decreased, with a significant decrease at 7 dpi, though there
was an insignificant increase in 3-5dpi. This indicates that TCR
γ δ+
T lymphocyte was slightly inhibited. TCR γ δ+ T lymphocyte is present as 20%-25% of blood matured T cells in
chicken (Yin & Liu 1999). It may act as the first line of
defense, TCR γ δ+ T cell is express CTL granular as in NK cells including perforin, serine esterase1 and serine esterase2
(Nakata et al.1990). TCR γ δ+ T cell also stimulates the secretion of many kinds of lymphokines (Spits et al.1990). It
can introduce a cytotoxic action in killing tumor cell of NK
cells. It was also significantly increased in little guts and spleen
in coccid-infected chicken. However, it was inhibited in the
IBH chickens in this study except in blood levels of the 3-5
dpi.
T lymphocytes and their subsets of spleen and blood cells
all decreased significantly in the early time of virus
inoculation. This was expressed through the pathologic damage
of this disease and is consistent with the step of pathological
changes of other organs; CD3+, CD4+ and CD8+T lymphocytes
of spleen and blood all increased, often significantly, with a
second pathological peak occurring at about 12dpi. This may
be the result of activating the memory T lymphocyte produced
at the first peak, also coming from thymus. They were
damaged during the anti-viral processes at 15-20dpi. There was
a third pathological changing peak with corresponding increase
at 25 dpi, followed by a significant decrease at 30dpi. These
levels typically were only 2-3 days later than a significant
increase in k1+ mono-macrophage in both spleen and blood,
which can present antigens to lymphocytes and make
lymphocyte proliferation. However, analysis of k1+
macrophage response is beyond the scope of this paper, and is
addressed by other studies. After the lymphocyte proliferation,
there was once again subsequent damage.
If the virus had not been eliminated thoroughly in the end,
they invaded hepatocytes and proliferated in them. Then the
hepatocytes died and discharged the virus into blood, causing
viremia (Saifudin & Wilks 1991). This caused the activation of
Mφ, which leads to cell immunological and humoral
immunological to anti viral responses. After, Mφ and
lymphocytes were damaged and their count was lower than the
control (in the same experiment no reported). The virus then
invaded and proliferated in liver, pancreas, etc. cells again,
causing the next viremia, and another immunologic response
by activating the memory lymphocytes. This cycle continues to
repeat. However, the pathological damage is lower every time,
because the FAV- invaded cells were correspondingly lower,
and the so the immunological response was also lower. This
was determined in another experiment detecting in situ
pathogen.
These findings agree with the findings of some earlier
reports, which state that adenovirus (HEV) infection depressed
cell-mediated immune competency (Nagaraja et al. 1982;
Suresh & Sharma 1995; Singh et al. 2006). However, this
conclusion is not universally accepted (Kumar et al. 1989; Lal
et al. 1991).
CONCLUSION
These studies demonstrate that infection with FAV- causes
significant fluctuations in T lymphocyte subpopulations in the
thymus, blood and spleen. It can be concluded that an infection
with FAV- has profound effects on the immune system,
especially cell mediated immune competency. However, variation
in the results of cellular immune competency means further
studies with pathogenic strains of FAV are necessary.
ACKNOWLEDGEMENTS
This work was supported by the natural science fund of
China (subject number: 30160067) and the Inner Mongolia
natural science fund.
REFERENCES
1. Alemnesh, W.; Hair-Bejo, M.; Aini, I.; Omar, A.R. (2011). Pathogenicity of Fowl Adenovirus in Specific Pathogen Free Chicken Embryos. J Comp Pathol. Jun 24. [Epub ahead of print]
2. Alvarado, I.R.; Villegas, P.; El-Attrache, J. et al. (2007). Genetic characterization, pathogenicity, and protection studies with an avian adenovirus isolate associated with inclusion body hepatitis. Avian Dis. Mar; 51(1):27-32.
3. Calnek, B.W.; Shek, W.R. et al. (1982). Serological cross-reactivity of avian adenovirus serotypes in an enzyme-linked immunosorbent assay.
Avian Dis. 26, 897-906.
4. Chandra, R.; Shukla, S.K. et al. (1999). The hydropericardium syndrome and inclusion body hepatitis in domestic fowl. Trop. Anim. Health. Pro. 32, 99-111.
5. Chun-jie, W.; Xian-pu, H.; Xi, L. (1998). Study on the Location of Virus Antigen pathogenesis of experimental inclusion body hepatitis in chicken. Master paper of Inner Mongolia agricultural University.
6. Dawson, G.J.; Pronovost, A.D. (1980). An enzyme-linked immunosorbent assay for detection of antibodies to avian adenovirus and avian adenovirus-associated virus in chickens. Avian Dis. 24,393-402. 7. Howell, J.; MacDonald, D.W.; Christian, R.G. (1970). Inclusion Body
Hepatitis in Chicken. Can. Vet. J. 5, 99-101.
8. Ichihara, K. (2001). Statistics for Bioscience. 72-74. Nankodo publishers limited, Tokyo.
9. Kumar, U.K.; Krishnaswamy, S. et al. (1989). Cell mediated immune response to egg drop syndrome 76 (EDS-76) virus infection in chickens. Curr. Sci. 58,431–3.
10. Lal, B.; Maiti, N.K. et al. (1991). Cell mediated immune responses of chicks following fowl adenovirus type-1 infection. Comp. Immunol. Microbiol. Infect. Dis. 14, 55–8.
11. Maiti, N.K.; Sarkar, P. (1997). Humoral immune response of chicks to different clinical isolates of avain adenovirus type-1. Comp. Immun. Microbiol. infect. Dis. 1, 59-62.
12. Nagaraja, K.V.; Patel, D.A. et al. (1982). In vitro depression of the mitogenic response of lymphocytes from turkeys infected with HE virus. Am. J. Vet. Res. 43,134–6.
13. Nakata, M.; Smyth, M.J. et al. (1990). Constitutive expression of pore-forming protein in peripheral blood gamma/delta T cells: implication for their cytotoxic role in vivo. J. Exp. Med.172, 1877-1880.
14. Pilkington, P.; Brown, T. et al. (1997). Adenovirus-induced inclusion body hepatitis in four-day–old broiler breeders. Avian Dis. 41, 472-474. 15. Reece, R.L.; Barr, D.C. et al. (1986). Observation on naturally occurring
hepatitis: inclusion body hepatitis in the chicken. Arch. Virol. 116, 33-43.
17. Sentíes-Cué, C.G.; Wills, R.W.; Stayer, P.A. et al. (2010). Epidemiology and effect on production parameters of an outbreak of inclusion body hepatitis in broilers. Avian Dis. Mar; 54(1):74-8.
18. Singh, A.; Grewal, G.S. et al. (2006). Effect of fowl adenovirus-1 (IBH isolate) on humoral and cellular immune competency of broiler chicks.
Comp. Immun. Microbiol. Infect. Dis. 29, 315–321.
19. Spits, H.; Yssel, H. et al. (1990). Analysis of antigen specificity of human TCR γδ+ T-cells. Res. Immunol. 141, 636-646.
20. Suresh, M.; Sharma, J.M. (1995). Haemorrhagic enteritis virus induced changes in the lymphocyte subpopulations in turkeys and the effect of experimental immunodeficiency on viral pathogenesis. Vet. Immonol.
Immunopathol. 45, 139–50.
21. Xian-Pu, H.; Feng-Long, W.; Yu-Fang, G.U. (1996). A Study on pathology of inclusion body hepatitis in chicken. Inner Mongolia agricultural and husbandry institute journal. 47, 37-40.
22. Tian-Bang, Y.; Xing-You, L. (1999). Foul Immunology. 10-25. Chinese Agricultural Science and Technological press, Beijing.
Creative Commons License