75 75 75 75 75 Mem Inst Oswaldo Cruz, Rio de Janeiro, Vol. 93, Suppl. I: 75-84, 1998
Different Approaches to Modelling the Cost-effectiveness of
Schistosomiasis Control
Helen Guyatt
The Wellcome Trust Centre for the Epidemiology of Infectious Disease, Department of Zoology, University of Oxford, South Parks Road, Oxford OX1 3PS, UK
This paper reviews three different approaches to modelling the cost-effectiveness of schistosomiasis control. Although these approaches vary in their assessment of costs, the major focus of the paper is on the evaluation of effectiveness. The first model presented is a static economic model which assesses effectiveness in terms of the proportion of cases cured. This model is important in highlighting that the optimal choice of chemotherapy regime depends critically on the level of budget constraint, the unit costs of screening and treatment, the rates of compliance with screening and chemotherapy and the prevalence of infection. The limitations of this approach is that it models the cost-effectiveness of only one cycle of treatment, and effectiveness reflects only the immediate impact of treatment. The second model presented is a prevalence-based dynamic model which links prevalence rates from one year to the next, and assesses effectiveness as the proportion of cases prevented. This model was important as it introduced the concept of measuring the long-term impact of control by using a transmission model which can assess reduction in infection through time, but is limited to assessing the impact only on the prevalence of infection. The third approach presented is a theoretical framework which describes the dynamic relationships between infection and morbidity, and which assesses effectiveness in terms of case-years prevented of infection and morbidity. The use of this model in assessing the cost-effectiveness of age-targeted treatment in controlling Schistosoma mansoni is explored in detail, with respect to vary-ing frequencies of treatment and the interaction between drug price and drug efficacy.
Key words:schistosomiasis - mathematical modelling - cost-effectiveness analysis - control - morbidity
The resources available for investing in con-trol programmes are limited. This necessities that consideration is given not only to the impact of a control programme, but also to the costs involved, both in terms of finances and operational require-ments. There are a number of economic evalua-tion techniques which can be used to aid the deci-sion making process in allocating scarce resources to schistosomiasis control. The techniques differ in the outcome measure assessed, and the choice of technique depends on the aims of the analysis. Cost-benefit analysis values the outcome in mon-etary terms and is concerned with the broad ques-tion of whether control of schistosomiasis is worth-while in comparison with expenditure on other projects (health or otherwise). Cost-benefit analy-sis is difficult to apply to schistosomiaanaly-sis control because of the complexities associated with
valu-ing the health benefits. Cost-effectiveness analy-sis is concerned with identifying the most efficient option for controlling schistosomiasis among a range of alternative strategies. Cost-effectiveness analysis can be used to facilitate control programme design, once it is accepted that control of schisto-somiasis is socially worthwhile.
The design of any schistosomiasis control programme involves the selection of one of a num-ber of alternative interventions or a combination of several of them: control of the snail vector, im-proved water supplies or sanitation; or chemo-therapy. Despite this diversity, most cost-effective-ness analyses have focused on strategies for deliv-ering chemotherapy, as this is generally considered to be the most cost-effective approach to control-ling schistosomiasis.
The choice of any strategy will ultimately de-pend on the cost-effectiveness ratio (cost per unit of effectiveness achieved) and existing budget con-straints. The cost-effectiveness ratio may in turn be affected by a wide variety of economic, epide-miological, demographic, technical and behavioural factors. In the design of schistosome chemotherapy programmes these factors may in-clude: compliance of the target population, drug efficacy, sensitivity of the screening test, preva-This work received financial support from the Wellcome
Trust.
Fax: +44-1865-281.245
E-mail: [email protected] Received 4 May 1998
76 76 76 76
76 Cost Effectiveness of Schistosomiasis Control Helen Guyatt
lence and intensity of infection, age-structure of the population, and the costs for screening, deliv-ery and drugs. The analytical frameworks of many cost-effectiveness studies rarely consider all these factors, yet analysis has shown that the optimal choice of strategy can be extremely sensitive to variations in these.
In this paper examples of one static model and two dynamic models to assessing the cost-effec-tiveness of schistosomiasis control will be re-viewed. These models address a number of deliv-ery issues including the target population, mass treatment versus treatment based on diagnosis (screening), variations in the frequency of drug delivery, drug efficacy and drug price. The ex-amples are theoretical, though in most cases based on empirical data on costs and representative data on epidemiological and behavioural parameters. The examples given differ in their approach to both cost and effectiveness evaluation. The choice of effectiveness measure is critical to the evaluation procedure, and is limited by the type of modelling approach employed. The limitations of static mod-els are that effectiveness measures are usually simple immediate outcomes which reflect cover-age (e.g. proportion of infected individuals treated) or both coverage and cure rate (e.g. proportion of infected individuals cured). The advantages of the dynamic models are that they can monitor changes in the parasite population over time in response to intervention, and can therefore monitor cases that were prevented because of intervention.
STATIC MODEL
Prescott (1987) developed a generalised static economic framework for investigating the optimal strategy for schistosomiasis chemotherapy. Prescott investigated the optimal treatment regime from a selection of four main strategies, variants on the target population (population or selected high-risk group) and prior diagnosis (mass or screening). His analysis demonstrated that the optimal choice of chemotherapy regime depends critically on the level of budget constraint, the unit costs of screening and treatment, the rates of com-pliance with screening and chemotherapy and the prevalence of infection. The objective of the inter-vention was to maximise the number of cases cured, and effectiveness was therefore assessed as the proportion of cases cured. The economic param-eters consisted simply of a unit cost for treatment (2.50), and a unit cost for screening (0.50). The behavioural parameters were compliance with the mass chemotherapy alone (0.90), compliance with screening (0.75) and compliance with chemo-therapy after screening (0.95). These were assumed to be identical for the population and the selected
high-risk group. The epidemiological parameters included the prevalence of infection in the popula-tion eligible for treatment (50%) and the preva-lence in the selected high-risk group (70%). The effects of the interventions were further modified by the sensitivity of the screening test (90%), and the efficacy of the drug (90%). The costs and ef-fectiveness of each approach were assessed sim-ply as linear functions of the above parameters.
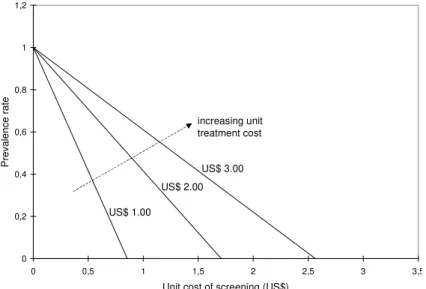
Prescott investigated the optimal choice of strat-egy with and without a budget constraint, and pre-sented decision inequalities which must be satis-fied if mass population chemotherapy is to be pre-ferred over the other three strategies. For instance, in the absence of a budget constraint, mass popu-lation treatment will produce a greater proportion of cases cured than selective population chemo-therapy if the compliance rate for mass treatment exceeds the compliance rate for screening weighted both by the sensitivity of the screening test and the compliance with treatment among screen-positives. The optimal choice of chemotherapy regime was shown to be very sensitive to the level of bud-get constraint. The regimes tarbud-geted at a selected high-risk group tended to be more effective at the lower budget levels, but less effective at higher budget levels because they quickly exhaust their inherently limited capacity to cure cases. The screening regimes tended to be less effective than their mass counterparts because at any given bud-get level the fixed cost of screening has to be over-come before residual resources can be devoted to treating screen-positives. Prescott also examined the sensitivity of the choice of strategy to varia-tions in the prevalence of infection and the unit cost of the screening test. He constructed an indif-ference line equation which defines for each unit cost per treatment, the combination of prevalence rates and screening costs for which planners would be indifferent between mass population chemo-therapy and screening population chemochemo-therapy (Fig. 1). In general, the lower the screening cost, the higher the prevalence rate required to justify mass treatment.
The analysis by Prescott (1987) models the cost-effectiveness of interventions applied for one year. Evaluation of a control programme imple-mented continuously for several years would re-quire a transmission model linking prevalence rates from one year to the next, and this considered in the next section.
DYNAMIC MODELS
77 77 77 77 77 Mem Inst Oswaldo Cruz, Rio de Janeiro, Vol. 93, Suppl. I, 1998
a seven year period. The options were mol-lusciciding, engineering methods, chemotherapy, and a combination of these approaches. Maximum output in terms of the reduction in the prevalence of infection by the end of the seven year period was achieved with a combination of chemotherapy and mollusciciding. This intervention reduced the prevalence of infection from 64% to 20% whereas the next best alternative, chemotherapy, achieved a terminal prevalence of 60%. Expressing effec-tiveness more appropriately in terms of the total number of cases prevented over this time period changed the ranking of alternatives. Chemotherapy yielded the greatest output at a cost per case pre-vented of US$1.26, followed by the combination of controls with a cost-effectiveness ratio of US$1.29 (Prescott & Warford 1985).
Rosenfield’s model was important as it intro-duced the concept of measuring the long-term im-pact of control by using a transmission model which can assess reduction in infection through time. However, the simulation relied on fitting the model to existing epidemiological data, and therefore lim-ited its applicability to other endemic settings where such data is not always available. Furthermore, such data would be expensive and require a long time frame to collect, the latter also rendering it unsuitable for health planning. The model was also prevalence-based, and thus cannot give any indi-cation of the reduction in disease. An alternative approach has been to model the impact on mor-bidity, and this is described in the next section.
Morbidity-based dynamic model - Chan et al.
(1996a, b) have developed a theoretical framework which describes the dynamic relationships between infection and morbidity for schistosomiasis. In the model, infection intensity is modelled as a con-tinuous function of age and time using a partial differential equation model. Morbidity is assessed at three levels, that due to current heavy infection, and early and late stages of chronic disease. The stages of chronic disease are modelled as a pro-gression such that early disease develops in a man-ner related to the accumulated past experience of infection and late disease develops from early dis-ease. Both types of morbidity are assumed to re-solve spontaneously, although at different rates (early chronic disease at a greater rate than late chronic disease). Acquired immunity has also been incorporated into this framework (Chan et al. 1996b).
The rest of this paper will concentrate on the use of this dynamic model in investigating the cost-effectiveness of age-targeted treatment (6-15 year olds) in the control of Schistosoma mansoni.
The model - Morbidity due to S. mansoni is divided into early chronic disease (hepatomegaly) and late chronic disease (Symmers fibrosis). Age targeted chemotherapy is simulated as an instanta-neous reduction of infection intensity in the tar-geted age groups determined by coverage and drug efficacy. There will be two effects of treatment, the reduction of infection intensity in the treated age groups due to treatment, and the reduction in the other age groups due to the overall reduction in transmission. The age-structure of the popula-Fig. 1: the trade-offs between prevalence and screening costs in comparing mass chemotherapy with selective chemotherapy at different treatment costs. Constructed from indifference line by Prescott (1987): prevalence = 1- (unit screening cost/[unit treat-ment cost * compliance rate for selective chemotherapy (0.95) * sensitivity of screening test (0.90)]).
0 0,2 0,4 0,6 0,8 1 1,2
0 0,5 1 1,5 2 2,5 3 3,5
Unit cost of screening (US$)
Prevalence rate
increasing unit treatment cost
US$ 1.00
78 78 78 78
78 Cost Effectiveness of Schistosomiasis Control Helen Guyatt
tion is based on an standard age curve for Africa (population p(a)= 0.0455.e-(0.045a), where p(a)
represents the density function or the proportion of people of age a) (Chan et al. 1995).
The inputs for the model include biological in-formation on schistosomiasis (egg production in stool and adult worm lifespan), epidemiological information on schistosomiasis transmission (ag-gregation parameters, peak age of water contact, mean intensity at peak), development and resolu-tion of disease, strength and duraresolu-tion of natural immunity, and factors related to the design of the programme (e.g. target age-group, frequency of treatment) and its effect (e.g. drug efficacy, cover-age). The inputs for the model related to biology, disease, epidemiology and immunity, and the pa-rameter values are given in Table I. Drug efficacy corresponds to the probability of worms being killed or the egg reduction rate.
Evaluating effectiveness - The outputs of the model are the prevalence of infection, prevalence of heavy infection (>250 e.p.g.), mean intensity of infection (average e.p.g.), prevalence of early ease (hepatomegaly) and prevalence of late dis-ease (fibrosis) for each age (1-80) at each year for as many years as is specified. Fig. 2 illustrates the age profile of infection and morbidity at equilib-rium (before treatment). Both infection intensity and hepatomegaly reach a peak at about age 15. Symmers fibrosis remains at low levels, reaching a peak at about 25 years. At equilibrium, the mean e.p.g. is 144.00, and prevalence of infection is 45.1%, heavy infection is 14.5%, hepatomegaly is 14.5% and fibrosis is 1.74%. To illustrate the ef-fect of treatment, let us consider the impact of treat-ing 6-15 year olds every year for five years (in the
first month of each year) with a drug of 90% effi-cacy and achieving an 80% coverage at each treat-ment cycle. Fig. 3 illustrates the changes in infec-tion and morbidity over 15 years, where levels of infection and morbidity are presented relative to the equilibrium value. The greatest impact is on the prevalence of heavy infection and the mean intensity of infection which is reduced to approxi-mately 20% of the equilibrium value at the end of the treatment programme. However, after the last treatment year, the prevalence and intensity of in-fection start to increase again, though at a lower rate than that induced by treatment. The prevalence of hepatomegaly continues to decrease for another two years, before an increase is seen. In sharp con-trast, although the prevalence of fibrosis does not decrease at such a rapid rate as the other measures of infection and morbidity, it continues to decrease over the 15 year time horizon. The observed pat-tern for fibrosis is due to the low rates of develop-ment and resolution of this condition, and to the fact that the benefit in reducing the development of fibrosis in treated children is not observed until the children become adults (Chan & Bundy 1997). The time horizon for evaluating the impact of the programme is clearly critical. If effectiveness, ex-pressed as the percentage reduction in infection and morbidity, is assessed at year 5, although this would capture the maximal effect on infection and heavy infection, it would greatly underestimate the impact on fibrosis.
The reduction in point prevalence of infection and morbidity at any time point does not capture the full effect of the treatment programme. An al-ternative, and preferred measure of effectiveness would be to look at cases-years prevented. In this
TABLE I
Parameter values used in the dynamic model for Schistosoma mansoni (Chan et al. 1995, 1996a, b)
Parameter Value
Biological Egg production in stool 5.26 epg per worm
Adult worm life span 4 years
Epidemiological Aggregation parameter (intercept) 0.132
Aggregation parameter (slope) 0.002
Peak age of water contact 15 years old
Mean e.p.g. (arithmetic) at peak 300
Disease Development rate for early disease a 0.0071
Resolution time for early diseaseb 1 year Development rate for late diseasec 0.015 Resolution time for late disease b 13 years Threshold e.p.g. for heavy infection 250
Immunity Strength of immunityd 42%
Duration of immunity b 5 years
79 79 79 79 79 Mem Inst Oswaldo Cruz, Rio de Janeiro, Vol. 93, Suppl. I, 1998
Fig. 2: age profiles of Schistosoma mansoni mean egg count and prevalence of infection and morbidity in the absence of treatment, based on the parameter values in Table I. The solid lines represent infection, and the dashed lines morbidity.
Fig. 3: the changes in infection and morbidity over time as a result of yearly treatment of 6-15 year olds for 5 years with a drug of 90% efficacy, and a coverage of 80%. Levels of infection and morbidity are presented as a proportion of the equilibrium value.
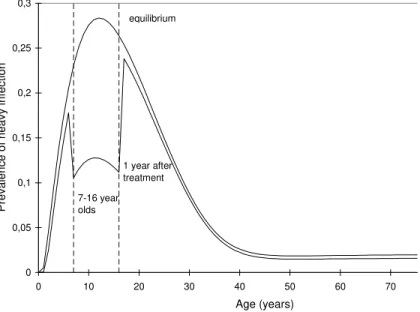
instance, effectiveness is calculated for each year as the difference between the number of cases observed and the number of cases in the absence of treatment. Fig. 4 shows the age-profile for heavy infection at equilibrium and one year after treatment. The dif-ference between these two lines represents the cases prevented. The figure also demonstrates that al-though only 6-15 years olds were treated, one year after treatment the reduction in heavy infection is observed not only in 7-16 year olds (target group is 1 year older), but also in the rest of the population. This reduction in the untreated group becomes even more evident as time goes on, and transmission lev-els are further reduced. Fig. 5 illustrates the changes
in the prevalence of heavy infection with age with five years of yearly treatment, and after five years since the last treatment. The reduction in the preva-lence of heavy infection extends well outside the age-groups which have been targeted for control. The difference between the equilibrium value and that observed in the presence of intervention is cal-culated for each year, weighted by the population size and summed over all years for which the programme is assessed to give the total number of case-years prevented.
If the total population is assumed to be 180,000 (see following section on programme framework), if there is no intervention then every year there will 0
0,2 0,4 0,6 0,8 1 1,2
0 1 2 3 4 5 6 7 8 9 10 11 12 13 14
Time since start of 5 year annual treatment programme (years)
Infection/morbidity as a proportion
of equilibrium value
fibrosis
infection
heavy infection hepatomegaly mean epg
0 0,1 0,2 0,3 0,4 0,5 0,6 0,7
0 10 20 30 40 50 60 70 80
Age (years)
Prevalence of infection/morbidity
infection
mean epg
heavy infection hepatomegaly
80 80 80 80
80 Cost Effectiveness of Schistosomiasis Control Helen Guyatt
Fig. 4: comparison of the profile of prevalence of heavy infection with age at equilibrium and 1 year after treatment of 6-15 year olds with a drug of 90% efficacy and a coverage of 80%.
Fig. 5: the profiles of prevalence of heavy infection with age at equilibrium, and with 5 years of yearly treatment of 6-15 year olds with a drug of 90% efficacy and a coverage of 80%. The dashed lines represents the levels of infection each year after each yearly treatment. The solid lines represent the levels at equilibrium and after 10 years since the first treatment.
be 105756 cases of infection, 48585 cases of heavy infection, 30341 cases of hepatomegaly and 3609 cases of fibrosis. Fig. 6 illustrates the number of case-years prevented (discounted at 5%) when the effectiveness of five annual treatments is assessed after 5 years, 10 years and 15 years. Since the treat-ment programme has an impact on infection and morbidity that extends beyond the time frame of the treatment programme, the longer the time
ho-rizon for evaluating effectiveness the greater the case-years prevented.
Programme framework- The framework for the delivery of praziquantel is based on a cost-effec-tiveness analysis of a school-targeted mass che-motherapy programme in the Kilombero District of Tanzania (Guyatt et al.1994). The programme is directed at all primary schools within the dis-trict. The drug is delivered to each school by a
0 0,05 0,1 0,15 0,2 0,25 0,3
0 10 20 30 40 50 60 70
Age (years)
Prevalence of heavy infection
equilibrium
after 10 years yearly
treatment for 5 years 0
0,05 0,1 0,15 0,2 0,25 0,3
0 10 20 30 40 50 60 70
Age (years) Prevalence of heavy infection 7-16 year olds
equilibrium
81 81 81 81 81 Mem Inst Oswaldo Cruz, Rio de Janeiro, Vol. 93, Suppl. I, 1998
mobile team consisting of a driver, a fieldworker and a Rural Medical Aid. The unit cost menu is given in Table II, all costs given in 1997 prices (Ifakara Centre, Tanzania, pers. comm.).
The total population of the district is assumed to be 180,000. Based on an standard age curve for Africa (population p(a)= 0.0455.e-(0.045a)), this
implies that 28.6% (51,480) of these are in the age-group 6-15. The number of children treated per day and the number of days taken in travelling the 1000 km to reach all schools are assumed fixed at 400 and 5 respectively. Programme coverage is the percentage of 6-15 year olds that are treated. Since not all 6-15 year olds attend school, coverage is the product of school attendance and patient
com-pliance. Provider coverage is assumed to be 100% (all schools are visited by the mobile team). Al-though patient compliance is likely to be high, school attendance may be low. In this example, coverage is fixed at 80%.
The effect of different frequencies of treatment
-The question of how often to treat is a central is-sue in the design of schistosomiasis control programmes. This analysis will consider the cost-effectiveness of different frequencies of age-tar-geted treatment (6-15 year olds) using the model and cost framework described above. In each case, the model describes the implementation of a 5 year treatment programme. Four treatment strategies are compared, treating every 6 months, yearly, 2 yearly 0
50000 100000 150000 200000 250000 300000 350000
15 10
Time since start of 5 year annual treatment programme (
Case-years prevented
infection
heavy infection
hepatomegaly
fibrosis
Fig. 6: the case-years prevented of infection, heavy infection, hepatomegaly and fibrosis at 15, 10 and 5 years since the start of the 5 year annual treatment programme of 6-15 year olds. Drug efficacy is 90% and coverage is 80%. Effectiveness at 5 years corre-sponds to case-years prevented 1 year after the last treatment.
TABLE II
Unit cost menu for the school-targeted treatment programme (costs in 1997 US$)
Input Units Unit cost Quantities Cost for one
treatment cycle
Personnel Driver per diem Per day 20 108a 2160
Driver salary Per day 15.4 108a 1663.2
Fieldworker per diem Per day 20 108a 2160
Fieldworker salary Per day 9.8 108a 1058.4
Rural Medical Aid per diem Per day 20 108a 2160 Rural Medical Aid salary Per day 9.8 108a 1058.4
Transport Vehicle rental and running costs Per km 1.00 1000 1000
Consumables Praziquantel Per dose 0.583b 41184c 24010.27
82 82 82 82
82 Cost Effectiveness of Schistosomiasis Control Helen Guyatt
and 3 yearly. This corresponds to 10, 5, 3 and 2 treatment cycles respectively. The drug efficacy is assumed to be 90%. Effectiveness is assessed as case-years prevented over a 15 year time horizon, and both costs and effectiveness are discounted at a rate of 5% (Drummond et al. 1987).
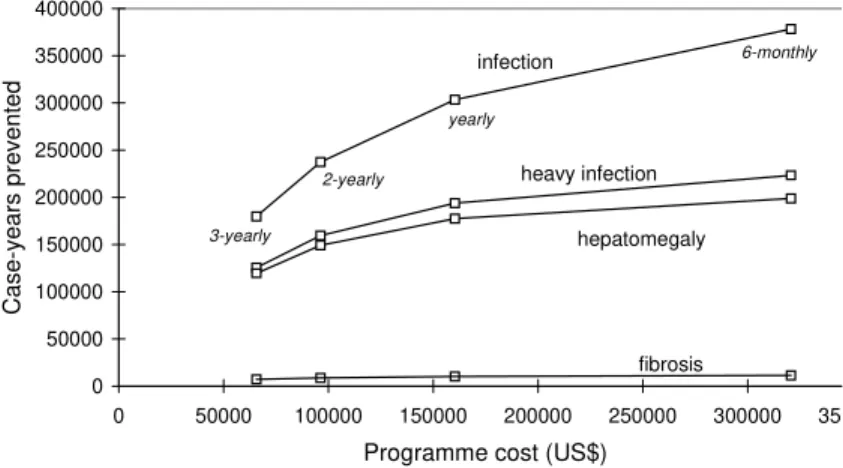
The relationship between effectiveness (case-years prevented) and total programme cost result-ing from different frequencies of treatment is il-lustrated in Fig. 7. Although the most effective option is to treat frequently (every six months), the most cost-effective option (in terms of minimising the cost-effectiveness ratio) is to treat infrequently (every three years) (see Table III). This is observed for all measures of effectiveness, although the ac-tual cost per case-year prevented varies for each measure as a result of the differences in the num-ber of case-years prevented (low for fibrosis, high for infection). Although three yearly treatment
minimises the cost-effectiveness ratio, treating every two years, at an extra cost, provides an extra gain in effectiveness. The extra cost required to achieve an extra unit gain in effectiveness, by treat-ing more frequently, is expressed in terms of in-cremental cost-effectiveness ratios, the extra cost per extra case-year prevented (Table IV). In picto-rial terms, these values can be understood by ex-amining the gradient of the line joining any of the two alternative strategies in Fig. 7. The steeper the line, the more efficient the more costly alternative, as any increase in cost returns a high increase in effectiveness. When the line becomes flatter, then a much larger investment yields only a small gain in effectiveness. As can be seen from Fig. 7, in-creasing the frequency of treatment has a greater impact on infection case-years prevented than fi-brosis case-years prevented. The incremental cost-effectiveness ratios also reveal diminishing
mar-0 50000 100000 150000 200000 250000 300000 350000 400000
0 50000 100000 150000 200000 250000 300000 350
Programme cost (US$)
Case-years prevented
infection
heavy infection
hepatomegaly
fibrosis
3-yearly
2-yearly
yearly
6-monthly
TABLE III
Cost-effectiveness ratios for different frequencies of treatment
3 years 2 years 1 year 6 months
Cost per infection case-year prevented 0.37 0.41 0.53 0.85
Cost per heavy infection case-year prevented 0.52 0.60 0.83 1.43
Cost per hepatomegaly case-year prevented 0.55 0.65 0.90 1.61
Cost per fibrosis case-year prevented 9.26 11.1 15.7 28.2
Fig. 7: the relationship between cost and case-years prevented with different frequencies of treatment. Treatment is targeted at 6-15 year olds over a 5 year period with a drug of 90% efficacy and a coverage of 80%.
TABLE IV
Incremental cost-effectiveness ratios for treating at a higher frequency
Extra cost required per extra 2 yearly vs 3 years yearly vs 2 yearly 6 months vs yearly case-year prevented (US$)
Infection 0.53 0.97 2.15
Heavy infection 0.90 1.86 5.43
Hepatomegaly 1.03 2.28 7.42
83 83 83 83 83 Mem Inst Oswaldo Cruz, Rio de Janeiro, Vol. 93, Suppl. I, 1998
ginal returns i.e., as the frequency of treatment is increased a higher cost investment is required per extra gain in effectiveness if treating more fre-quently.
Although the cost per case-year prevented is crucial in identifying cost-effective strategies, bud-get constraints and minimum effectiveness tarbud-gets are also important considerations. Budget con-straints and minimum effectiveness targets may exclude options which although may be the most cost-effective, are not affordable or do not achieve certain goals in terms of effectiveness. In the above analysis, the most cost-effective strategy is the least expensive option, but the least effective, so may be excluded as a possible strategy if it does not achieve a given effectiveness target.
Interaction between drug price and drug effi-cacy - Praziquantel is the drug of choice for schis-tosomiasis (WHO 1993). There are now a large number of producers of generic praziquantel, and these different brands vary widely in price. The purchase price can vary between US$ 0.15 to US$ 0.60 per 600mg tablet for developing countries depending on the producer, purchaser and the amount procured (Scientific Co-ordinating Centre for the Partnership for Child Development, Uni-versity of Oxford, pers. comm).Although there is some evidence that the bioavailability of these brands vary (Stierle 1994), there is no published
quantitative data on the drug efficacy, in terms of reductions in levels in infection, of the more re-cent brands on the market. In the absence of data on the relative costs and efficacies of different brands of praziquantel it is difficult to make in-formed policy decisions on their usage.
The model by Chan et al. (1996a, b) and the cost framework described above has been used to investigate the interactions between drug efficacy and drug price in the implementation of a school-targeted chemotherapy programme against S. mansoni (Guyatt & Chan 1998). The analysis dem-onstrated that the interactions between drug effi-cacy and drug price were complex, where differ-ent combinations can result in similar cost-effec-tiveness (see Fig. 8). For example, a drug with an efficacy of 50% at a cost of US$ 0.30 per dose would cost the same per case-year prevented as a drug with 90% efficacy at a cost of US$ 0.70 per dose. The most important finding was the highly non-linear relationship between cost-effectiveness and drug efficacy, with low drug efficacies pro-ducing high and variable cost-effectiveness ratios. The analysis suggests that a drug which kills less than 50% of worms is not to be recommended. This has important practical implications for the wide-spread use of praziquantel since many of the inter-national agencies procure praziquantel purely on the basis of price.
Fig. 8: the relationship between the cost per hepatomegaly case-year prevented and drug efficacy and drug price. The isoclines represent the combinations of drug efficacy and drug price which satisfy a given cost-effectiveness target. These are shown in steps of US$ 0.25 per case-year prevented, and highlighted in shaded blocks for US$ 0.00-1.00, US$ 1.00-2.00, US$ 2.00-4.00, US$ 4.00 and above. Based on analysis by Guyatt and Chan (1998), with 80% coverage.
10 20
30 40
50 60
70 80
90 0
0,1 0,2
0,3 0,4
0,5 0,6
0,7 0,8
0,9 1
0 0,250,5 0,751 1,251,5 1,752 2,252,5 2,753 3,253,5 3,754 4,254,5 4,755 5,255,5 5,756 6,256,5 6,757
Cost per hepatomegaly case-year
prevented
Drug efficacy (%)
84 84 84 84
84 Cost Effectiveness of Schistosomiasis Control Helen Guyatt
Sensitivity analysis - Sensitivity analysis of key variables is critical to undertaking a comprehen-sive cost-effectiveness analysis. The above analy-sis has demonstrated how important both drug price and drug efficacy are in affecting the cost-effec-tiveness of a treatment strategy. Other important variables would include coverage, other programme costs and levels of transmission. A full sensitivity analysis of these variables, is unfortu-nately beyond the scope of this paper, and as such the results presented here should be interpreted with caution. For instance, in the above analyses, cov-erage was fixed at 80%. A decrease in covcov-erage will reduce both the costs and the effectiveness of strategies, but not necessarily in proportion to one another. If the various frequencies of treatment were assessed at a lower coverage (60%), although the most cost-effective option remains 3-yearly treatment, the cost per case-year prevented for each strategy varies, such that for frequent treatments the cost per case-year prevented is lower at 60%, while for the less frequent treatments, they are lower at 80% coverage. At lower coverage, the incremental cost-effectiveness ratios for treating at higher frequencies are also smaller, suggesting that at lower coverages treating more frequently may be more favourable.
Composite measures of effectiveness - The above analysis considered four measures of effec-tiveness: case-years prevented for infection, heavy infection, hepatomegaly and fibrosis. Rather than considering each effectiveness measure separately, it may be more useful to consider the impact of all or some of the effectiveness measures collectively. This is clearly dependent on the objective of the control programme, with consideration of the po-tential consequences of each condition. The ob-jective may be to reduce both hepatomegaly and fibrosis (clinical morbidity) or to reduce all mor-bidity, in which case the effectiveness would also need to consider heavy infection case-years pre-vented which may result in stunting and comprised educational and cognitive abilities. Constructing a composite outcome measure based on the case-years of fibrosis, hepatomegaly, and heavy infec-tion prevented is not trivial, but evidently needs to be explored. The 1993 World Development Report (World Bank 1993) has attempted this, al-beit based on very different source data, and a re-cent analysis by Chan (1997) has used this frame-work to calculate composite measures of effective-ness for intestinal nematode infections. Clearly, some of the assumptions and methodologies used in calculating disability adjusted life years (DALYs) could be applied to explore the construc-tion of a composite effectiveness measure for the
model presented here for schistosomiasis, and this is the subject of future studies.
ACKNOWLEDGEMENTS
To Man-Suen Chan for useful discussions.
REFERENCES
Chan MS 1997. The global burden of intestinal nema-tode infections: 50 years on. Parasitol Today13: 438-443.
Chan MS, Bundy DAP 1997. Modelling the dynamic effects of community chemotherapy on patterns of morbidity due to Schistosoma mansoni. Trans R Soc Trop Med Hyg 91: 216-220.
Chan MS, Anderson RM, Medley GF, Bundy DAP 1996b. Dynamic aspects of morbidity and acquired immunity in schistosomiasis control. Acta Tropica 62: 105-117.
Chan MS, Guyatt HL, Bundy DAP, Booth M, Fulford AJC, Medley GF 1995. The development and vali-dation of an age structured model for schistosomia-sis transmission dynamics and control. Epidemiol Infect115: 325-344.
Chan MS, Guyatt HL, Bundy DAP, Medley GF 1996a. Dynamic models of schistosomiasis morbidity. Am J Trop Med Hyg55: 52-62.
Drummond MF, Stoddard TL, Torrance GW 1987. Meth-ods for the Economic Evaluation of Health Care Programmes, Oxford University Press, Oxford, 305 pp.
Guyatt HL, Chan MS 1998. An investigation into the interaction between drug efficacy and drug price of praziquantel in determining the cost-effectiveness of school-targeted treatment for Schistosoma mansoni using a population dynamic model. Trop Med Int Health 3: 425-435.
Guyatt HL, Evans D, Lengeler C, Tanner M 1994. Con-trolling schistosomiasis: the cost-effectiveness of alternative delivery strategies. Health Policy & Plan-ning9: 385-395.
Prescott NM 1987. The economics of schistosomiasis chemotherapy. Parasitol Today3: 21-25.
Prescott NM, Warford J 1985. Economic appraisal in the health sector, p. 127-145. In K Lee, A Mills (eds), The Economics of Health in Developing Countries, Oxford University Press, Oxford.
Rosenfield PL, Smith RA, Wolman MG 1977. Develop-ment and verification of a schistosomiasis transmis-sion model. Am J Trop Med Hyg26: 505-516. Stierle F 1994. Effectiveness and Costs of Integrated
Schistosomiasis Control: an Example of the Bandiagara District, Republic of Mali, MBA The-sis, School of Management and Health Economics, Keele University, 127 pp.
World Bank 1993. World Development Report: Invest-ing in Health, Oxford University Press, Oxford, 329 pp.