ISSN 0104-6632 Printed in Brazil
www.abeq.org.br/bjche
Vol. 32, No. 03, pp. 671 - 682, July - September, 2015 dx.doi.org/10.1590/0104-6632.20150323s00003444
Brazilian Journal
of Chemical
Engineering
DENSITY, REFRACTIVE INDEX, APPARENT
VOLUMES AND EXCESS MOLAR VOLUMES
OF FOUR PROTIC IONIC LIQUIDS + WATER
AT T=298.15 AND 323.15 K
R. Rocha Pinto
1*, D. Santos
2, S. Mattedi
2and M. Aznar
1g1
School of Chemical Engineering, University of Campinas (UNICAMP), Av. Albert Einstein 500, Cidade Universitária, 13083-852, Campinas - SP, Brazil.
Phone: + (55) (19) 3521-3962 E-mail: [email protected]
2
Department of Chemical Engineering, Federal University of Bahia (UFBA), R. Aristides Novis 2, Federação, 40210-630, Salvador - BA, Brazil.
Phone: + (55) (71) 3282-9801
(Submitted: April 14, 2014 ; Revised: October 30, 2014 ; Accepted: December 15, 2014)
Abstract - Densities and refractive index of binay mixtures of water with four protic ionic liquids, based on ammonium and fatty acids, were measured at 298.15 and 323.15 K, under atmospheric pressure. Apparent and excess molar volumes were obtained by experiments and fitting data to the Meyer (RM), Redlich-Kister (RK) and Prigogine-Flory–Patterson (PFP) equations. The molar volume values were high, suggesting strong ion-solvent interaction. The same interaction also became stronger as the temperature increased. Excess volume values were negative, indicating that packing efficiency ability or attractive interactions occurred in mixtures of ionic liquid + water. The errors (AARD) for the properties in excess were in the range of 1.8% to 7.2%. The PFP error for the apparent volume was in the range of 0.34% to 0.06%, lower than the RM error for the same property, which was in the range of 0.70 to 1.55%. The Gladstone-Dale model was applied to correlate the refractive index of the binary mixture with the density from the values of both pure components.
Keyword: Protic ionic liquid; Water; Properties of mixtures.
INTRODUCTION
Room temperature ionic liquids form a class of organic salts that are normally liquids at tempera-tures below 373.15 K. They are also called designer solvents due the huge range of possible combinations of organic cations and organic or inorganic anions. This new class of materials has attracted interest as substitutes to traditional solvents due to their poten-tial applications and low vapor pressure (Iglesias et al., 2010; Alvarez et al., 2010a; Taib et al., 2012).
Ionic liquids based on the imidazolium cation are the most studied and their applications are much
672 R. Rocha Pinto, D. Santos, S. Mattedi and M. Aznar
composition. Besides, ionic liquids present a high hygroscopic characteristic, demonstrating the neces-sity to study their behavior and thermophysical prop-erties when mixed with water.
Volume changes observed in real systems are the result of changes in solution packing of the solution and intermolecular interactions in the system. Vol-ume changes of mixtures can be used as a parameter to assess how a particular system deviates from ide-ality at constant temperature and pressure. The con-cept of partial molar property is very important in the study of solutions, since it reflects the variation of a particular property with the composition. A partial molar quantity is the contribution (per mole) that the substance makes to some mixture property. Compo-sition variations lead to changes in the thermody-namic properties of mixtures (Patil et al., 2011). Thus, in order to develop ionic liquids applications, it is essential to determine their physico-chemical proper-ties, both as pure materials and their mixtures with traditional solvents.
In this context, the objective of this work was to synthesize four protic ionic liquids, varying the anion (butyric, pentanoic and hexanoic acid) and the cation (monoethanolamine and diethanolamine), forming hydroxy ethylammonium butanoate (HEAB), hydroxy ethylammonium pentanoate (HEAP), 2-hydroxy ethylammonium hexanoate (2-HEAH), and 2-hydroxy diethylammonium hexanoate (2-HDEAH). The refractive index and density of binary mixtures (2-HEAB + water, 2-HEAP + water, 2- HEAH + water and 2- HDEAH + water) were determined at 298.15 K and 323.15 K and atmospheric pressure. From the den-sities of binary mixtures the apparent molar volume
,1
Vφ ; the excess molar volume VmE; and the limiting
apparent molar volume 0
Vφ were also determined.
The excess functions are used to explain intermo-lecular interactions in these binary mixtures.
EXPERIMENTAL PROCEDURE
Materials
The reagents, monoethanolamine, diethanolamine, butanoic acid, pentanoic acid and hexanoic acid, obtained from Sigma-Aldrich, with 99% purity by mass, were used to prepare 2-hydroxy nium butanoate (2-HEAB), 2-hydroxy nium pentanoate (2-HEAP), 2-hydroxy ethylammo-nium hexanoate (2-HEAH) and 2-hydroxy diethyl-ammonium hexanoate (2-HDEAH). They were pro-duced in our laboratory, without the use of additional solvents, according to standard methods developed
and reported in the literature (Bicak, 2004; Cota et al., 2007; Alvarez et al., 2010a). The protic ionic liquid synthesis method consists of treating the acid in a glass flask under magnetic stirring with base added dropwise, at aproximately 5 drops per minute. Stirring was continued for 24 h at room temperature to guarantee complete reaction. The reaction of for-mation of protic ionic liquids is an acid–base neu-tralization, producing an ester and a salt of ethanola-mine. This reaction is very exothermic, so an ice bath system was used. Before each determination, the ionic liquid was purified. The purification proc-ess consists of strong agitation and slight heating, at 323.15K, for the vaporization of impurities (residual non-reacted reagents and water) under a vacuum of 20 kPa. In order to achieve humidity values below 0.1%, the liquids were submitted to this purification process for approximately 9 hours. After 6 months storage, the ionic liquids presented humidity values of nearly 10%. The humidity was verified using a volumetric Karl Fischer Titrator DL31 (Mettler Toledo). No crystallization or solidification were observed when the liquid samples were stored at 298.15 K for 6 months, and the liquids had an ap-pearance of limpid liquid, viscous and the colors ranging from orange to yellow.
The salt formation was confirmed by the FT-IR spectrum, determined by using a Shimadzu IR Pres-tige 21, using a KBr disk (Cota et al., 2007; Iglesias
et al., 2008; Alvarez et al., 2010a). Distilled water was used for the calibration of the density and refrac-tive index instruments. Water contents in the ionic liquids were determined by a coulometric Karl Fischer titrator DL 31 (Mettler Toledo), using the CombiTitrant 5 reagent (Merck KGaA). The titra-tions were made in triplicate and the water content in the pure ionic liquids was less than 0.1%. The solutions were prepared by weight with a precision balance (Shimadzu model AX 200, accuracy to 0.001 g). The properties of chemicals used are listed in Table 1.
Refractive Index and Density Measurements
Density, Refractive Index, Apparent Volumes and Excess Molar Volumes of Four Protic Ionic Liquids + Water at T=298.15 and 323.15 K 673
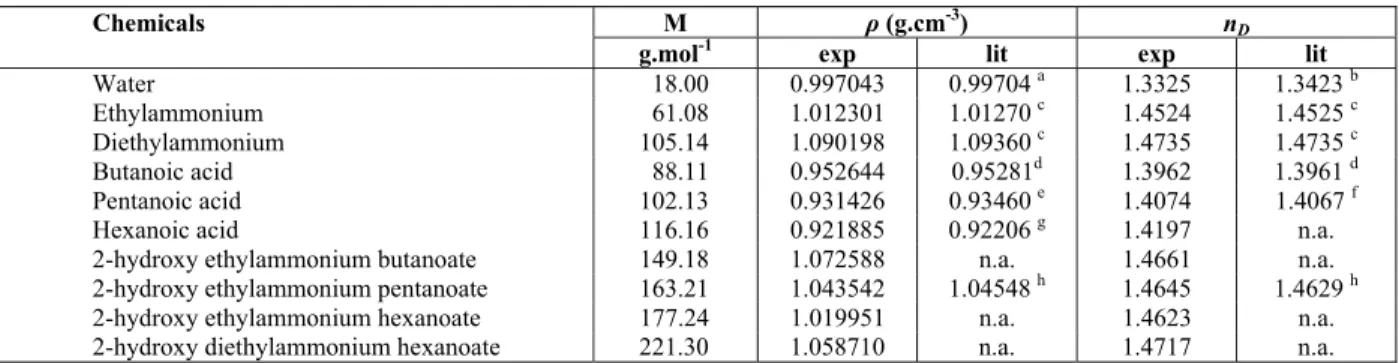
Table 1: Properties of components at 298.15 K.
Chemicals M ρ (g.cm-3) nD
g.mol-1 exp lit exp lit
Water 18.00 0.997043 0.99704 a 1.3325 1.3423 b Ethylammonium 61.08 1.012301 1.01270 c 1.4524 1.4525 c
Diethylammonium 105.14 1.090198 1.09360 c 1.4735 1.4735 c Butanoic acid 88.11 0.952644 0.95281d 1.3962 1.3961 d
Pentanoic acid 102.13 0.931426 0.93460 e 1.4074 1.4067 f Hexanoic acid 116.16 0.921885 0.92206 g 1.4197 n.a. 2-hydroxy ethylammonium butanoate 149.18 1.072588 n.a. 1.4661 n.a. 2-hydroxy ethylammonium pentanoate 163.21 1.043542 1.04548 h 1.4645 1.4629 h 2-hydroxy ethylammonium hexanoate 177.24 1.019951 n.a. 1.4623 n.a. 2-hydroxy diethylammonium hexanoate 221.30 1.058710 n.a. 1.4717 n.a.
a
Reference (Iglesias et al., 2010). b
Reference (Thormahlen et al., 1985). c
Reference (Murrleta-Guevara and Rodriguez, 1984).
d
Reference (Bahadur et al., 2013). e
Reference (Latcher, 2002). f
Reference (Rubio et al., 2005). g
Reference (Liao et al., 2012).
h
Reference (Iglesias et al., 2008).
Densities of all binary mixtures were measured using an Anton Paar oscillating U-tube density meter (DMA 5000) with a measuring precision of ± 5 × 10⁻⁶ g.cm-3 at 298.15 and 323.15 K. The apparatus was calibrated frequently, by measuring the density of distilled water. The distilled water showed a density of 0.998201 g.cm-3 at 293.15 K, being close to the literature value (Patil et al., 2011; Kapadi et al., 2002). This apparatus yields precise results within 1 × 10⁻⁵ g.cm−3. The uncertainty of density measure-ments was found to be better than ± 7 × 10⁻⁶ g.cm−3 for measuremnets at 298.15 K and ± 1 × 10⁻⁵ g.cm−3 for measurements at 323.15 K. Sample volumes used in each density determination were ca. 1.5 ml.
The refractive indices of binary mixtures (2-hy-droxy ethylammonium butanoate + water; 2-hy(2-hy-droxy ethylammonium pentanoate + water; 2-hydroxy ethyl-ammonium hexanoate + water and 2-hydroxy diethyl-ammonium hexanoate + water) were measured using a Mettler Toledo RE 40D digital refractometer, with a measuring precision of ± 1 × 10⁻⁴, at 298.15 and 323.15 K. The equipament was calibrated by meas-uring the refractive index of air and distilled water. The uncertainty of refractive index measurements was found to be better than ± 2 × 10⁻⁵ at 298.15 K and ± 1 × 10⁻⁴ at 323.15 K. Sample volumes used in each refractive index determination were ca. 0.2 ml.
RESULTS AND DISCUSSION
FT-IR Spectroscopy
The results of the FT-IR analyses were very simi-lar for the four ionic liquids, showing the same broad bands, as can be seen in Figure 1. In special, two bands should be observed to analyze an ammonium salt formation. One band must be in the 3200–2400 cm−1
range, implying the typical ammonium structure. The OH stretching vibration is embedded in this band. The other important band to verify is the band cen-tered at 1600 cm−1. This is a combined band of the carbonyl stretching and N–H in-plane bending vibra-tions. Both bands described above can be observed in Figure 1. Similar behaviors are presented in other works (Iglesias et al., 2010; Cota et al., 2007; Iglesias
et al., 2008; Alvarez et al., 2010b).
Figure 1: FT-IR spectra for HEAB, HEAP, 2-HEAH and 2-HDEAH.
Density and Refractive Index
Experimental data of the density ρ and refractive index nD for binary systems (ionic liquid + water) at
674 R. Rocha Pinto, D. Santos, S. Mattedi and M. Aznar
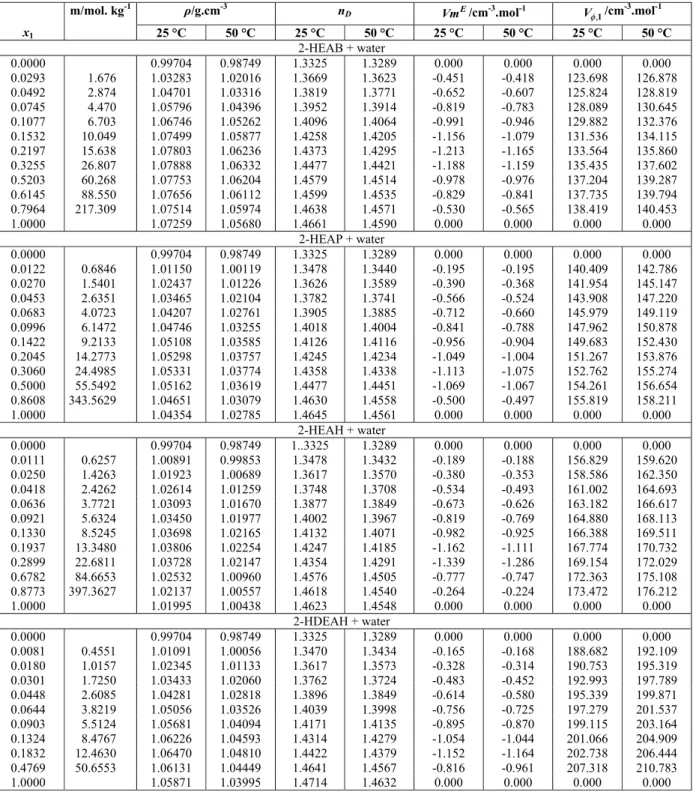
Table 2: Mole fraction, x1, molality, m, experimental density, ρ, refractive index, nD, Excess Molar Volumes, E
Vm ,and Apparent molar Volumes, Vφ,1 of ionic liquids (1) + water (2).
m/mol. kg-1 ρ/g.cm-3 nD VmE/cm-3.mol-1 Vφ,1/cm
-3.mol-1
x1 25 °C 50 °C 25 °C 50 °C 25 °C 50 °C 25 °C 50 °C
2-HEAB + water
0.0000 0.99704 0.98749 1.3325 1.3289 0.000 0.000 0.000 0.000 0.0293 1.676 1.03283 1.02016 1.3669 1.3623 -0.451 -0.418 123.698 126.878 0.0492 2.874 1.04701 1.03316 1.3819 1.3771 -0.652 -0.607 125.824 128.819 0.0745 4.470 1.05796 1.04396 1.3952 1.3914 -0.819 -0.783 128.089 130.645 0.1077 6.703 1.06746 1.05262 1.4096 1.4064 -0.991 -0.946 129.882 132.376 0.1532 10.049 1.07499 1.05877 1.4258 1.4205 -1.156 -1.079 131.536 134.115 0.2197 15.638 1.07803 1.06236 1.4373 1.4295 -1.213 -1.165 133.564 135.860 0.3255 26.807 1.07888 1.06332 1.4477 1.4421 -1.188 -1.159 135.435 137.602 0.5203 60.268 1.07753 1.06204 1.4579 1.4514 -0.978 -0.976 137.204 139.287 0.6145 88.550 1.07656 1.06112 1.4599 1.4535 -0.829 -0.841 137.735 139.794 0.7964 217.309 1.07514 1.05974 1.4638 1.4571 -0.530 -0.565 138.419 140.453 1.0000 1.07259 1.05680 1.4661 1.4590 0.000 0.000 0.000 0.000
2-HEAP + water
0.0000 0.99704 0.98749 1.3325 1.3289 0.000 0.000 0.000 0.000 0.0122 0.6846 1.01150 1.00119 1.3478 1.3440 -0.195 -0.195 140.409 142.786 0.0270 1.5401 1.02437 1.01226 1.3626 1.3589 -0.390 -0.368 141.954 145.147 0.0453 2.6351 1.03465 1.02104 1.3782 1.3741 -0.566 -0.524 143.908 147.220 0.0683 4.0723 1.04207 1.02761 1.3905 1.3885 -0.712 -0.660 145.979 149.119 0.0996 6.1472 1.04746 1.03255 1.4018 1.4004 -0.841 -0.788 147.962 150.878 0.1422 9.2133 1.05108 1.03585 1.4126 1.4116 -0.956 -0.904 149.683 152.430 0.2045 14.2773 1.05298 1.03757 1.4245 1.4234 -1.049 -1.004 151.267 153.876 0.3060 24.4985 1.05331 1.03774 1.4358 1.4338 -1.113 -1.075 152.762 155.274 0.5000 55.5492 1.05162 1.03619 1.4477 1.4451 -1.069 -1.067 154.261 156.654 0.8608 343.5629 1.04651 1.03079 1.4630 1.4558 -0.500 -0.497 155.819 158.211 1.0000 1.04354 1.02785 1.4645 1.4561 0.000 0.000 0.000 0.000
2-HEAH + water
0.0000 0.99704 0.98749 1..3325 1.3289 0.000 0.000 0.000 0.000 0.0111 0.6257 1.00891 0.99853 1.3478 1.3432 -0.189 -0.188 156.829 159.620 0.0250 1.4263 1.01923 1.00689 1.3617 1.3570 -0.380 -0.353 158.586 162.350 0.0418 2.4262 1.02614 1.01259 1.3748 1.3708 -0.534 -0.493 161.002 164.693 0.0636 3.7721 1.03093 1.01670 1.3877 1.3849 -0.673 -0.626 163.182 166.617 0.0921 5.6324 1.03450 1.01977 1.4002 1.3967 -0.819 -0.769 164.880 168.113 0.1330 8.5245 1.03698 1.02165 1.4132 1.4071 -0.982 -0.925 166.388 169.511 0.1937 13.3480 1.03806 1.02254 1.4247 1.4185 -1.162 -1.111 167.774 170.732 0.2899 22.6811 1.03728 1.02147 1.4354 1.4291 -1.339 -1.286 169.154 172.029 0.6782 84.6653 1.02532 1.00960 1.4576 1.4505 -0.777 -0.747 172.363 175.108 0.8773 397.3627 1.02137 1.00557 1.4618 1.4540 -0.264 -0.224 173.472 176.212 1.0000 1.01995 1.00438 1.4623 1.4548 0.000 0.000 0.000 0.000
2-HDEAH + water
0.0000 0.99704 0.98749 1.3325 1.3289 0.000 0.000 0.000 0.000 0.0081 0.4551 1.01091 1.00056 1.3470 1.3434 -0.165 -0.168 188.682 192.109 0.0180 1.0157 1.02345 1.01133 1.3617 1.3573 -0.328 -0.314 190.753 195.319 0.0301 1.7250 1.03433 1.02060 1.3762 1.3724 -0.483 -0.452 192.993 197.789 0.0448 2.6085 1.04281 1.02818 1.3896 1.3849 -0.614 -0.580 195.339 199.871 0.0644 3.8219 1.05056 1.03526 1.4039 1.3998 -0.756 -0.725 197.279 201.537 0.0903 5.5124 1.05681 1.04094 1.4171 1.4135 -0.895 -0.870 199.115 203.164 0.1324 8.4767 1.06226 1.04593 1.4314 1.4279 -1.054 -1.044 201.066 204.909 0.1832 12.4630 1.06470 1.04810 1.4422 1.4379 -1.152 -1.164 202.738 206.444 0.4769 50.6553 1.06131 1.04449 1.4641 1.4567 -0.816 -0.961 207.318 210.783 1.0000 1.05871 1.03995 1.4714 1.4632 0.000 0.000 0.000 0.000
2-HEAH and 2-HDEAH, respectively. After these maximum values, the density starts to decrease, which can be observed more clearly for the hexa-noate ionic liquids. The increase in density is
Density, Refractive Index, Apparent Volumes and Excess Molar Volumes of Four Protic Ionic Liquids + Water at T=298.15 and 323.15 K 675
show that the density values of the mixtures follow the order: 2-HEAB > 2-HDEAH > 2-HEAP > 2-HEAH, which indicates that the shorter alkyl chain of the cation is much denser than the lower alkyl chain (for example 1.072588 g.cm-3 for 2-HEAB and 1.058710 g.cm-3 for 2-HDEAH). This is due to the increase in dispersive interactions in ionic liquids with the in-crease in the chain length, resulting in a nano-struc-tural organization in polar and nonpolar regions. As can be seen in Table 2, the hexanoate ionic liquids display significantly lower density values than the other ionic liquids (2-HEAB and 2-HEAP) due to the increased molecular mass of the anion. The tempera-ture change did not lead to a significant behavior modification. Further analysis of Table 2 shows that the density decreases with increasing anion alkyl chain length (butanoate to hexanoate) and increases with decreasing cation alkyl chain length (diethylam-monium to ethylam(diethylam-monium).
The experimental refractive index values for bi-nary mixtures of ionic liquid + water are presented as function of ionic liquid mole fraction in Table 2, at 298.15 and 323.15 K. Differently from the density, the refractive indexvalues increase with increasing com-position of ionic liquid in the whole range studied. For the studied mixtures, the refractive index values followed the sequence HDEAH > HEAB > 2-HEAP > 2-HEAH. This order shows that hexanoate anion is present in the first and last positions, so this property seems to be more influenced by the cation. The highest refractive indexvalues are due to the ion arrangement and the efficient packing of ions in the ionic liquids.
The refractive index values for binary mixtures of ionic liquids were also calculated using the Glad-stone-Dale model (Rilo et al., 2012), Equation (1):
1 1 2 2
D
n =φn +φ n (1)
where φ1 and φ2 are the ionic liquid and water vol-ume fractions, respectively, defined as:
1 1 2 1
1 1 2 2 2 1
x M x M x M
ρ φ
ρ ρ
=
+ (2)
2 2 1 2
1 1 2 2 2 1
x M x M x M
ρ
φ = ρ ρ
+ (3)
For better investigation on the correlative capabil-ity of the proposed model the average absolute rela-tive deviation (AARD%) and average relarela-tive devia-tion (ARD%) were verified, Equadevia-tions (4) and (5).
exp exp 1 100 % n calc i Y Y AARD
n = Y
−
=
∑
(4)exp exp 1 100 % n calc i Y Y ARD n Y = ⎛ − ⎞ = ⎜⎜ ⎟⎟ ⎝ ⎠
∑
(5)where Y and n represent the property studied and the number of experimental data, espectively. As ob-served ion Table 3, calculated and experimental de-viation values are very small for both temperature, increasing with temperature.
Table 3: Standard deviation from Equation (4), obtained by using the Gladstone-Dale model to reproduce values of the refractive index. T is tem-perature 298.15, 323.15 K.
System T/K AARD% ARD%
1 2-HEAB + water 298.15 0.562 0.562 2 2-HEAB + water 323.15 0.575 0.575 3 2-HEAP + water 298.15 0.153 0.147 4 2-HEAP + water 323.15 0.170 0.167 5 2-HEAH + water 298.15 0.431 0.431 6 2-HEAH + water 323.15 0.499 0.499 7 2-HDEAH + water 298.15 0.205 0.154 8 2-HDEAH + water 323.15 0.342 0.342 *Absolute Relative Deviation (AARD%) and Average Relative
Deviation (ARD%).
Apparent Molar Volumes
The densities in Table 2 were used to calculate the apparent molar volumes using Equation (6):
1 2 ,1 2 1000 M V m
φ = ρ + ⎛⎜ρ ρρρ− ⎞⎟
⎝ ⎠ (6)
where ρand ρ2 are the densities (g.cm-3) of the
solu-tions and water, respectively, M1 is the molar mass of
the ionic liquid, and m is the molality (mol.kg-1) of the ionic liquid + water solution.
676 R. Rocha Pinto, D. Santos, S. Mattedi and M. Aznar
The limiting apparent molar volume, Vφ,1, is the limiting volume that a substance occupies in one mole of other substance. In this limit, ions are sur-rounded only by the solvent, being infinitely distant from the other ions, and are unaffected by interaction among ions, so this is a pure measurement of the ion + solvent interaction (Wang et al., 2009; Patil et al., 2011). The apparent molar volume is calculated by fitting Equation (6), and fitted, as function of mo-lality, to the Redlich-Meyer polynomial, Equation (7) (Alvarez et al., 2010b; De Oliveira et al., 2011):
0
,1 v V
Vφ =Vφ +S m+B m (7)
The slope, Sv, indicates the ion-ion interactions.
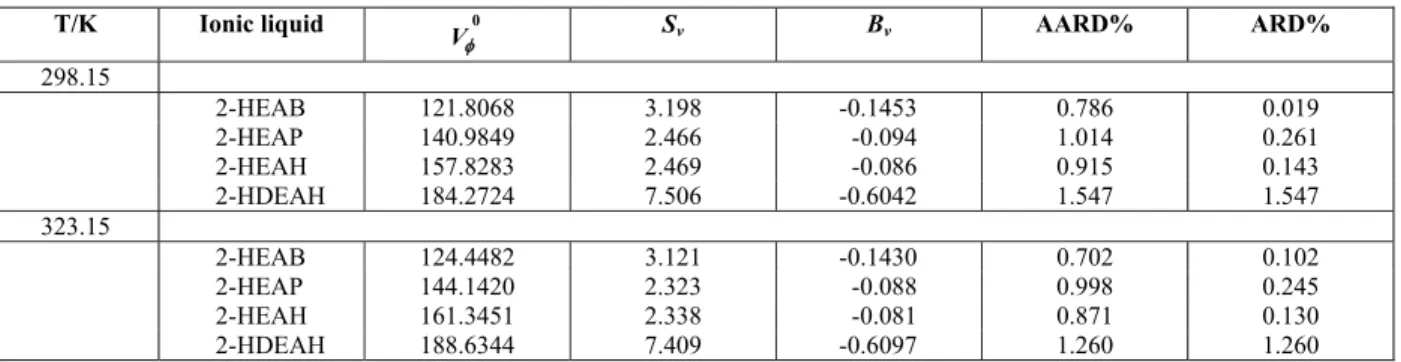
For all systems at both temperatures, these parame-ters are positive, suggesting strong interactions be-tween ion-solvent and ion-ion for the studied systems. The parameters of Equation (7), Vφ0, Sv and Bv and
the average absolute relative deviation (AARD%) and average relative deviation (ARD%), defined by Equa-tions (4) and (5), are presented in Table 4. The aver-age relative deviation between the experimental and calculated value for all data points was less than 1.55%.
By observing the data of Table 4 it is possible to note that Vφ0 increases and Sv decreases as
tempera-ture increases. This indicates an increase in ion-sol-vent interactions and a decrease in ion-ion interac-tions with temperature.
Excess Molar Volumes
The excess molar volumes VmE are the sum of
chemical, physical and structural effects of a mix-ture. Chemical interactions result in volume contrac-tion, which include the charge transfer forces, form-ing or breakform-ing complex forms of interaction. The contribution of the geometric adjustment is due to differences in molar volume and free volume be-tween the components, giving a negative contribu-tion to VmE.
The excess molar volumes VmEfor binary sys-tems were calculated according to Equation (8), and the resulting values are presented in Table 2.
1 1 2 2 1 1 2 2
1 2
E x M x M x M x M
Vm
ρ+ ρ ρ
= − − (8)
where x1, ρ1, and M1 are the mole fraction, density,
and molar masses of the pure ionic liquid, respec-tively, and x2, ρ2, and M2 are the mole fraction,
den-sity, and molar masses of the water, respectively. The data for excess molar volume were correlated by the Redlich-Kister equation (Fan et al. 2008; Fan
et al., 2009; Kurnia and Mutalib, 2011; Patil et al., 2011).
1 2 ( 1 2)
E k
k
Vm =x x ΣA x −x (9)
where the coefficients Ak are parameters that were
obtained by fitting the Redlich-Kister equation to the experimental values. The correlated results for ex-cess volume are presented in Table 5, together with the average absolute relative deviation (AARD%) and average relative deviation (ARD%), defined by Equations (4) and (5). The average relative deviation between the experimental and calculated values for all data points was less than 6.81%.
Table 4: Coefficients of the Redlich-Meyer Equation for apparent molar volumes of ionic liquid + water at 298.15 and 323.15 K and AARD%. and ARD% as described below.
T/K Ionic liquid 0
φ
V Sv Bv AARD% ARD%
298.15 2-HEAB 121.8068 3.198 -0.1453 0.786 0.019 2-HEAP 140.9849 2.466 -0.094 1.014 0.261 2-HEAH 157.8283 2.469 -0.086 0.915 0.143 2-HDEAH 184.2724 7.506 -0.6042 1.547 1.547 323.15
Density, Refractive Index, Apparent Volumes and Excess Molar Volumes of Four Protic Ionic Liquids + Water at T=298.15 and 323.15 K 677
Table 5: Coefficients of the Redlich-Kister equation for VmEof ionic liquid + water at 298.15 and 323.15 K and AARD%. and ARD% as described below.
T/K A0 A1 A2 A3 A4 AARD% ARD%
298.15 2-HEAB -4.0130 2.5472 -2.1989 2.4546 -5.3203 1.945 0.286 2-HEAP -4.3775 1.7602 1.5687 1.7891 -9.5728 2.684 1.054 2-HEAH -5.1069 5.0288 5.2552 -1.4576 -11.6124 6.253 3.303 2-HDEAH -6.014 -72.909 -311.064 -440.245 -217.322 1.072 0.525 323.15
2-HEAB -4.0298 2.1380 -2.0568 2.3012 -5.0591 1.815 -0.041 2-HEAP -4.4418 0.4555 0.5144 4.0960 -6.0846 3.932 2.122 2-HEAH -4.9917 4.9697 5.5745 -1.5412 -11.1148 6.813 3.578 2-HDEAH -6.984 -82.592 -340.987 -474.130 -228.818 1.766 1.107 *Absolute Relative Deviation (AARD%) and Average Relative Deviation (ARD%).
Figures 2 and 3, which depict the VmEplot of bi-nary mixtures ionic liquids + water, show that the values are negative over a wide mole fraction range at 298.15 and 323.15 K under atmospheric pressure. The curves are asymmetric, with a U-shape for
2-HEAB and 2-HEAP and a V-shape for 2-HEAH and
2-HDEAH. The negative contribution arises from changes of the free volume in the real mixtures, com-prising ions and water molecules; such behavior might arise from restriction of rotational motion, when the water molecules are accommodated inter-stitially within the ions.
Looking at the data in Figures 2 and 3, it is clear that the magnitude of the negative VmEvalues has a minimum at the mole fraction of ionic liquid ≈ 0.300 or ≈ 0.290 or ≈ 0.220 or ≈ 0.183 for HEAP or 2-HEAH or 2-HEAB or 2-HDEAH, respectively. This
indicates that the highest capacity packing occurs in these regions. This behavior can be attributed to the effect of packing and ion-dipole interactions of ionic liquids with water. Also from Figure 2, it can be noted that the magnitude of the VmE values showed the following trend at both temperatures, 298.15 and 323.15 K: HEAH > HEAB > HDEAH > 2-HEAP. From this order it appears that the VmE mag-nitude is affected both by the cation and anion. The region of packing capacity decreased with the in-crease in the carbon chain length when the base is the same (2-HEAB > 2-HEAP) and when the acid is the same (2-HEAH > 2-HDEAH). Both changes make the VmE magnitude decrease with increasing alkyl chain length of the ionic liquid. Relative to the mag-nitude of VmEvalues, these values are quite close, with a low variation.
Figure 2: Plot of excess molar volumes against ionic liquid mole fraction (x1) for 2-HEAB + wa-ter at T = 298.15 K (symbols) and T = 323.15 K; (line by models).
Figure 3: Plot of excess molar volumes against ionic liquid mole fraction (x1) for 2-HEAP +
678 R. Rocha Pinto, D. Santos, S. Mattedi and M. Aznar
Prigogine-Flory-Patterson
The mixture density data, apparent molar vol-umes and excess molar volvol-umes were modeled by the Prigogine-Flory-Patterson (PFP) theory (Prigogine, 1953; Prigogine, 1957; Flory and Orwoll, 1964a,b; Flory, 1965; Flory and Abe, 1965; Orwoll and Flory, 1967; Patterson, 1970; Costas and Patterson, 1982). This theory was extensively used to represent excess molar volume and enthalpy for various non-electro-lytic liquid mixtures. According to the PFP theory, the excess molar volume VmE is divided into three contributions: (i) interactional, which is proportional to an empirical parameter, χ12, called cross parameter, (ii) the free volume contribution, which arises from the dependence of the reduced volume on the re-duced temperature as a result of the difference be-tween the degree of expansion of the two components and (iii) the P* contribution, which depends both on the differences of internal pressures and differences of reduced volumes of the components. PFP theory leads to the following expression for VmE in terms of the three contributions:
inter free vol *
E E E E
P
Vm =Vm +Vm +Vm (10)
(
)
(
)
1 2 3 3
1 2 12
* * 1
1 1 2 2 3 *
1
1 2
3
1 2 1 2
1 3
* * 1 2 1 2 1 2
* *
1 2 2 1
( 1) Ψ
4
1 3
14
1 Ψ Ψ
9
4
1 3
( )( )Ψ Ψ
Ψ Ψ
E
Vm V V
x V x V
V P
V V V
V V
V V P P
P P θ χ − − − − = ⎛ ⎞ + ⎛ ⎞ ⎜⎜ ⎟ − ⎟ ⎜⎝ ⎠ ⎟ ⎝ ⎠ ⎛⎛ ⎞ ⎞ ⎜ ⎟ − ⎜⎜ ⎟ − ⎟ ⎝ ⎠ ⎝ ⎠ − ⎛⎛ ⎞ ⎞ ⎜⎜ ⎟ − ⎟ ⎜⎝ ⎠ ⎟ ⎝ ⎠ − − + +
The Vof the solution is obtained through Flory’s theory. The characteristic parameters Vi*and Pi* are obtained from the thermal expansion coefficient, αi, and the isothermal compressibility, βT. The thermal expansion coefficient is used to evaluate the reduced volume by the equation:
1 1 2 2
V = Ψ + ΨV V (11)
(
)
3 4 1 3 1 i i iT V T α α ⎛ ⎞ ⎛ + ⎜ ⎟⎛ ⎞ ⎞ ⎜ ⎟ ⎜ ⎟ =⎜ ⎟ ⎜ ⎟ ⎝ ⎠ ⎜⎝ ⎠ ⎟ ⎝ ⎠ + (12) 2 ~ * i i iT T V
P α
β
= (13)
Here, the molecular contact energy fraction is evaluated by:
* 1 1
1 * *
1 1 2 2
2 1
Ψ Ψ P
P P
ϕ
ϕ ϕ
⎛ ⎞
= − = ⎜⎜ ⎟⎟
⎝ + ⎠ (14)
With the hard-core volume fractions defined by:
* 1 1
1 *
2
2 *
1 1 2
( )
1 x V
x V x V
φ φ
+
= − = (15)
The values of the thermal expansion coefficient,
i
α , the isothermal compressibility, βT, as well as the interaction parameter, χ12, were estimated using the experimental data.
The surface fractions are given by:
* 1 1 1
2
1 2
* 1 *
1 1 2 2 2 1 S x V S S
x V x V
S θ θ ⎛ ⎞ ⎜ ⎟ ⎝ ⎠ = − = ⎛ ⎞ + ⎜ ⎟ ⎝ ⎠ (16)
in which the ratio of the surface contact sites per segment is given by
1/3 * 1 1 * 2 2 S V S V − ⎛ ⎞ = ⎜⎜ ⎟⎟
⎝ ⎠ (17)
Density, Refractive Index, Apparent Volumes and Excess Molar Volumes of Four Protic Ionic Liquids + Water at T=298.15 and 323.15 K 679
problems that involve a huge search space, and they tend to find local optimum points rather than the global optimum points. In addition, quasi-lineariza-tion methods and data-smoothing methods are also often used to solve parameter estimation problems (Yildirim et al. 2003).
The objective function used was a least-square objective function, as presented in Equation (18), considering deviations in the prediction of the excess volume.
(
)
exp
2 exp
1
N
calc
i
Fobj y y
=
⎛ ⎞
= ⎜ − ⎟
⎝ ⎠
∑
(18)Particle swarm optimization (PSO), developed by Kennedy and Eberhart (1995), is a stochastic global
optimization technique inspired by social behavior of bird flocking or fish schooling. In the PSO, each particle in the swarm adjusts its position in the search space based on the best position it has found so far, as well as the position of the known best fit particle of the entire swarm, and finally converges to the global minimum of the whole search space. It should be mentioned that the objective function through the trial and error method was the average absolute relative deviation (AARD) combined with other statistical error analysis parameters, including the average relative deviation (ARD), for better investigation of the correlative capability of the proposed model (Schwaa and Pinto, 2007):
The estimated parameters for the PFP model are presented in Table 6 and the relative deviations are shown in Table 7.
Table 6: Estimated parameters αi( K
-1
),βT(MPa
-1
), χ12 (J·cm
-3
) for the PFP model and Vm (cm3.mol−1) molar volume of ionic liquid from experimental data.
System T/K 103αi 103βT
12
χ Vm
1 2-HEAB + water 298.15 1.92 2.92 -10.44 139.08 2 2-HEAB + water 323.15 1.78 2.58 -20.64 141.16 3 2-HDEAH + water 298.15 1.11 2.05 20.78 212.07
4 2-HDEAH + water 323.15 1.11 1.82 -0.39 215.30 5 2-HEAP + water 298.15 2.19 2.73 -45.60 156.40 6 2-HEAP + water 323.15 2.04 2.44 -56.14 158.79 7 2-HEAH + water 298.15 1.49 2.16 -25.25 173.77 8 2-HEAH + water 323.15 1.25 1.82 -25.92 176.47
Table 7: Systems used for modeling the Excess Molar Volume , VmE, and Apparent Molar Volumes,
,1 φ
V , with the PFP model (Prigogine Flory Patterson). T is temperature, AARD% and ARD% are described below.
E
Vm Vφ,1
System T/K AARD% ARD% AARD% ARD%
1 2-HEAB + water 298.15 1.830 0.527 0.059 0.013 2 2-HEAB + water 323.15 2.331 0.545 0.085 0.032 3 2-HEAP + water 298.15 5.261 0.103 0.346 0.226 4 2-HEAP + water 323.15 4.829 0.404 0.279 0.174 5 2-HEAH + water 298.15 5.164 -1.088 0.254 -0.143
6 2-HEAH + water 323.15 7.260 -1.665 0.337 -0.218
680 R. Rocha Pinto, D. Santos, S. Mattedi and M. Aznar
CONCLUSIONS
Four protic ionic liquids were synthesized by using several acids (butanoic, pentanoic and hexanoic) and bases (monoethanolamine and diethanolamine). Den-sities and refractive index of binary protic ionic liquid + water mixtures were measured at 298.15 K and 323.15K, under atmospheric pressure. The ex-perimental density data of each mixture allowed the calculation of apparent and excess molar volumes. The Redlich-Meyer, Redlich-Kister and Prigogine-Flory-Patterson equations were used to fit the data.
The structures of the ionic liquids were confirmed by FT-IR analysis, where the four liquids showed salt charareristics, due to the presence of salt-specific bands. Density experimental results revealed that this property decreases with increasing anion alkyl chain length and increases with decreasing cation alkyl chain length. The density values for the mixtures studied increase as the concentration of the ionic liquid in water increases. This can be explained due to the increase in the ion-pair interactions between ionic liquid and water. In the ionic liquid-rich phase, the density smoothly decreases, due to the absence of these ion-pair interactions and the presence of self-interaction between the ions. The refractive index had a similar behavior, increasing with increasing ionic liquid composition, but never decreasing. On the contrary, in the ionic liquid-rich phase, the refrac-tive index achieve a constant value. The highest re-fractive index values are due to the ion arrangement and to the efficient packing of ions. For the experi-mental refractive index, the cation influence is pretty clear. Interactions and structural characteristics, as well as apparent molar volumes, demonstrated that the most significant change occurred in the water-rich region. The apparent molar volume results were correlated with the Redlich-Meyer equation, while the excess volume data were correlated with the Redlich-Kister equation. The positive and high appar-ent molar volume values suggest strong ion-solvappar-ent interaction. The same interaction also becomes stronger as temperature increases. The apparent mo-lar volume is the limiting volume that a substance occupies in one mole of the other substance; in this limit, ions are surrounded only by the solvent. The ionic liquid with the shortest carbon chains, 2-HEAB, yielded the lower apparent molar volumes, being the first to achieve this limiting condition. On the contrary, the ionic liquid with the longest carbon chains, 2-HDEAH, showed the highest apparent molar volumes, being the last to achieve the limiting condition, independent of cation or anion type. It also shows that strong ion-solvent interactions are directly linked to the carbon chain size. Excess volume
values were negative and presented a smooth varia-tion with increasing solute chain. Negative values indicate the packing efficiency ability or that attrac-tive interactions occurred in ionic liquid + water solutions. The results proved to be useful for charac-terizing the influence of composition and tempera-ture on the volumetric properties of mixtempera-tures (2-HEAB, 2-HEAP, 2-HEAH or 2-HDEAH + water) and also for understanding and interpreting the interactions that occurs during the process of mixing ionic liquid in water. For density and refractive index and also for the volumes, the most significant changes occurred in the water-rich region. In the ionic liquid-rich phase, the results showed a tendency to be constant, meaning a decrease in the ion-solvent interactions. The tem-perature variation has little influence on the results.
ACKNOWLEDGMENTS
We acknowledge the financial support from FAPESP (grant 2011/19736-1).
NOMECLATURE
,1
Vφ apparent molar volume
E
Vm excess molar volume
M1 ionic liquid molar mass
x1 ionic liquid mole fraction
0
Vφ apparent molar volume at infinite dilution
m Molality
Ycalc number of calculated data
Yexp number of experimental data
n parameters number
nD refractive index
M2 water molar mass
x2 water mole fraction
Greek Letters
i
φ volume fraction
ρ solution density
ρ1 ionic liquid density
ρ2 water density
σ standard deviation
REFERENCES
Density, Refractive Index, Apparent Volumes and Excess Molar Volumes of Four Protic Ionic Liquids + Water at T=298.15 and 323.15 K 681
process: Synthesis and physical properties. J. Chem. Eng. Data. 55, p. 625-632 (2010a).
Alvarez, V. H., Mattedi, S., Martin-Pastor, M., Aznar, M., Iglesias, M., Synthesis and thermophysical properties of two new protic long-chain ionic liq-uids with the oleate anion. Fluid Phase Equilib., 299, p. 42-50 (2010b).
Bicak, N., A new ionic liquid: 2-hydroxy ethylam-monium formate. J. Mol. Liq., 116, p. 37-44 (2004). Costas, M., Patterson, D., Volumes of mixing and the
P* effect: Part II. Mixtures of alkanes with liquids of different internal pressures. J. Solution Chem., 11, p. 807-821 (1982).
Cota, I., Gonzalez-Olmos, R., Iglesias, M., Medina, F., New short aliphatic chain ionic liquids: Syn-thesis, physical properties, and catalytic activity in aldol condensations. J. Phys. Chem., B, 111, p. 12468-12477 (2007).
De Oliveira, L. H., Da Silva, J. L., Aznar, M., Appar-ent and partial molar volumes at infinite dilution and solid-liquid equilibria of dibenzothiophene + alkane systems. J. Chem. Eng., Data, 56, p. 3955-3962 (2011).
Fan, W., Zhou, Q., Zhang, S., Yan, R., Excess molar volume and viscosity deviation for the methanol + methyl methacrylate binary system at T = (283.15 to 333.15 K). J. Chem. Eng. Data, 53, p. 1836-1840 (2008).
Fan, W., Zhou, Q., Sun, J., Zhang, S., Density, excess molar volume, and viscosity for the methyl metha-crylate + 1-butyl-3-methylimidazolium hexafluor-phosphate ionic liquid binary system at atmos-pheric pressure. J. Chem. Eng. Data, 54, p. 2307-2311 (2009).
Flory, P. J., Abe, A., The thermodynamic properties of mixtures of small, nonpolar molecules. J. Am. Chem. Soc., 87, p. 1838-1846 (1965).
Flory, P. J., Statistical thermodynamics of liquid mix-tures. J. Am. Chem. Soc., 87, p. 1833-1838 (1965). Flory, P. J., Orwoll, R. A., Vrij, A., Statistical ther-modynamics of chain molecule liquids. II. Liquid mixtures of normal paraffin hydrocarbons. J. Am. Chem. Soc. 86, p. 3515-3520 (1964a).
Flory, P. J., Orwoll, R. A., Vrij, A., Statistical ther-modynamics of chain molecule liquids. I. An equation of state for normal paraffin hydrocar-bons. J. Am. Chem. Soc., 86, p. 3507-3515 (1964b). Iglesias, M., Torres, A., Gonzales-Olmos, R., Sal-vatierra, D., Effect of temperature on mixing ther-modynamics of a new ionic liquid: {2-hidroxy ethylammoniumformate (2-HEAF) + short hydro-xylic solvents}. J. Chem. Thermodyn. 40, p. 119-133 (2008).
Iglesias, M., Gonzales-Olmos, R., Cota, I., Medina, F., Brønsted ionic liquids: Study of physico-chemical properties and catalytic activity in aldol condensations. Chem. Eng. J., 162, p. 802-808 (2010).
Kapadi, U. R., Hundiwale, D. G., Patil, N. B., Lande, M. K., Viscosities, excess molar volume of binary mixtures of ethanolamine with water at 303.15, 308.15, 313.15 and 318.15 K. Fluid Phase Equi-lib., 201, p. 335-341 (2002).
Kennedy, J., Eberhart, R., "Particle Swarm Optimi-zation". In: Proceedings of IEEE International Conference on Neural Networks IV: 1942-1948, Perth, WA, Nov/Dec (1995).
Kurnia, K. A., Mutalib, M. I. A., Densities and vis-cosities of binary mixture of the ionic liquids bis (2-hydroxyethil) ammonium propionate with methanol, ethanol, and 1-propanol at T=(293.15, 303.15, 313.15 and 323.15) K and at P= 0.1 MPa. J. Chem. Eng. Data, 56, p. 79-83 (2011).
Nelder, J. A., Mead, R., A Simplex method for func-tion minimizafunc-tion. Computer J., 7, p. 308-313 (1965).
Orwoll, R., Flory, P. J., Equation-of-state parameters for normal alkanes. Correlation with chain length. J. Am. Chem. Soc., 89, p. 6814-6822 (1967). Patil, P. P., Patil, S. R., Borse, A. U., Hundiwale, D.
G., Density, excess molar volume and apparent molar volume of binary liquid mixtures. Rasayan J. Chem., 4, p. 599-604 (2011).
Patterson, D., Delmas, G., Corresponding states theo-ries and liquid models. Discuss. Faraday Soc., 49, p. 98-105 (1970).
Prigogine, I., The Molecular Theory of Solutions. North Holland, Amsterdam (1957).
Prigogine, I., Trappeniers, N., Mathot, V., Statistical thermodynamics of r-MERS and r-MER solu-tions. Discuss. Faraday Soc., 15, p. 93-107 (1953). Rilo, E., Domínguez-Pérez, M., Vila, J., Segade, L.,
García, M., Varela, L. M., Cabeza, O., Easy pre-diction of the refractive index for binary mixtures of ionic liquids with water or ethanol. J. Chem. Thermodyn., 47, 219-222 (2012).
Schwaab, M., Pinto, J. C., Análise de Dados Experi-mentais I: Fundamentos de Estatística e Estimação de Parâmetros, Rio de Janeiro, e-papers (2007). (In Portuguese).
682 R. Rocha Pinto, D. Santos, S. Mattedi and M. Aznar
Wang, J., Zhang, S., Wang, H., Pei, Y., Apparent molar volumes and electrical conductance of ionic liquids [Cnmin]Br dimethylsulfoxide at 298.15 K.
J. Chem. Eng. Data, 54, p. 3252-3258 (2009).