ISSN 0104-6632 Printed in Brazil
Vol. 19, No. 02, pp. 243 - 254, April - June 2002
of Chemical
Engineering
LIQUID-LIQUID EQUILIBRIA OF THE
WATER-ACETIC ACID-BUTYL ACETATE SYSTEM
E.
İ
nce and
Ş
.
İ
smail K
õ
rba
ş
lar*
Department of Chemical Engineering, School of Engineering, Istanbul University, 34850 Avcilar, Istanbul, Turkey.
(Received: May 19, 2001 ; Accepted: April 11, 2002)
Abstract - Experimental liquid-liquid equilibria of the water-acetic acid-butyl acetate system were studied at
temperatures of 298.15±0.20, 303.15±0.20 and 308.15±0.20 K. Complete phase diagrams were obtained by determining solubility and tie-line data. The reliability of the experimental tie-line data was ascertained by using the Othmer and Tobias correlation. The UNIFAC group contribution method was used to predict the observed ternary liquid-liquid equilibrium (LLE) data. It was found that UNIFAC group interaction parameters used for LLE did not provide a good prediction. Distribution coefficients and separation factors were evaluated for the immiscibility region.
Keywords: acetic acid, butyl acetate, liquid-liquid equilibria.
INTRODUCTION
Recovery of organic acids from dilute solutions resulting from fermentation processes is important, and many solvents have been tried in attempts to improve recovery (Upchurch and Van Winkle, 1952; Correa et al., 1989; Sayar et al., 1991; Kirk and Othmer, 1992; Dramur and Tatlõ, 1993; Briones et al., 1994; Arce et al., 1995; Fahim et al., 1996; Fahim et al., 1997; Sólimo et al., 1997; Colombo et al., 1999; Aljimaz et al., 2000; Taghikhani et al. 2001).
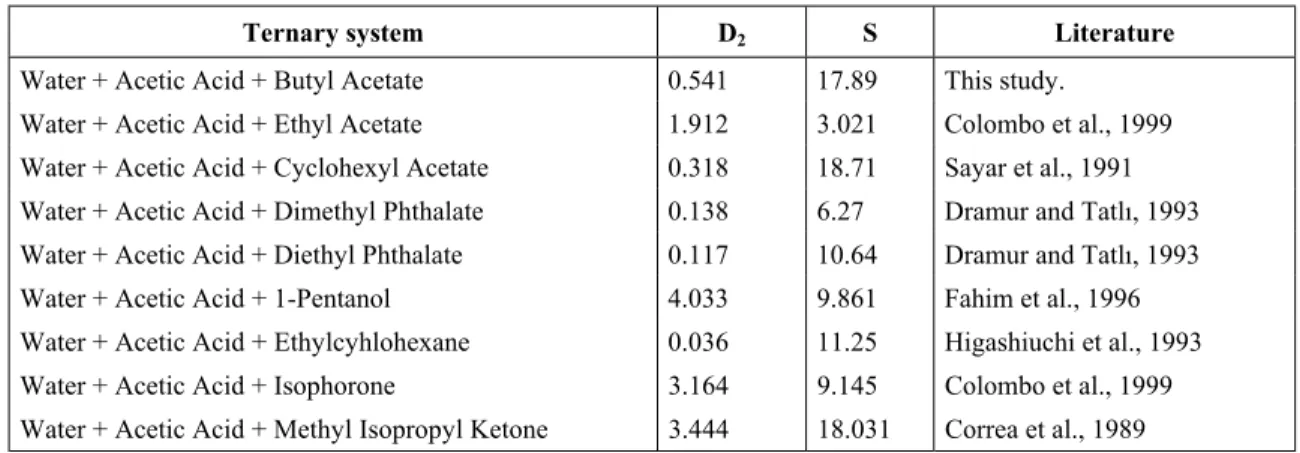
A lot of solvents have been examined for extraction of acetic acid. Selected distribution ratios (D2) and selectivities taken from several papers are
shown in Table 1. Because there is little change in the distribution ratio for moderate variations in the acid concentration of dilute solutions, the acetic acid concentrations are not shown in Table 1.
The real behavior of fluid mixtures can be calculated with the help of activity coefficients or
in multicomponent systems requires reliable thermodynamic models that allow calculation of these properties from available experimental data.
The UNIFAC method (UNIFAC Functional-group Activity Coefficient) was developed by Fredenslund et al. (1975). It is one of the best methods used in estimating activity coefficients. The UNIFAC method for estimation of activity coefficients works on the concept that a liquid mixture may be considered a solution of structural units from which the molecules are formed, rather than a solution of the molecules themselves. This type of approach is known as the group contribution method. It has the advantage of being able to form a very large number of molecules from a relatively small set of structural units. The structural units in the calculation method are called subgroups (Higashiuchi et al. 1993; Higashiuchi et al. 1997).
agent for the extraction of acetic acid from dilute aqueous solutions, we herein report liquid-liquid equilibrium results at temperatures of 298.15±0.20, 303.15±0.20 and 308.15±0.20 K for the ternary
system of water-acetic acid-butyl acetate. Dependence on temperature was studied by evaluating distribution coefficients and separation factors for each case.
Table 1: Distribution ratios (D2) and separation factors (S) for extraction of acetic acid from dilute
solution in water with several different solvents at 298.15 K.
Ternary system D2 S Literature
Water + Acetic Acid + Butyl Acetate 0.541 17.89 This study.
Water + Acetic Acid + Ethyl Acetate 1.912 3.021 Colombo et al., 1999 Water + Acetic Acid + Cyclohexyl Acetate 0.318 18.71 Sayar et al., 1991 Water + Acetic Acid + Dimethyl Phthalate 0.138 6.27 Dramur and Tatlõ, 1993 Water + Acetic Acid + Diethyl Phthalate 0.117 10.64 Dramur and Tatlõ, 1993 Water + Acetic Acid + 1-Pentanol 4.033 9.861 Fahim et al., 1996 Water + Acetic Acid + Ethylcyhlohexane 0.036 11.25 Higashiuchi et al., 1993 Water + Acetic Acid + Isophorone 3.164 9.145 Colombo et al., 1999 Water + Acetic Acid + Methyl Isopropyl Ketone 3.444 18.031 Correa et al., 1989
EXPERIMENTAL
Materials
Acetic acid and butyl acetate with purities of 99.98 % (W/W) and 99.50 % (W/W), respectively, were purchased from Merck. Acetic acid and butyl acetate were used without further purification. Deionized water was further distilled before use. Refractive indexes were measured with an Abbé-Hilger refractometer; its stated accuracy was ± 0.0005. Densities were measured with an Anton Paar densimeter (model 4500). Boiling point measurements were obtained by using a Fischer boiling point apparatus. The estimated uncertainties in the density and boiling point measurements were ±0.0001 g.cm-3 and 0.1 K, respectively. The measured physical properties are listed in Table 2, along with some values from the literature (Weast, 1990).
Procedure
The binodal curve for the water-acetic acid-butyl acetate ternary system was determined by the cloud-point method. Binary mixtures of known compositions were shaken in a glass stoppered cell (Figure 1) equipped with a magnetic stirrer and jacketed for circulating water from a constant temperature bath at 298.15±0.20, 303.15±0.20 and
308.15±0.20 K. The third component was progressively added until the transition point was reached. The end point was determined by observing the transition from a homogenous to a heterogeneous mixture. The mutual solubilities of the water+butyl acetate system were determined by using the cloud-point method. A weighed amount of one component was placed in the cell; then the other component was added until a permanent heterogeneity could be observed. Ternary mixtures of known overall compositions lying within the two-phase region were prepared shaken thoroughly and then allowed to reach equilibrium. Samples were carefully taken from each phase and analyzed to obtain the tie lines. An electronic balance, accurate to ±0.1 mg, was used during the experiments. The solvent was added by means of an automated microburet with an accuracy of 0.005 cm3.
Analysis
a 0.5-micrometer film thickness) was used. Chromatographic data were processed with a computerized system. The column temperature program was 45 °C (5 min) to 100 °C at 5 °C/min and to 250 °C at 25 °C/min, the injection mode used a split ratio of 10:1, the detector was a TCD, the injector and detector temperature was 250 °C, the carrier gas was nitrogen at 1 mL/min and the injected volume was 0.5 µL of liquid sample. Usually only the data from TCD were used in data processing, while those from FID were used for confirmation.
RESULTS AND DISCUSSION
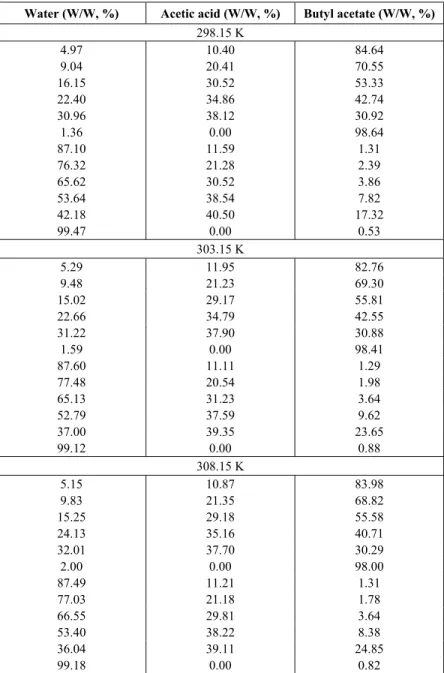
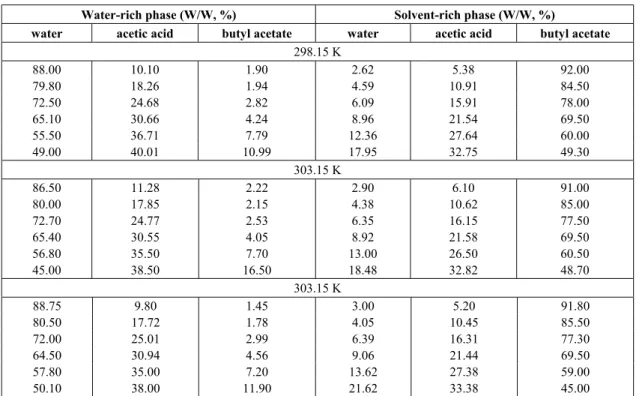
The experimental binodal curves and tie-line data on water-acetic acid-butyl acetate ternaries at 298.15±0.20, 303.15±0.20 and 308.15±0.20 K, are given in Tables 3 and 4, respectively. The binodal curves and tie lines at each temperature are plotted and shown in Figures 2, 3 and 4, respectively. To show the selectivity and strength of the solvent in extracting the acid, distribution coefficients (Di) for
the acetic acid (i=2) and water (i=1) and the separation factor (S) are determined as follows:
) (W phase aqueous in fraction Weight ) (W phase solvent in fraction Weight D i1 i3
i = (1)
1 2
D
D
S
=
(2)The distribution coefficients and separation factor for each temperature are given in Table 5. The extraction power of the solvent at each temperature, plots of D2 vs. W21 and S vs. W21, are given in Figure
5 and 6, respectively.
The effectiveness of extraction of acetic acid by butyl acetate is given by its separation factor (S), which is an indication of the ability of butyl acetate to separate acetic acid from water. This quantity is greater than one (separation factors varying between 2.04 and 17.89) for the system reported here, which means that extraction of acetic acid by butyl acetate is possible. It is, however, not constant over the whole two-phase region.
)
W
W
1
ln(
B
A
)
W
W
1
ln(
11 11 3333
=
+
−
−
(3)
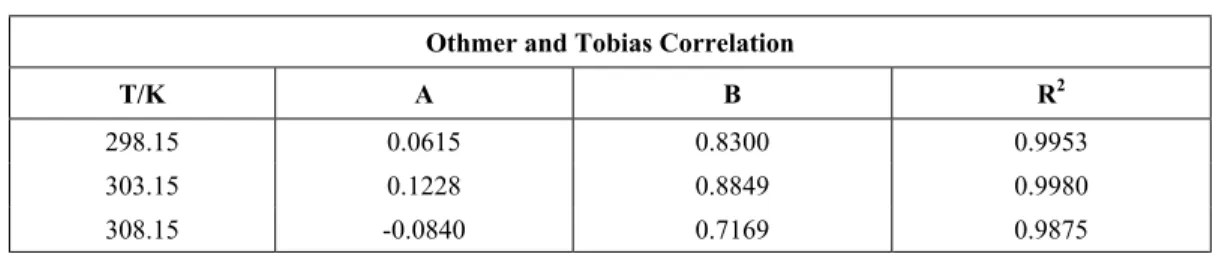
The reliability of experimentally measured tie-line data is determined by making a Othmer and Tobias correlation (Eq. 3) for the ternary system at each temperature. The linearity of the plots in Figures 7-9 indicates the degree of consistency of the related data (Othmer and Tobias, 1942). The Othmer and Tobias plots are shown in Figures 7-9 and the correlation parameters are given in Table 6.
Table 2: Physical properties of the chemicals used in the experiments.
Chemical ρ
293.15 K
(g.cm-3)
15 . 293 D η B.P. (101.325 kPa/K)
Acetic acid 1.0492
a
1.0505±0.0001b
1.3716a 1.3712±0.0005b
391.26a 391.22±0.1b
Butyl acetate 0.8825
a
0.8827±0.0001b
1.3941a 1.3938±0.0005b
399.25a 399.25±0.1b a Literature (Weast, 1990).
Figure 1: Liquid-liquid equilibrium and solubility cell.
Table 3: Solubility curve data for water (1)-acetic acid (2)-butyl acetate (3).
Water (W/W, %) Acetic acid (W/W, %) Butyl acetate (W/W, %)
298.15 K
4.97 10.40 84.64
9.04 20.41 70.55
16.15 30.52 53.33
22.40 34.86 42.74
30.96 38.12 30.92
1.36 0.00 98.64
87.10 11.59 1.31
76.32 21.28 2.39
65.62 30.52 3.86
53.64 38.54 7.82
42.18 40.50 17.32
99.47 0.00 0.53
303.15 K
5.29 11.95 82.76
9.48 21.23 69.30
15.02 29.17 55.81
22.66 34.79 42.55
31.22 37.90 30.88
1.59 0.00 98.41
87.60 11.11 1.29
77.48 20.54 1.98
65.13 31.23 3.64
52.79 37.59 9.62
37.00 39.35 23.65
99.12 0.00 0.88
308.15 K
5.15 10.87 83.98
9.83 21.35 68.82
15.25 29.18 55.58
24.13 35.16 40.71
32.01 37.70 30.29
2.00 0.00 98.00
87.49 11.21 1.31
77.03 21.18 1.78
66.55 29.81 3.64
53.40 38.22 8.38
36.04 39.11 24.85
Table 4: Tie-line data for water (1)-acetic acid (2)-butyl acetate (3).
Water-rich phase (W/W, %) Solvent-rich phase (W/W, %)
water acetic acid butyl acetate water acetic acid butyl acetate
298.15 K
88.00 10.10 1.90 2.62 5.38 92.00
79.80 18.26 1.94 4.59 10.91 84.50
72.50 24.68 2.82 6.09 15.91 78.00
65.10 30.66 4.24 8.96 21.54 69.50
55.50 36.71 7.79 12.36 27.64 60.00
49.00 40.01 10.99 17.95 32.75 49.30
303.15 K
86.50 11.28 2.22 2.90 6.10 91.00
80.00 17.85 2.15 4.38 10.62 85.00
72.70 24.77 2.53 6.35 16.15 77.50
65.40 30.55 4.05 8.92 21.58 69.50
56.80 35.50 7.70 13.00 26.50 60.50
45.00 38.50 16.50 18.48 32.82 48.70
303.15 K
88.75 9.80 1.45 3.00 5.20 91.80
80.50 17.72 1.78 4.05 10.45 85.50
72.00 25.01 2.99 6.39 16.31 77.30
64.50 30.94 4.56 9.06 21.44 69.50
57.80 35.00 7.20 13.62 27.38 59.00
50.10 38.00 11.90 21.62 33.38 45.00
Figure 2: LLE ternary diagram for water (1)+acetic acid (2) butyl acetate (3) at 298.15 K; −!− experimental
Figure 3: LLE ternary diagram for water (1)+acetic acid (2) butyl acetate (3) at 303.15 K; −!−experimental
binodal curve and tie lines; --□-- calculated (UNIFAC method) binodal curve and tie lines.
Figure 4: LLE ternary diagram for water (1)+acetic acid (2) butyl acetate (3) at 308.15 K; −!− experimental
binodal curve and tie lines; --□-- calculated (UNIFAC method) binodal curve and tie lines.
(2) and separation factors at 298.15, 303.15 and 308.15 K.
298.15 K 303.15 K 308.15 K
D2 D1 S D2 D1 S D2 D1 S
0.5327 0.0298 17.89 0.5408 0.0335 16.13 0.5306 0.0338 15.70 0.5975 0.0575 10.39 0.5950 0.0547 10.87 0.5897 0.0503 11.72 0.6447 0.0840 7.67 0.6520 0.0873 7.46 0.6521 0.0888 7.35 0.7025 0.1376 5.10 0.7064 0.1364 5.18 0.6930 0.1405 4.93 0.7529 0.2227 3.38 0.7465 0.2289 3.26 0.7823 0.2356 3.32 0.8185 0.3663 2.23 0.8525 0.4107 2.08 0.8784 0.4315 2.04
0.5 0.6 0.7 0.8 0.9 1.0
0 0.1 0.2 0.3 0.4 0.5
W 21
D2
298.15 K
303.15 K
308.15 K
Figure 5: Distribution coefficient (D2) of acetic acid as a function
of the mass fraction (W21) of acetic acid in aqueous phase.
0 5 10 15 20
0 0.1 0.2 0.3 0.4 0.5
W21
S
298.15 K 303.15 K 308.15 K
-2.0 -1.5 -1.0 -0.5 0.0 0.5
-2.0 -1.5 -1.0 -0.5 0.0 0.5
ln ((1-W33)/W33)
ln
(
(1-W
11
)/
W
11
)
Figure 7: Othmer and Tobias plot at 298.15 K.
-2.0 -1.5 -1.0 -0.5 0.0 0.5
-2.0 -1.5 -1.0 -0.5 0.0 0.5
ln ((1-W33)/W33)
ln
((1
-W
11
)/W
11
)
Figure 8: Othmer and Tobias plot at 303.15 K.
-2.0 -1.5 -1.0 -0.5 0.0 0.5
-2.0 -1.5 -1.0 -0.5 0.0 0.5
ln ((1-W33)/W33)
ln
(
(1-W
11
)/W
11
)
Table 6: Othmer-Tobias equation constants for the water + acetic acid + butyl acetate ternary system.
Othmer and Tobias Correlation
T/K A B R2
298.15 0.0615 0.8300 0.9953
303.15 0.1228 0.8849 0.9980
308.15 -0.0840 0.7169 0.9875
Prediction of Equilibria by the UNIFAC Method
The equilibrium data for the ternary mixture were also predicted by the UNIFAC method (Fredenslund et al., 1975, 1977) using the parameters obtained by Magnussen et al. (1981). The values of the UNIFAC parameters for LLE prediction are summarized in Table 7. The prediction performances are shown in Figures 2, 3 and 4. As shown in Figures 2, 3 and 4, LLE correlations obtained by the UNIFAC method cannot adequately fit the experimental LLE data.
The root mean square deviations (RMSD) were calculated from the difference between the experimental data and the predictions of the UNIFAC method at each temperature according to the following formula:
2 / 1 j 2 calcd , i exp , i i k n 6 / ) X X ( RMSD −
=
∑
∑
∑
(4)where i is water or acetic acid, j is the solvent or aqueous phase and k=1, 2, 3,...n (tie lines). The UNIFAC method was used to correlate the experimental data at each temperature (298.15, 303.15 and 308.15 K) with RMSD values of 0.105, 0.122 and 0.179, respectively.
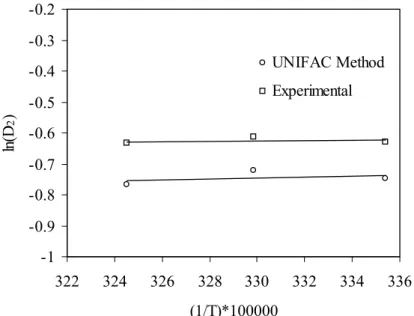
The distribution coefficients for acetic acid (D2)
were calculated according to Eq. 1 at each temperature. The effect of temperature on the distribution coefficient was found to be slightly positive. The experimental and UNIFAC method predictions were fitted according to the following equation:
)
RT
/
E
exp(
A
D
2=
−
A (5)The experimental points and predicted values (UNIFAC) are shown in Figure 10. The UNIFAC method predictions were not close to the experimental values. The experimental activation energy (EA) and the frequency factor (A) were
0.0091 J.mol-1 and 0.9235, respectively. The calculated (UNIFAC) activation energy (EA) and the
frequency factor (A) were 0.0150 J.mol-1 and 0.3619, respectively.
Selectivity
Diagrams of selectivity on a solvent-free basis were obtained by plotting W23/(W23+W13) vs.
W21/(W21+W11) for 298.15, 303.15 and 308.15 K in
Figure 11. The effect of a temperature change on the selectivity values was found to be insignificant.
Table 7: UNIFAC parameters for prediction (Magnussen et al., 1981).
CH3 CH2 COOH CH3COO H2O Rk Qk
CH3 0 0 315.30 114.80 300.00 0.9011 0.8480
CH2 0 0 315.30 114.80 300.00 0.6744 0.5400
COOH 663.50 663.50 0 660.20 -14.09 1.3013 1.2240
CH3COO 232.10 232.10 -256.30 0 72.87 1.9031 1.7280
-1 -0.9 -0.8 -0.7 -0.6 -0.5 -0.4 -0.3 -0.2
322 324 326 328 330 332 334 336
(1/T)*100000
ln
(D
2
)
UNIFAC Method
Experimental
Figure 10: Effect of temperature on the distribution coefficient (D2) of acetic acid.
0 0.2 0.4 0.6 0.8 1
0 0.2 0.4 0.6 0.8 1
W21/(W21+W11)
W
23
/(
W
23
+W
13
)
298.15 K
303.15 K 308.15 K
Figure 11: Selectivity diagram at temperature values studied (free-solvent basis).
CONCLUSION
LLE data for the water-acetic acid-butyl acetate ternary system were obtained at 298.15, 303.15 and 308.15 K. The equilibrium data of the ternary mixture were also predicted by the UNIFAC method. It was found that UNIFAC with original group interaction parameters developed for LLE did not provide good prediction.
It can be concluded that butyl acetate showing low solubilities in water may be an adequate solvent to extract acetic acid from its dilute aqueous
solutions. The complete break in conjugate phases was never hindered by density, viscosity or interfacial tension-related phenomena during the settling process.
NOMENCLATURE
A frequency factor (Eq. 5).
Di distribution coefficient of the ith component
(Eq. 1).
EA activation energy, Joule (Eq. 5).
i component number: water (1), acetic acid (2) and solvent (butyl acetate) (3)
j solvent or aqueous phase (Eq. 4). k: tie-line number (Eq. 4).
S separation factor (Eq. 2).
Wi weight fraction of the ith component
W11 weight fraction of water (1) in the aqueous
phase
W21 weight fraction of acetic acid (2) in the
aqueous phase
W31 weight fraction of butyl acetate (3) in the
aqueous phase
W13 weight fraction of water (1) in the
solvent-rich phase
W23 weight fraction of acetic acid (2) in the
solvent-rich phase
W33 weight fraction of butyl acetate (3) in the
solvent-rich phase
REFERENCES
Aljimaz, A.S., Fandary, M.S.H., Alkandary, J.A. and Fahim, M.A., Liquid-Liquid Equilibria of the Ternary System Water+Acetic Acid+1-Heptanol, J. Chem. Eng. Data, 45, No. 2, 301 (2000).
Arce, A., Blanco, A., Souza, P. and Vidal, I., Liquid-Liquid Equilibria of the Ternary Mixtures Water + Propionic Acid + Methyl Ethyl Ketone and Water + Propionic Acid + Methyl Propyl Ketone, J. Chem. Eng. Data, 40, 225 (1995).
Briones, J.A., Mullins, J.C. and Thies, M.C., Liquid-Liquid Equilibria for the Oleic Acid-β-Sitosterol-Water System at Elevated Temperatures and Pressures. Ind. Eng. Chem. Res., 33, 151 (1994).
Colombo, A., Battilana, P., Ragaini, V. and Bianchi, C.L., Liquid-Liquid Equilibria of the Ternary Systems Water+Acetic Acid+Ethyl Acetate and Water+Acetic Acid+Isophorone (3,3,5-Trimethyl-cyclohexen-1one), J. Chem. Eng. Data, 44, No.1, 35 (1999).
Correa, J.M., Blanco, A. and Arce, A., Liquid-Liquid Equilibria of the System Water+Acetic Acid+Methyl Isopropyl Ketone Between 25 and 55 °C, J. Chem. Eng. Data, 34, No. 4, 415 (1989).
Dramur, U. and Tatlõ, B., Liquid-Liquid
Ternaries, J. Chem. Eng. Data, 38, No. 1, 23 (1993).
Fahim, M.A., Al-Muhtaseb, S.A. and Alnashef, I.M., Liquid-Liquid Equilibria of the Ternary System Water+Acetic Acid+1-Pentanol, J. Chem. Eng. Data, 41, No. 3, 562 (1996).
Fahim, M.A., Al-Muhtaseb, S.A. and Alnashef, I.M., Liquid-Liquid Equilibria of the Ternary System Water+Acetic Acid+Hexanol, J. Chem. Eng. Data, 42, No. 3, 183 (1997).
Fredenslund, A., Jones, R.L. and Prausnitz, J.M., Group-Contribution Estimation of Activity Coefficients in Nonideal Liquid Mixtures, AIChE Journal, 21, No. 61, 1086 (1975).
Fredenslund, A., Gmehling, J. and Rasmussen, P., Vapor-Liquid Equilibria Using UNIFAC: A Group-Contribution Method, Elsevier: Amsterdam, 1977.
Higashiuchi, H., Sakuragi, Y., Nakahara, S., Masamoto, H. and Arai, Y., Measurement and Correlation of Liquid-Liquid Equilibria for the Water-Organic Compound-Acetic Acid Ternary Systems, Memoirs of the Faculty of Engineering, Kyushu University, 53, No. 4, 235 (1993).
Higashiuchi, H., Watanabe, T. and Arai, Y., Liquid-Liquid Equilibria of the Ternary System Containing Alkene, Methanol and Ether, Fluid Phase Equilibria, 136, 141 (1997).
Kirk, R.E. and Othmer, D.F., Encyclopaedia of Chemical Technology, 4th ed., Wiley-Interscience, Inc. New York, Vol. 1, p.121 (1992).
Magnussen, T., Ramussen, P. and Fredenslund, A., UNIFAC Parameters Table for Prediction of Liquid-Liquid Equilibria, Ind. Eng. Chem. Process. Des. Dev., 20, 331 (1981).
Othmer, D.F. and Tobias, P.E., Tie-line Correlation, Ind. Eng. Chem., 34, No. 6, 693 (1942).
Sayar, A.A., Tatlõ, B. and Dramur, U., Liquid-Liquid Equilibria of the System Water +Acetic Acid+Cyclohexyl Acetate Ternary, J. Chem. Eng. Data, 36, 378 (1991).
Sólimo, H.N., Bonatti, C.M., Zurita, J.L. and de Doz, M.B.G., Liquid-Liquid Equlibria for the System Water+Propionic Acid+1-Butanol at 303.2 K. Effect of Addition of Sodium Chloride, Fluid Phase Equilibria, 137, No. 1, 163 (1997).
Upchurch, J.C. and Van Winkle, M., Liquid-Liquid Equilibria Heptadecanol-Water-Acetic Acid and Heptadecanol-Water-Ethanol, Industrial and Engineering Chemistry, 44, 618 (1952).