SHORT-TERM PHYTOPLANKTON DYNAMICS IN RESPONSE TO TIDAL STIRRING
IN A TROPICAL ESTUARY (SOUTHEASTERN BRAZIL)
Suzana Gonçalves Leles1,*, Catharina Alves de Souza2, Cassia de Oliveira Faria3, Ana Beatriz Ramos3, Alexandre Macedo Fernandes4 and Gleyci Aparecida de Oliveira Moser1
1
Universidade Estadual do Rio de Janeiro - Faculdade de Oceanografia Departamento de Oceanografia Biológica
(Rua São Francisco Xavier, 524, 20550-900 Rio de Janeiro, RJ, Brasil)
2
Museu Nacional - Universidade Federal do Rio de Janeiro Departamento de Botânica
(Quinta da Boa Vista, s/n, 20940-040 Rio de Janeiro, RJ, Brasil)
3
Universidade Estadual do Rio de Janeiro - Faculdade de Oceanografia Departamento de Oceanografia Química
(Rua São Francisco Xavier, 524, 20550-900 Rio de Janeiro, RJ, Brasil)
4
Universidade Estadual do Rio de Janeiro - Faculdade de Oceanografia Departamento de Oceanografia Física
(Rua São Francisco Xavier, 524, 20550-900 Rio de Janeiro, RJ, Brasil)
*Corresponding author: [email protected]
http://dx.doi.org/10.1590/S1679-87592014070506204
Descriptors: Tropical estuary, Tidal stirring, Phytoplankton. Descritores: Estuário tropical, Movimento da maré, Fitoplâncton.
The spatio-temporal distribution of phytoplankton assemblages can be highly affected by physical, chemical and biological processes (HANSSON, 1995; MACINTYRE; CULLEN, 1996; SEURONT et al., 2001). Estuaries are highly variable environments and the processes listed above can influence phytoplankton dynamics not only seasonally (MACEDO et al., 2001; IGNATIADES et al., 2002) but also during tidal cycles (GOOSEN et al., 1999; BRUNET; LIZON, 2003). Tidal stirring constitutes a relevant driving force affecting phytoplankton distribution, since it induces substantial horizontal and vertical mixing of the water column, as well as upstream and downstream displacement of water masses along the main longitudinal estuarine axis. While horizontal mixing has more mechanical effects on phytoplankton (LEGENDRE; DEMERS, 1984), vertical mixing can affect phytoplankton physiology and growth due to its strong impact on the availability of nutrients and light (DEMERS et al., 1979).
Overall, tidal forcing is responsible for short-term changes in phytoplankton biomass, specific composition, growth and primary production (WETZ et al., 2006). These effects are especially important in shallow tidally-driven estuarine systems (CLOERN, 1991; WETZ et al., 2006) and different authors have been studying patterns of primary production on this
time scale (JOUENNE et al., 2005; HELBLING et al., 2010), but it is also interesting to get some insights on changes in phytoplankton composition (BUCCI et al., 2012; MOSER et al., 2012).
Due to its polyphyletic origin, phytoplankton show distinct physiological behavior as well as different abiotic requirements for growth (MARGALEF, 1978; SEIP; REYNOLDS., 1995;
LICTHMAN; KLAUSMEIER, 2008). The
environmental conditions (NASELLI-FLORES et al., 2007), which is why the Reynolds strategies were used in this study. Although developed for freshwater phytoplankton, this classification has been successfully tested for marine phytoplankton (e.g. SMAYDA; REYNOLDS, 2001; ALVES-DE-SOUZA et al., 2008; MOSER et al., 2014), and the present study is a contribution to the theme in tropical estuaries. Therefore, the aim of this study was to characterize the dynamics of phytoplankton assemblages focusing on the short-term temporal variations associated with tidal stirring, haline gradients and nutrient concentrations, showing preliminary results of the phytoplankton community composition of the Barra Grande estuary (Ilha Grande, Southeastern Brazil), focusing on morphological traits. It is worthy of note that this is the first study on phytoplankton ecology in Barra Grande estuary.
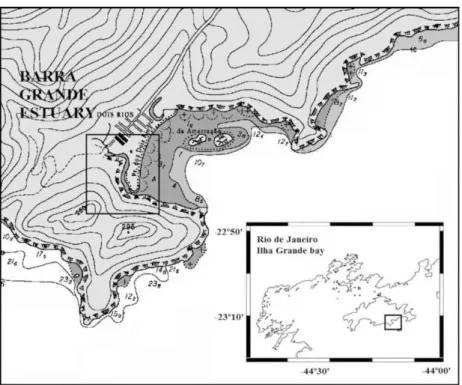
Ilha Grande is located between Ilha Grande Bay and Sepetiba Bay (Fig. 1). The Barra Grande estuary (Vila Dois Rios, Ilha Grande) was selected for this study because it can be considered a mesocosm due to its shallow depths (around 3 m), its average 80 km length, 10 m width and single freshwater source, thus resembling the classic estuary defined by PRITCHARD (1956). Studies in natural systems such as the Barra Grande estuary are interesting because this latter presents the simplicity and small size of a mesocosm without the manipulating conditions of an
artificial system. Besides, the Barra Grade estuary has been poorly studied and is subject to low anthropogenic influence due to its location in one of the most preserved portions of Atlantic Rainforest of Rio de Janeiro state.
The survey was conducted in March/2012, (austral summer; rainy season) in a mooring (23°11’S and 44°12’W) during a complete tidal cycle in spring tide. Two tidal rulers were positioned near the mooring to verify the tidal variation and the Secchi depth was obtained during the survey. The current data were obtained by an ADCP (Aquadopp high resolution Nortek S.A.; frequency 2 MHz) and a CTD (SBE, model 19 plus V2 SEACAT; frequency 4 Hz) was used to obtain profiles of temperature and salinity at intervals of an hour. The data were processed on MatLab (R2008a). The Barra Grande estuary was classified by the Stratification-Circulation Diagram of HANSEN AND RATTRAY (1966) and in accordance with MIRANDA et al. (2002).
Phytoplankton and nutrient samples were collected with a Van Dorn bottle at intervals of one hour and half an hour, respectively, at the surface and near the bottom. Nutrient analyses were carried out by spectrophotometric methods (HANSEN; KOROLEFF, 1983, for phosphate, nitrate, nitrite and ammonium determination). Phytoplankton samples were kept in the dark to preserve algal pigments, in 250 mL flasks, preserved with 4% formaldehyde.
An inverted optical microscope was used to determine phytoplankton cell density, under an amplification of 400x, in sedimentation chambers of 100 mL (UTERMÖHL, 1958). Cell counts were carried out on transects, and whereas a minimum of 400 cells was required for nanophytoplankton (2 - 20 µm), 200 cells were required for microphytoplankton (20 - 200 µm), in accordance with LUND et al. (1964), CUPP (1943) and TOMAS (1997). Phytoplankton biovolume was calculated assuming the geometrical form of the cell (HILLEBRAND et al., 1999; SUN; LIU, 2003; OLENINA et al., 2006) and then converted to carbon using linear regressions obtained from the literature (STRATHMANN, 1967 for diatoms; VERITY et al., 1992 for nanophytoplankton; and
MENDEN-DEUER; LESSARD, 2000 for
dinoflagellates and chlorophytes).
To classify the phytoplankton according to C-S-R strategies (REYNOLDS, 1988), taxa were selected by the following criterion: 10 % of abundance in at least 50 % of the observations. This criterion was applied separately for diatoms, dinoflagellates and other groups (cyanobacterias, chlorophytes, euglenophyceaes and phytoflagellates < 20µm), due to high diatom abundance in all the samples.
To analyze the main variables that influence species distribution in space and time we used multivariate analysis. In order to test if the groups formed by the C-S-R strategies were significantly different we first ordered the species by their S/V ratio using multidimensional scaling (MDS) and then ran an ANOSIM test using the computer program PRIME (version 7, for Windows). All these tests were applied to the previously normalized [log (x+1)] biotic dataset (26 descriptors x 12 variables). A canonical correspondence analysis (CCA) was applied to the abiotic (26 descriptors x 8 variables) and the biotic datasets using CANOCO (Windows version). The statistical significance of the amount of variance added by each variable was tested by the Monte Carlo permutation test, using 999 permutations (p = 0.05); only significant variables were included. The normalized data were also subjected to one-way analysis of variance (ANOVA) for depth (surface and bottom) and related variables (current speed, temperature, salinity and cell density).
The Barra Grande estuary is dominated by semi-diurnal tides with well-defined flood and ebb cycles. The consecutive high water levels exhibited a difference of about 0.2 m, indicating diurnal inequality. The local depth varied between 2 and 3.5 m. There was no difference between Secchi depth and local depth at any time during the experiment, indicating that light was able to reach the bottom. Temperature was higher on the surface (maximum of 27.2°C), the opposite was observed for salinity (Table 1). Current speeds were very low near the
bottom, except at flood tide, when values were around 0.1 m s-1. On the surface, current speeds were higher, especially at ebb tide (maximum of 0.3 m s-1). These values and the fact that the ebb tide was longer than the flood tide (one hour and a half), indicate that the river discharge plays an important role in the estuary dynamics. The estuary was classified as type 2 according to the Stratification-circulation Diagram, highly stratified, where the resulting flow reverses with depth and the advective and dispersive processes are important to the transport of salt up the estuary. Similar results were found for the estuarine system of Cananéia-Iguape and for Guanabara Bay (BÉRGAMO et al., 2008).
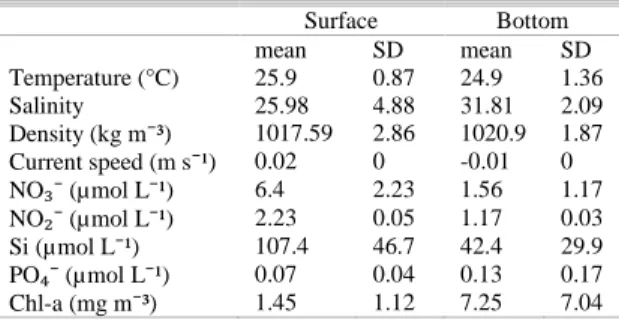
Table 1. Mean and standard deviation (SD) of environmental variables data.
Surface Bottom
mean SD mean SD
Temperature (°C) 25.9 0.87 24.9 1.36
Salinity 25.98 4.88 31.81 2.09
Density (kg m⁻³) 1017.59 2.86 1020.9 1.87 Current speed (m s⁻¹) 0.02 0 -0.01 0 NO ⁻ (µmol L⁻¹) 6.4 2.23 1.56 1.17 NO ⁻ (µmol L⁻¹) 2.23 0.05 1.17 0.03 Si (µmol L⁻¹) 107.4 46.7 42.4 29.9 PO ⁻ (µmol L⁻¹) 0.07 0.04 0.13 0.17 Chl-a (mg m⁻³) 1.45 1.12 7.25 7.04
The mean values and the standard deviation of nutrient concentrations are represented in table 1. Generally, higher concentrations of inorganic nutrients were observed in surface waters during the ebb tide. Phosphate and nitrite concentrations were low during the survey due to the well preserved state of the area and because the latter is an intermediate and unstable form of the nitrogen cycle. Silicate concentrations oscillated during the tidal cycle reaching maximum values at the surface during ebb tide (36.06 μmol L-1 - 186.25 μmol L-1) and minimum values near the bottom during flood tide (17.96 μmol L-1 - 86.21 μmol L-1), just as the concentrations of ammonium and nitrate. Ammonium concentrations varied from 2.01
μmol L-1 to 4.61 μmol L-1 at the surface, and from 1.31μmol L-1 to 9.8 μmol L-1 near the bottom. Nitrate variation was related to tides, presenting higher values on the ebb tide and lower values on the flood tide (1.9 µmol L-1 and 10.38 µmol L-1 at the surface; 0.5 µmol L-1 and 4.33 µmol L-1 near the bottom).
was not observed at the surface due to the water column's haline stratification. Values of Chl-a between 2 and 10 mg m-3 are commonly observed in coastal regions, as for example in the Cananéia-Iguape estuarine system where concentrations varied from 2.74 a 5.71 mg m-3 in January/2001 (BARRERA-ALBA et al., 2007).
Phytoplankton cell density varied from 104 to 106 cell L-1. Generally, density was higher near the bottom, as observed for concentrations of Chl-a. Light seemed to be non-limiting for phytoplankton growth during the sampling. Most of the species found in the Barra Grande estuary were marine and neritic, probably resulting from cell importation from the adjacent shelf, as well as from local production. The mean cell density observed in Barra Grande estuary was 5.7 × 10⁵ cell L-1. On the study carried out on Cananéia-Iguape the mean cell density was 2.3 × 10⁶ cell L-1 in the estuary and 1.8 - 1.7 × 10⁶ cell L-1 near the connections with the ocean (BARRERA-ALBA et al., 2007). In Guanabara Bay, cell density varies between 105– 109 cell L-1 (VILLAC; TENENBAUM 2010). Phytoplankton is responding with higher densities to eutrophication in these estuarine systems, which differ in their geomorphology as well as in the anthropogenic pressure and nutrient sources (PARANHOS et al., 1998; SOUZA et al., 2012).
As expected in coastal systems
(TREMBLAY et al., 1997; MURREL, 2004; VARGAS et al., 2007), nanophytoplankton contributed more to the total phytoplankton than did microphytoplankton, representing 77% of total phytoplankton cells on the surface and 61% near the bottom. This lower relative contribution near the bottom was due to the high density of microphytoplanktonic forming chains diatoms. These diatoms were found at both depths, but near the bottom the diatoms and chains were much longer. This pattern can be explained by the sinking rate of the chain, which increases proportionally to chain length (SOURNIA, 1982). Diatoms contributed with more than 85% of the microphytoplankton throughout the tidal cycle. Dinoflagellates made a mean contribution of 3% on the surface and 6% near the bottom, due to the presence of species with benthonic habits (Order Prorocentrales) (TOMAS, 1997). The other groups, represented especially by phytoflagellates but also by cyanobacteria and chlorophytes presented a higher contribution near the bottom during the flood tide maximum high, corresponding to 9% of the microphytoplankton. A complete list of the taxa identified in this study is presented in Table 2.
Species richness was high at both depths, with a mean value of 28 species. On the surface, the higher values (34) corresponded to the ebb tide and its maxima. At the bottom, the higher values
(44) occurred during the flood tide maximum high. These results can be linked to the higher current speed at both depths, probably contributing to the importation of cells and the mixture of water masses (marine and freshwater). The higher current speed provides physical disturbance, which according to the
“intermediate disturbance hypothesis” prevents
competitively dominant species from excluding other species from the community, and so increasing the species richness (GRIME, 1973; CONNEL 1978). Diversity and evenness were low at both depths, indicating that some species dominate the phytoplankton community. The most abundant species were Leptocylindrus minimus, Leptocylindrus danicus, Guinardia spp, Dactyliosolen fragilissimus, Skeletonema costatum and species of the Pseudo-nitzschia complex.
Phytoplankton biomass varied between 6.2 µgC L-1 and 93 µgC L-1 (Fig. 2) with a mean of 29.5 µgC L-1. The values were higher near the bottom, reaching a maximum during the flood tide, together with the maximum values found for cell density. The minimum was observed during the ebb tide (7.8 µgC L-1). At the surface, biomass varied from 33.55 µgC L-1 during flood tide to 6.23 µgC L-1 during ebb tide. The values found for the Cananéia-Iguape system (BARRERA-ALBA et al., 2007) were superior, reaching 284 µgC L-1 inside the estuary and 199 µgC L-1 in the connection with the ocean. Again, these results can be explained because Cananéia-Iguape is an eutrophic estuary.
Despite the clear dominance of diatoms during this survey (diatom densities were 40 times higher than those of dinoflagellates densities), dinoflagellates contributed considerably in terms of biomass, since diatom biomass was only twice greater than that of the dinoflagellates. These results are observed because a single cell of a dinoflagellate contains much more carbon per volume than a single cell of a diatom (e.g. Prorocentrum, 2283.8 pgC L-1; Leptocylindrus danicus, 25.7 pgC L-1). This may be due the presence of vacuoles in the cell structure of many diatoms (STRATHMANN, 1967).
cyanobacteria. These organisms are elongated and despite their huge dimensions, have high S/V ratios. This feature contributes to their development under low light conditions, but they need high nutrient concentration and turbulence to develop. C-strategists were represented only by Navicula sp, which presented small cells, with high growth rates and S/V ratio, and S-strategists represented by the dinoflagellates and the chlorophytes. S-strategists are characterized by low S/V ratio, mixotrophy and the ability to undertake vertical migration, this strategy being dominant in oligotrophic systems (REYNOLDS, 1988). SMAYDA and REYNOLDS (2001) identified nine life-forms among C-S-R strategies in different marine habitats. The present study was limited to one habitat, thus all dinoflagellates were classified as S-strategists
according to life-form type II
(Peridinians/Prorocentroids), in other words summer bloom taxa, such as Scrippsiella trochoidea and Prorocentrum micans, identified here and present in habitats with substantially elevated nutrient concentration.
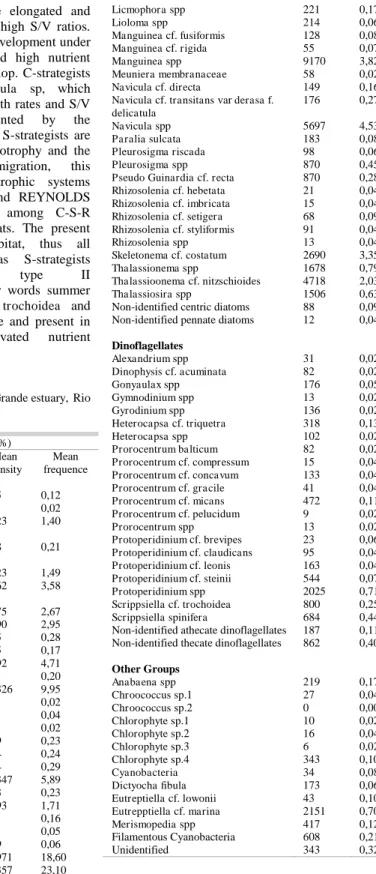
Table 2. List of identified taxa in Barra Grande estuary, Rio de Janeiro (Brazil).
Mean density (cell L⁻¹) and mean frequence (%)
Taxon Mean
Density
Mean frequence Diatoms
Anaulus australis 255 0,12
Chaetoceros spp 10 0,02
Cylindrotheca closterium/Nitzschia longissima complex
1623 1,40
Cylindrotheca closterium/Nitzschia reversa complex
198 0,21
Diploneis-Raphoneis complex 1823 1,49
Pseudo-nitzschia cf. delicatissima complex
7762 3,58
Pseudo-nitzschia complex 3975 2,67 Pseudo-nizschia seriata complex 4890 2,95
Raphoneis spp 405 0,28
Cyclotella spp 225 0,17
Cylindrotheca cf. closterium 5392 4,71 Dactyliosolen cf. phuketensis 621 0,20 Dactyliosolen fragillissimus 18326 9,95 Diploneis cf. crabro 10 0,02
Diploneis spp 22 0,04
Eucampia cf. zodiacus 82 0,02
Tropidoneis spp 229 0,23
Guinardia cf. cylindrus 344 0,24 Guinardia cf. flaccida 814 0,29 Guinardia delicatula 14347 5,89
Guinardia spp 313 0,23
Guinardia striata 4493 1,71
Gyrosigma cf. fasciola 78 0,16
Gyrosigma spp 68 0,05
Helicotheca spp 169 0,06
Leptocylindricus cf. danicus 40971 18,60 Leptocylindricus cf. minimus 54357 23,10
Licmophora spp 221 0,17
Lioloma spp 214 0,06
Manguinea cf. fusiformis 128 0,08 Manguinea cf. rigida 55 0,07
Manguinea spp 9170 3,82
Meuniera membranaceae 58 0,02 Navicula cf. directa 149 0,16 Navicula cf. transitans var derasa f.
delicatula
176 0,27
Navicula spp 5697 4,53
Paralia sulcata 183 0,08
Pleurosigma riscada 98 0,06
Pleurosigma spp 870 0,45
Pseudo Guinardia cf. recta 870 0,28 Rhizosolenia cf. hebetata 21 0,04 Rhizosolenia cf. imbricata 15 0,04 Rhizosolenia cf. setigera 68 0,09 Rhizosolenia cf. styliformis 91 0,04
Rhizosolenia spp 13 0,04
Skeletonema cf. costatum 2690 3,35 Thalassionema spp 1678 0,79 Thalassioonema cf. nitzschioides 4718 2,03 Thalassiosira spp 1506 0,63 Non-identified centric diatoms 88 0,09 Non-identified pennate diatoms 12 0,04
Dinoflagellates
Alexandrium spp 31 0,02
Dinophysis cf. acuminata 82 0,02
Gonyaulax spp 176 0,05
Gymnodinium spp 13 0,02
Gyrodinium spp 136 0,02
Heterocapsa cf. triquetra 318 0,13
Heterocapsa spp 102 0,02
Prorocentrum balticum 82 0,02 Prorocentrum cf. compressum 15 0,04 Prorocentrum cf. concavum 133 0,04 Prorocentrum cf. gracile 41 0,04 Prorocentrum cf. micans 472 0,11 Prorocentrum cf. pelucidum 9 0,02
Prorocentrum spp 13 0,02
Protoperidinium cf. brevipes 23 0,06 Protoperidinium cf. claudicans 95 0,04 Protoperidinium cf. leonis 163 0,04 Protoperidinium cf. steinii 544 0,07 Protoperidinium spp 2025 0,71 Scrippsiella cf. trochoidea 800 0,25 Scrippsiella spinifera 684 0,44 Non-identified athecate dinoflagellates 187 0,11 Non-identified thecate dinoflagellates 862 0,40
Other Groups
Anabaena spp 219 0,17
Chroococcus sp.1 27 0,04
Chroococcus sp.2 0 0,00
Chlorophyte sp.1 10 0,02
Chlorophyte sp.2 16 0,04
Chlorophyte sp.3 6 0,02
Chlorophyte sp.4 343 0,10
Cyanobacteria 34 0,08
Dictyocha fibula 173 0,06
Eutreptiella cf. lowonii 43 0,10 Eutrepptiella cf. marina 2151 0,70
Merismopedia spp 417 0,12
Filamentous Cyanobacteria 608 0,21
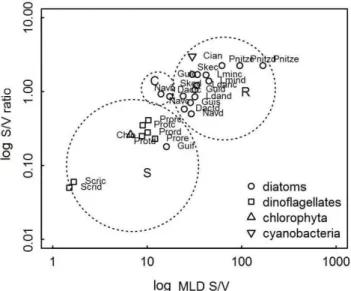
Fig. 2. Distribution of the fourteen taxa selected for the classification in C-S-R strategies determined by their S/V ratio and the product of their MLD and S/V. The codes of the species are the same as in table 3. S/V ratio in μm-1.
Statistical analyses showed that the C-S-R strategists described above differ significantly (ANOSIM test: R = 0.75; p = 0.001). This result indicates that the morphological trait-based approach is useful for describing the phytoplankton community, as stated above (SOURNIA, 1982; REYNOLDS, 1988; LITCHMAN; KLAUSMEIER, 2008). The CCA showed that the pattern observed at the surface differs from that at the bottom, and showed clear differences between the variables that regulate the distribution of
the R and the S species (Fig. 3). R species were associated with nutrients (ebb tide) whereas S species were associated with rapid current and salinity (flood tide). The first group needs high nutrient concentrations to develop and the second group (mainly dinoflagellates) composed of marine species, live in association with the bottom, thus explaining their correlation with current speed and higher salinity (Fig. 3).
Table 3. Selected species for functional classification and their main characteristics. MLD (µm) – maximum linear dimension; SA (µm2) – surface area; BV (µm3) – biovolume.
Diatoms Code Cell Shape MLD SA BV S/V
Leptocylindrus cf. minimus Lminc cylinder 25 206.06 122.66 1.68
Lmind cylinder 32.5 320.28 229.61 1.39
Leptocylindrus cf. danicus Ldanc cylinder 27.5 321.46 264.45 1.22
Ldand cylinder 37.5 628 735.94 0.85
Dactyliosolen cf. fragilissimus Dactc cylinder 27.5 471 539.69 0.87
Dactd cylinder 42.5 1089.19 1876.64 0.58
Guinardia delicatula Guidb cylinder 17.5 147.19 85.86 1.71
Guidc cylinder 30 401.92 376.8 1.07
Guinardia striata Guis cylinder 40 810.12 1130.4 0.72 Guinardia flaccida Guif cylinder 87.5 7850 42929.69 0.18 Skeletonema cf. costatum Skeb cylinder 20 166.81 98.13 1.7
Skec cylinder 27.5 321.46 264.45 1.22
Pseudo-nitzschia complex Pnitzc prism on
parallelogram-base 27.5 61.89 27.5 2.25
Pnitzd prism on
parallelogram-base 42.5 95.64 42.5 2.25
Pnitze prism on
parallelogram-base 75 168.76 75 2.25 Navicula spp. Navb prism on elliptic base 15 274.75 294.38 0.93
Navc prism on elliptic base 20 408.2 471 0.87
Navd prism on elliptic base 42.5 1361.98 2001.75 0.68
Dinoflagellates
Protoperidinium spp. Protc double cone 25 1188.12 3311.72 0.36
Protd double cone 35 2437.08 9673.49 0.25
Scrippsiella spp. Scric ellipsoid 25 441.56 6623.44 0.07
Scrid ellipsoid 27.5 593.66 10883.7 0.05
Prorocentrum spp. Prorc cone 25 1365.83 3311.72 0.41
Prord cone 35 2798.13 9673.49 0.29
Prore cone 55 4133.17 17629.79 0.23
Other Groups
Cyanobacteria Cyan sphere 10 12.56 4.19 3
Chlorophyta Chlo sphere 25 1589.63 5961.09 0.27
To better understand the phytoplankton community of Barra Grande estuary, it is important to investigate more tidal cycles as well as the seasonal temporal distribution. Nevertheless, this is the first published data on the phytoplankton community of Ilha Grande Bay, a touristic area of Rio de Janeiro state containing more than 10 protected areas, which
This study is part of the OTRANSCO (Organic Carbon Origin and Transport in Barra Grande Estuary) project, granted by FAPERJ.
A
CKNOWLEDGMENTSThis work was supported by FAPERJ (Foundation for Research Support of Rio de Janeiro state) and is part of the OTRANSCO project. We wish to thank the people who helped during sampling operations and to acknowledge the support of CEADS (Center of Environmental Studies and Sustainable Development) during the experiment.
R
EFERENCESALVES-DE-SOUZA, C.; GONZALEZ, M. T.; IRIARTE, J. L. Functional groups in marine phytoplankton assemblages dominated by diatoms in fjords of southern Chile. J. Plankton Res., v. 30, n. 11, p. 1233– 1243, 16 jul. 2008.
BARRERA-ALBA, J. J.; GIANESELLA, S. M .F.; SALDANHA-CORRÊA, F. M. P.; MOSER, G. A. M. Influence of artificial channel in a well-preserved sub-tropical estuary. J. Coast. Res., v. 50, p. 1137-1141, 2007.
BÉRGAMO, A. L. ; MIRANDA, L. B. ; FONTES, R. F. C. Current measurements and volume transport in the Baía de Guanabara entrance (Rio de Janeiro, RJ). In: Oceanografia e Mudanças Globais. Elisabete de Santis Braga. (Org.). 1ed. São Paulo: Instituto Oceanográfico da Universidade de São Paulo, 2008, p. 357-369.
BRUNET, C.; LIZON, F. Tidal and diel periodicities of size-fractioned phytoplankton pigment signatures at an offshore station in the southeastern English Channel. Est. Coast. Shelf Sci., v. 56, p. 833-843, 2003. BONILLA, S.; CONDE, D.; AUBRIOT, L.; PÉREZ, M. C.
Infuence of hydrology and nutrients on phytoplankton species composition and life strategies in a subtropical coastal lagoon. Estuaries., v. 28, p. 884-895, 2005.
BUCCI, A. F.; CIOTTI, A. M.; POLLERY, R. C. G.; CARVALHO, R.; ALBUQUERQUE, H. C.; TOMIDA, L. Temporal variability of chlorophyll-a in the são vicente estuary. Braz. J. Oceanogr., v. 60, n. 4, p. 485-499, 2012.
CLOERN, J. E. Tidal stirring and phytoplankton bloom dynamics in estuaries. J. Mar. Res., v.49, p. 103-221, 1991.
CONNEL, J. H. Diversity in tropical rain forests and coral reefs. Science., v. 199, p. 1302-1309, 1978.
CUPP, E. E. Marine plankton diatoms of the West Coast of North America. Bull. Scripps. Inst. Oceanogr., v.5, p. 1-237, 1943.
DEMERS, S.; LAFLEUR, P. E.; LEGENDRE, L. Short-term covariability of chlorophyll and temperature in the St. Lawrence Estuary. J. Fish. Res. Board Can., v. 36, p. 568-573, 1979.
GOOSEN, N. K.; KROMKAMP, J. PEENE, J. RIJSWIJK, P. BREUGEL, P. Bacterial and phytoplankton production in the maximum turbidity zone of three European estuaries: the Elbe, Westerschelde and Gironde. J. Mar. Syst., v. 22, p. 151-171, 1999. GRIME, J. P. Control of species density in herbaceous
vegetation. J. Environ. Manag., v. 242, p. 344-347, 1973.
HANSEN, H. P.; KOROLEFF, F. Determination of nutrients. In: Methods of Seawater Analysis. GRASSHOFF, K.; KREMLING,K.; EHRHARDT. (Ed. Weinheim), New York; Chiester; Brisbane; Singapore;Toronto: Wiley-VCH 1999, Cap 10, p. 159-226, 1983.
HANSEN, D. V; RATTRAY, M. New dimensions in estuary classification. Limnol. Oceanogr., v. 11, p. 319-326, 1966.
HANSSON, L-A. Diurnal recruitment patterns in algae: effects of light cycles and stratified conditions. J. Phycol., v. 31, p. 540-546, 1995.
HELBLING, E. W.; PÉREZ, D. E.; MEDINA, C. D.; LAGUNAS, M. G.; VILLAFAÑE, V. E. Phytoplankton distribution and photosysthesis dynamics in the Chubut River estuary (Patagonia, Argentina) throughout tidal cycles. Limnol. Oceanogr., v. 55, p. 55-65, 2010.
HILLEBRAND, H.; DURSELEN, C-D.; KIRSCHTEL, D.; POLLINGHER, U.; ZOHARY, T. Biovolume calculation for pelagic and benthic microalgae. Phycol., v. 424, p. 403–424, 1999.
IGNATIADES, L.; ASSIMAKOPOULOU, E.; GOTSIS-SKRETAS, O. Phytoplankton size-based dynamics in the Aegean Sea (Eastern Mediterranean). J. Mar. Sci., v. 36, p. 11-28, 2002.
JOUENNE, F.; LEFEBVRE, S.; VÉRON, B.; LAGADEUC, Y. Biological and physicochemical factors controlling short-term variability in phytoplankton primary production and photosynthetic parameters in a macrotidal system (eastern English Channel). Est. Coast. Shelf Sci., v. 65, p. 421-439, 2005.
LEGENDRE, L.; DEMERS, S. Towards dynamic biological oceanography and limnology. Can. J. Fish. Aquat. Sci., v. 41, p. 2-19, 1984.
LEWIS, W. L. Surface/volume ratio: implications for phytoplankton morphology. Science., v. 192, p. 885-887, 1976.
LITCHMAN, E.; KLAUSMEIER, C. A. Trait-Based Community Ecology of Phytoplankton. Annu. Rev. Ecol. Evol. Syst., v. 39, n. 1, p. 615–639, 2008. LUND, J. W. G. Primary production and periodicity in
phytoplankton. Verhandl. Intern. Ver. Limnol., v. 15, p. 37-56. 1964.
MACEDO, M.; DUARTE, P.; MENDES, P.; FERREIRA, J. Annual variation of environmental variables, phytoplankton species composition and photosynthetic parameters in a coastal lagoon. J. Plankton Res., v. 23, p. 719-732, 2001.
MARGALEF, R. Life-forms of phytoplankton as survival alternatives in an unstable environment. Oceanol. Acta., v. 1, p. 493-509, 1978.
MCGILL, B. J.; ENQUIST, B. J.; WEIHER, E.; WESTOBY, M. Rebuilding community ecology from functional traits. Tren. Ecol. Evo., v. 21, n. 4, p. 178-185, 2006.
MENDEN-DEUER, S.; LESSARD, E. J. Carbon to volume relationships for dinoflagellates, diatoms, and other protist plankton. Limnol. Oceanogr., v. 45, n. 3, p. 569–579, 2000.
MIRANDA, L. B.; CASTRO, B. M.; KJERFVE, B. Classificação dos Estuários In: Princípios de Oceanografia Física em Estuários. IV ed. São Paulo: Editora da Universidade de São Paulo, 2002. Cap. 3, p. 49-97.
MOSER, G. A O.; CIOTII, A. M.; GIANNINI, M. F. C.; TONINI, R. T.; HARARI, J. Changes in phytoplankton composition in response to tides, wind-induced mixing conditions, and freshwater outflows in an urbanised estuarine complex. Braz. J. Biol., v. 72, n. 1, p. 97-111, 2012.
MOSER. G.A.O.; TAKANOHASHI, R.A.; CHAGAS BRAZ, M. de; LIMA, D.T. de; KIRSTEN, F.V.; GUERRA, J.V.; FERNANDES, A.M.; POLLERY, R.A. Phytoplankton spatial distribution on the continental shelf off Rio de Janeiro, from Paraíba do Sul river to Cabo Frio. Hydrobiol., v. 728, p.1-21, 2014.
MURREL, M. C. Phytoplankton and zooplankton seasonal dynamics in a subtropical estuary: importance of cyanobacteria. J. Plankton Res., v. 26, n. 3, p. 371-382, 16 fev. 2004.
NASELLI-FLORES, L.; PADISÁK, J.; ALBAY, M. Shape and size in phytoplankton ecology: do they matter? Hydrobiol., v. 578, p. 157-161, 2007.
OLENINA, I. et al. Biovolumes and Size-Classes of Phytoplankton in the Baltic Sea. Baltic Sea Environ. Proc., n. 106, 2006.
PARANHOS, R.; PEREIRA, A. P.; MAYR, L. M. Diel variability of water quality in a tropical polluted bay. Environ. Monit. Assess., v.50, p. 131-141, 1998 PRITCHARD, D. W. The dynamic structure of a coastal
plain estuary. J. Mar. Res., p. 33-42, 1956.
REYNOLDS, C. S. Funtional morphology and the adaptive strategies of freshwater phytoplankton. In: Growth and Reproductive Strategies of Freshwater Phytoplankton. Sandgren, C. D. (ed.), Cambridge University Press, 1988. p. 388-433.
REYNOLDS, C. S.; HUSZAR, V.; KRUK, C. Towards a functional classification of the freshwater phytoplankton. J. Plankton Res., v. 24, p. 417-428, 2002.
SEIP, K. L.; REYNOLDS, C. S. Phytoplankton functional attributes along trophic gradient and season. Limnol. Oceanogr., v. 40, n3. P. 589-597, 1995.
SEURONT, L.; SCHMITT, F.; LAGADEUC, Y. Turbulence intermittency, small-scale phytoplankton patchiness and encounter rates in plankton: where do we go from here? Deep-Sea Res. Part I., v. 48, p. 1199-1215, 2001.
SMAYDA, T. J.; REYNOLDS, C. S. Community assembly in marine phytoplankton; application of recent models to harmful dinoflagellate blooms. J. Plankton Res., v. 23, p. 447-461, 2001.
SOURNIA, A. Form and Function in Marine Phytoplankton. Biol. Rev., v. 57, n. 3, p. 347–394, ago. 1982.
SOUZA, A. P. R. D.; BRAGA, E. S.; BERTOTTI, M. On Site Stripping Voltammetric Determination of Zn(II), Cd(II) and Pb(II) in Water Samples of the Cananéia-Iguape Estuarine-Lagoon Complex in São Paulo State, Brazil. J. Braz. Chem. Soc., v. 23, n. 7, p. 1320-1326, 2012.
STRATHMANN, R. Estimating the organic carbon content of phytoplankton from cell volume or plasma volume. Limnol. Oceanogr., v. 12, p. 411–418, 1967. SUN, J.; LIU, D. Geometric models for calculating cell
biovolume and surface area for phytoplankton. J. Plankton Res., v. 25, n. 11, p. 1331-1346, 2003. TOMAS C. R. Identifying Marine Phytoplankton. New
York: Academic Press, 1997.
TREMBLAY, É.; LEGENDRE, L.; THERRIAULT, J.-C. Size-differential Effects of Vertical Stability on the Biomass and Production of Phytoplankton in a Large Estuarine System. Est. Coast. Shelf Sci., v. 45, n. 4, p. 415-431, out. 1997.
UTERMOHL, H. Perccionamento del Metodo Cuantitativo del Fitoplancton. Associación Internacional de Limnologia Teórica y Aplicada - Comité de métodos limnologicos, comunicación, v.9, p. 1-39, 1958.
VARGAS, C. A. et al. The relative importance of microbial and classical food webs in a highly productive coastal upwelling area. Limnol. Oceanogr., v. 52, n. 4, p. 1495-1510, 2007.
VERITY, P. G.; ROBERTSON, C. Y.; TRONZON, C. R.; ANDREWS, M. G.; NELSON, J. R.; SIERACKI, M. E. Relationships between cell volume and the carbon and nitrogen content of marine photosyntretic nanoplankton. Limnol. Oceanogr., v. 37, n. 3, p. 1434-1446, 1992.
VILLAC, M. C.; TENENBAUM, D. R. The phytoplankton of Guanabara Bay, Brazil. I. Historical account of its biodiversity. Biot. Neotrop., v. 10, p. 271-293, 2010. WETZ, M. S.; HAYES, K. C.; LEWITUS, A. J.; WOLNY,
J. L.; WHITE, D. L. Variability in phytoplankton pigment biomass and taxonomic composition over tidal cycles in a salt march estuary. Mar. Ecol. Prog. Ser., v. 320, p. 109-120, 2006.