DISTRIBUTION OF PARACALANIDAE SPECIES (COPEPODA, CRUSTACEA) IN
THE CONTINENTAL SHELF OFF SERGIPE AND ALAGOAS STATES,
NORTHEAST BRAZIL*
Hortência Maria Pereira Araujo
Universidade Federal de Sergipe - Laboratório de Zooplâncton, Departamento de Biologia (Av. Marechal Rondon s/n, Jardim Rosa Elze, 49.100-000 São Cristóvão, SE, Brasil)
A
B S T R A C TThe spatial and seasonal distribution of the Paracalanidae species were studied in eighteen stations in the continental shelf off Sergipe and Alagoas States, northeast Brazil, in December, 2001 and 2003, and in June, 2002 and 2003. The Paracalanidae family was constituted by coastal and shelf species such as Parvocalanus crassirostris, Paracalanus quasimodo, P. indicus and P. aculeatus and oceanic species, Calocalanus pavo and Acrocalanus longicornis. Density values were higher in stations located at 10 m isobath with respect to those located at 20 and 30 m depths. Paracalanidae abundance presented differences between seasons with values higher in June (2002, 2003) than in December (2001, 2002). All species were more abundant in the rainy season except Parvocalanus crassirostris. Paracalanus quasimodo was the dominant species with average densities of 949, 740 and 41 ind.m-3
in December months and 4231, 2389 and 1185 ind.m-3 in June months, at stations with local depths of
10, 20 and 30 m, respectively. Canonical correspondence analysis showed that salinity and temperature were the environmental variables that presented significant correlation with the distribution of Paracalanidae species, probably because these variables are influenced by the estuarine waters and by the dynamic of oceanic water masses in the continental shelf.
R
E S U M OA distribuição espacial e sazonal das espécies de Paracalanidae foram estudadas em dezoito estações na plataforma continental dos Estados de Sergipe e Alagoas, nordeste do Brasil, em dezembro de 2001 e 2003 e junho de 2002 e 2003. A família Paracalanidae esteve constituída por espécies costeiras e de plataforma tais como Parvocalanus crassirostris, Paracalanus quasimodo, P. indicus e P. aculeatus e por espécies oceânicas, Calocalanus pavo e Acrocalanus longicornis. Os valores de densidade total foram mais elevados nas estações localizadas em isóbata de 10 m decrescendo nas estações localizadas em profundidades de 20 e 30 m. A abundância de Paracalanidae apresentou padrão de flutuação sazonal, com valores mais elevados em junho (2002, 2003) do que em dezembro (2001, 2002). Todas as espécies foram mais abundantes no período chuvoso com exceção do Parvocalanus crassirostris.Paracalanus quasimodo foi a espécie dominante, com densidades médias de 949, 740 e 41 ind.m-3, nos meses de dezembro e de 4231, 2389 e 1185 ind.m-3, nos meses de
junho, em isóbatas de 10, 20 e 30 m, respectivamente. A análise de correspondência canônica mostrou que a salinidade e a temperatura foram os fatores ambientais que apresentaram relação significativa com a distribuição das espécies de Paracalanidae, provavelmente porque estes fatores foram influenciados pelas águas estuarinas e pela dinâmica das massas de água oceânicas na plataforma continental.
Descriptors: Alagoas, Sergipe, Brazil, Tropical, Zooplankton, Paracalanidae. Descritores: Alagoas, Sergipe, Brasil, Tropical, Zooplâncton, Paracalanidae.
I
NTRODUCTIONThe continental shelf off Sergipe and Alagoas is narrow varying from 18 km at the extreme south of this area to 42 km in front of the city of Maceió. It has an average width of 30 km. Most part
__________
(*) Paper presented at the 2nd Brazilian Congress of
Oceanography, on 09-12 October, Vitória, Brazil.
The shelf and oceanic areas of the northeast Brazil are affected by the Tropical (TW) and South Atlantic Central Waters (SACW). The SACW (temperature < 20 ºC and salinity < 36.4 psu) cover the upper ocean of the subtropical South Atlantic and spreads northward underneath the Tropical Water (temperature > 20ºC and salinity > 36,4 psu) (Stramma
et al., 1990; Castro & Miranda, 1998).
Five estuaries (São Francisco, Japaratuba, Sergipe, Vaza-Barris and Piauí-Real) discharge their waters into the Sergipe coast. The most important river is the São Francisco with 3161 km of lenght and 2850 m3.s-1 of average outflow (Cunha & Guerra, 2003).
Copepods are numerous and abundant and they may sometimes form up to 90-97% of the biomass of marine zooplankton. Therefore, copepods are an important link in marine food webs and marine economy (Bradford-Grieve et al., 1999). The Paracalanidae family is compounded by the genera
Acrocalanus, Bestiolina, Calocalanus, Delius,
Paracalanus and Parvocalanus and from these only
Bestiolina has not been registered in the South Atlantic (op. cit.). Paracalanus is one of the most important genus in the neritic region of the Brazilian coast and according to Lopes et al. (1999) its distribution pattern mirrored that of total copepods.
In the shelf and open ocean off northeast Brazil the Paracalanidae family is represented by
Paracalanus aculeatus, P. quasimodo, Parvocalanus crassirostris, Acrocalanus longicornis, Calocalanus pavo and C. pavoninus (Araujo et al., 1991; Neumann-Leitão et al., 1998; 1999). In the southeast and south,
besides the species mentioned Paracalanus indicus, P. campaneri, P. nanus, P. parvus and Calocalanus contractus were also registered (Björnberg, 1980; Campaner, 1985; Valentin & Monteiro-Ribas, 1993; Dias, 1996; Vega-Pérez & Hernandez, 1997; Lopes et al., 1999). Paracalanus quasimodo has been cited as the most abundant species and is associated to coastal and neritic waters (Björnberg, 1980; 1981; Vega-Pérez & Hernandez, 1997; Lopes et al., 1999).
The present study was part of a large monitoring program on the continental shelf off Sergipe and Alagoas, where the company Petróleo Brasileiro S.A. develops its activities of gas and oil production. This paper describes the spatial and seasonal distribution of the Paracalanidae species collected in eighteen stations in December 2001, 2002 and June 2002, 2003.
M
ATERIAL ANDM
ETHODSSampling and Sample Processing
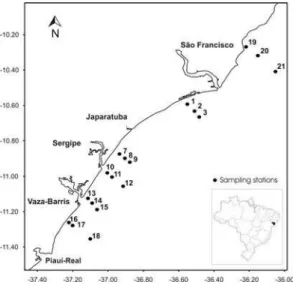
The studied area is located in the northeastern coast of Brazil (Lat. 10º30’ and 11º27’S; Long. 36º20’ and 37º16’W).
Sampling was carried out in eighteen stations during the dry season (December 2001, 2002) and the rainy season (June 2002, 2003) on the continental shelf off Sergipe and Alagoas States. The stations were positioned at 10, 20 and 30 m isobaths along six transects, perpendicular to the shore line (Fig. 1).
Water samples were taken with a Van Dorn bottle at two levels in the water column (surface and near the bottom) to analyze the environmental variables including salinity (refratometer), pH (digital pH meter), dissolved oxygen and chlorophyll-a
(Strickland & Parsons, 1965) and nutrients (ammonia, nitrite, nitrate, phosphate and silicate – according to APHA,1995). In each station, water temperature (oC) and water transparency (Secchi disc) were also determined before each plankton haul.
Oblique plankton tows were done during the day, using a plankton net with a 200 µm mesh size and 0.60 m diameter. A General Oceanic flowmeter was adjusted to the net mouth for measuring the water volume sampled during each haul. Samples were preserved in a buffered 4% formaldehyde solution.
Taxonomic composition and abundance were determined in subsamples obtained with a 5 ml Stempel pipette. The species abundance was expressed as number of individuals per cubic meter (ind.m-3).
Data Analysis
The cluster analysis was applied to the density matrix, after being normalized by log (x+1) transformation. The Bray Curtis dissimilarity coefficient and the Ward cluster method were used. The species were codified by four letters, the first two corresponding to genus name and the other two to species name.
Association among the copepod community and environmental variables were analyzed using canonical correspondence analysis - CCA with the Canoco program (ter Braak, 1987; 1989). The relation between the inertia associated with CCA and the inertia of CA (correspondence analysis) indicated the extent to which the measured variables explained the variability in the species community. The robustness of this analysis was determined using the Monte Carlo’s permutation test (ter Braak, 1986).
R
ESULTSDuring the studied period the water temperature values ranged from 23.0 at station 9 (bottom layer) to 29.5ºC at station 17 (surface and bottom layers). Maximum differences between surface and bottom temperatures values were registered in December, 2001 at station 2 (3.0ºC), station 3 (2.5ºC), stations 9 and 12 (2.0ºC) and in December, 2002 at stations 2 and 3 (2.0ºC) (Table 1).
Salinity varied from 25.8 psu at station 3 (surface layer) to 39.3 psu at station 20 (bottom layer), both values registered in the rainy months (Table 1). In most stations salinity values of the bottom layer were slightly higher than those of the surface. However a higher salinity gradient was observed at stations 1, 2 and 3, located in the São Francisco plume, especially
in June, 2002 (station 2 - 12.3 psu and station 3 – 13.3 psu).
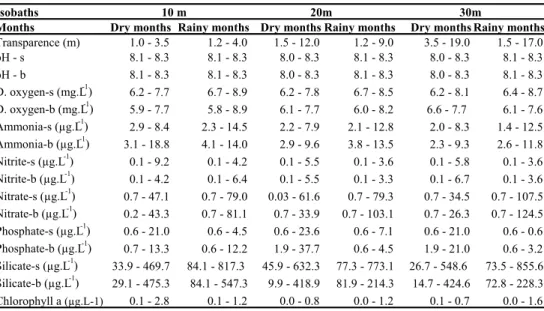
Dissolved oxygen ranged from 5.8 mg.L-1 at the 10 m isobath (bottom) to 8.9 mg.L-1 at the 10 m isobath (both layers). Higher values were measured in the rainy months in the surface layer of the water column. The pH values were above 8.0 in all water samples. Chlorophyll-a concentrations were low in general and its highest value was 2.8 µg.L-1 measured
at the 10 m isobath in the dry season (Table 2). Ammonia, nitrate and silicate were higher in the rainy months and nitrite and phosphate in the dry months. In the continental shelf off Sergipe and Alagoas, nutrients (ammonia, nitrite, nitrate and phosphate) presented great variation, with the following ranges: ammonia (1.4 µg.L-1 – 30 m to 18.8 µg.L-1 – 10 m); nitrite (0.1µg.L-1 to 9.2 µg.L-1 – both in 10 m); nitrate (0.03 µg.L-1 – 20 m to 124.5 µg.L-1 – 30 m); phosphate (0.6 µg.L-1 to 37.7 µg.L-1 – 20 m); silicate (9.9 µg.L-1 – 20 m to 855.6 µg.L-1 – 30 m) (Table 2).
The Paracalanidae family was represented by six species: Paracalanus quasimodo Bowman, 1971;
Paracalanus indicus Wolfenden, 1905; Paracalanus
aculeatus Giesbrecht, 1888; Parvocalanus
crassirostris F. Dahl, 1894; Calocalanus pavo (Dana, 1849) and Acrocalanus longicornis Giesbrecht, 1888.
Paracalanidae species densities in the continental shelf off Sergipe and Alagoas presented spatial and seasonal variations with higher values at the stations located at 10 m isobath and in the rainy season.
Paracalanus quasimodo was the dominant
species, recorded in 95.8% of all analyzed samples and its relative abundance considering all studied period was 76.7%. Mean density values considering the dry months were 949, 740 and 41 ind.m-3 and the rainy months were 4231, 2389 and 1185 ind.m-3 in the 10, 20 and 30 m isobaths, respectively (Table 3). In fact, 81.9% of individuals of this species were registered in the June months. Density values were higher in the rainy months when the greatest abundance (9909 ind.m3) was recorded at 10 m isobath. In the dry months the maximum of 6359 ind.m-3 was recorded at 20 m isobath. It was registered in salinity values between 25.8 and 39.3 psu and temperature values between 23.0 and 29.5ºC.
Paracalanus indicus occurred in 75% of the samples but the relative abundance was low (6.30%). Total means of the density values were 40, 53 and 19 ind.m-3 in the dry months and 164, 175 and 362 ind.m-3 in the rainy months at 10, 20 and 30 m
Table 1. Continental shelf off Sergipe and Alagoas. Temperature (ºC) and salinity (psu) values in December 2001/2002 and June 2002/2003, at 10, 20 and 30 m isobaths. Surface (s); Botton (b).
Table 2. Continental shelf off Sergipe and Alagoas. Value ranges of the environmental variables in the dry months (December 2001/2002) and in the rainy months (June 2002/2003) at 10, 20 and 30 m depths. Surface (s); bottom (b).
10m isobath
Stations 1 7 10 13 16 19 1 7 10 13 16 19 M
Salinity - s (psu) 36.6 35.5 36.0 35.2 35.2 35.1 36.2 35.7 35.6 35.5 35.7 36.3 36.3
Salinity - b (psu) 38.3 38.1 35.0 35.7 34.9 35.2 36.3 35.8 35.7 35.8 36.7 36.4 36.4
Temperature - s (ºC) 27.0 26.0 25.0 26.0 27.0 27.0 25.0 26.0 26.5 27.0 26.0 27.0 27.0
Temperature -b (ºC) 26.0 25.0 25.0 26.0 26.0 26.5 24.0 25.5 26.0 25.0 25.0 27.0 27.0
Salinity - s (psu) 35.0 37.7 38.6 36.9 37.0 37.3 29.9 32.5 34.4 35.4 35.6 35.7 35.5
Salinity - b (psu) 38.3 38.4 38.9 37.2 37.6 38.5 38.0 32.7 35.0 35.8 36.1 35.8 36.9
Temperature - s (ºC) 26.0 27.0 27.0 27.0 27.0 27.0 29.0 29.0 29.0 28.0 28.0 29.0 27.8
Temperature -b (ºC) 27.0 27.0 27.0 27.0 27.0 27.0 29.0 29.0 29.0 27.5 28.0 29.0 27.8
20m isobath
Stations 2 8 11 14 17 20 2 8 11 14 17 20
Salinity - s (psu) 34.0 35.1 35.7 34.8 34.8 35.4 33.3 35.6 35.4 35.3 35.7 36.4 35.1
Salinity - b (psu) 38.2 36.6 36.4 35.3 36.0 35.7 36.6 35.8 35.8 36.0 36.4 36.5 36.3
Temperature - s (ºC) 27.5 25.0 25.1 26.0 26.0 26.0 26.0 26.0 27.0 25.0 26.0 26.5 26.0
Temperature -b (ºC) 24.5 24.0 24.0 26.0 25.0 26.0 24.0 25.5 26.0 26.0 25.0 26.0 25.2
Salinity - s (psu) 26.5 38.4 38.8 37.2 36.6 38.0 37.2 31.7 35.5 34.8 36.0 36.0 35.6
Salinity - b (psu) 38.8 38.5 37.8 37.4 36.9 39.3 37.7 36.7 37.0 35.9 36.2 36.2 37.4
Temperature - s (ºC) 26.0 26.0 26.0 26.0 26.5 26.5 29.0 28.5 28.0 28.0 29.5 29.0 27.4
Temperature -b (ºC) 26.0 27.0 27.0 26.0 26.0 27.0 29.0 29.0 28.0 28.0 29.5 29.0 27.6
30m isobath
Stations 3 9 12 15 18 21 3 9 12 15 18 21
Salinity - s (psu) 36.2 35.5 36.4 35.8 35.7 35.6 34.2 35.7 35.3 35.5 35.9 36.2 35.7
Salinity - b (psu) 38.4 36.6 36.6 36.9 36.4 35.9 36.4 36.0 35.5 36.1 36.3 36.4 36.4
Temperature - s (ºC) 26.0 25.0 26.0 26.0 26.0 26.5 26.0 26.5 27.0 25.0 25.0 26.0 25.9
Temperature -b (ºC) 23.5 23.0 24.0 25.0 25.5 26.0 24.0 25.0 25.5 24.5 25.0 26.0 24.8
Salinity - s (psu) 25.8 38.7 38.4 37.4 36.8 38.9 37.1 33.6 35.3 36.3 36.4 36.4 35.9
Salinity - b (psu) 39.2 38.7 37.4 37.5 36.8 39.1 37.3 36.9 36.9 36.6 36.4 36.6 37.4
Temperature - s (ºC) 26.0 27.0 26.0 26.0 26.0 27.0 29.0 28.5 27.0 28.0 29.0 28.5 27.3
Temperature -b (ºC) 26.5 27.0 26.0 26.0 26.0 27.0 28.5 29.0 28.0 27.5 28.4 28.0 27.3
June 2003 June 2002
December/2001 December/2002
June 2003 June 2002
June 2002
December/2001 December/2002
June 2003
December/2001 December/2002
Isobaths Months
Transparence (m) pH - s
pH - b
D. oxygen-s (mg.L-1) D. oxygen-b (mg.L-1) Ammonia-s (µg.L-1) Ammonia-b (µg.L-1) Nitrite-s (µg.L-1) Nitrite-b (µg.L-1) Nitrate-s (µg.L-1) Nitrate-b (µg.L-1) Phosphate-s (µg.L-1) Phosphate-b (µg.L-1) Silicate-s (µg.L-1) Silicate-b (µg.L-1) Chlorophyll a (µg.L-1)
0.1 - 3.6 0.1 - 5.8
0.1 - 3.6 0.1 - 5.5
0.1 - 4.2 0.1 - 9.2
14.7 - 424.6 72.8 - 228.3 1.9 - 21.0 0.6 - 3.2 33.9 - 469.7 84.1 - 817.3 45.9 - 632.3 77.3 - 773.1
0.1 - 0.7 0.0 - 1.6 29.1 - 475.3 84.1 - 547.3 9.9 - 418.9 81.9 - 214.3
0.1 - 2.8 0.1 - 1.2 0.0 - 0.8 0.0 - 1.2
26.7 - 548.6 73.5 - 855.6 0.7 - 13.3 0.6 - 12.2 1.9 - 37.7 0.6 - 4.5
0.6 - 21.0 0.6 - 0.6 0.2 - 43.3 0.7 - 81.1
0.6 - 21.0 0.6 - 4.5 0.6 - 23.6 0.6 - 7.1 0.7 - 33.9 0.7 - 103.1
0.1 - 6.7 0.1 - 3.6 0.7 - 34.5 0.7 - 107.5 0.7 - 26.3 0.7 - 124.5 0.7 - 47.1 0.7 - 79.0 0.03 - 61.6 0.7 - 79.3
0.1 - 4.2 0.1 - 6.4 0.1 - 5.5 0.1 - 3.3
2.3 - 9.3 2.6 - 11.8 3.1 - 18.8 4.1 - 14.0 2.9 - 9.6 3.8 - 13.5
2.0 - 8.3 1.4 - 12.5 5.9 - 7.7 5.8 - 8.9
2.9 - 8.4 2.3 - 14.5 2.2 - 7.9 2.1 - 12.8 6.1 - 7.7 6.0 - 8.2
8.0 - 8.3 8.1 - 8.3 6.2 - 8.1 6.4 - 8.7 6.6 - 7.7 6.1 - 7.6 6.2 - 7.7 6.7 - 8.9 6.2 - 7.8 6.7 - 8.5
8.1 - 8.3 8.1 - 8.3 8.0 - 8.3 8.1 - 8.3
8.1 - 8.3 8.1 - 8.3 8.0 - 8.3 8.1 - 8.3 8.0 - 8.3 8.1 - 8.3 3.5 - 19.0 1.5 - 17.0
Dry monthsRainy months
1.0 - 3.5 1.2 - 4.0 1.5 - 12.0 1.2 - 9.0
Dry months Rainy months Dry months Rainy months
Paracalanus aculeatus was registered in 75% of the total samples but it was less abundant. This population compounded 3.9 % of the Paracalanidae assemblage during the studied period. Overall means of the density values were 24, 22 and 4 ind.m-3 in the dry months and 230, 146 and 57 ind.m-3 in the rainy months, at 10, 20 e 30 m isobaths, respectively. Densities were higher in the rainy months when the maximum abundance (1682 ind.m-3) was registered at 10 m isobath (Table 3). In the shelf off Sergipe and Alagoas P. aculeatus occurred in salinity values
between 25.8 and 39.3 psu, and temperature values between 23.5 and 29.5ºC.
Parvocalanus crassirostris occurred in 34.7% of the samples and its density values were low. This species was more frequent and abundant in stations located in the inner shelf during the dry season in contrast with the other species which presented higher densities in the rainy months. The maximum value was 329 ind.m-3, recorded at 10 m isobath (Table 3). The distribution of P. crassirostris occurred in salinity values between 29.9 and 38.3 psu and temperature values between 24.0 and 29.0°C.
Table 3. Continental shelf off Sergipe and Alagoas.Density values (ind.m-3) of the Paracalanidae species
in December 2001/2002 (dry months) and June 2002/2003 (rainy months) at 10, 20 and 30 m isobaths, monthly mean (MM) and total mean (TM).
Stations 1 7 10 13 16 19 MM 1 7 10 13 16 19 MM TM
Acrocalanus longicornis 0 0 0 0 0 7 1.2 0 0 0 0 0 0 0.0 1
Paracalanus aculeatus 11 17 30 0 7 14 13.0 28 45 0 95 47 0 35.7 24
Paracalanus indicus 0 100 123 0 59 0 47.0 0 0 9 152 16 26 33.8 40
Paracalanus quasimodo1652 2796 1165 708 1621 568 1418.4 57 101 249 1404 703 364 479.7 949
Paracalanus spp. 100 268 114 0 119 0 100.2 25 20 36 210 109 51 75.3 88
Parvocalanus crassirostris155 82 10 0 329 118 115.7 0 0 27 210 74 26 56.1 86
Calocalanus pavo 0 4 20 0 0 0 4.1 6 28 1 0 12 0 7.9 6
Acrocalanus longicornis 0 0 0 0 0 42 7.0 0 0 0 0 0 0 0.0 4
Paracalanus aculeatus 238 246 176 1682 194 211 457.9 0 7 0 7 2 0 2.7 230
Paracalanus indicus 0 0 22 1004 470 422 319.5 6 0 18 19 5 3 8.6 164
Paracalanus quasimodo9476 7485 4026 4828 3904 9909 6604.7 756 3380 1824 166 487 4533 1857.6 4231
Paracalanus spp. 0 0 44 841 745 7716 1557.7 60 34 18 5 25 23 27.5 793
Parvocalanus crassirostris 0 0 0 81 32 0 19.0 3 0 0 2 0 20 4.1 12
Calocalanus pavo 48 0 0 27 32 0 17.9 3 0 0 0 0 0 0.5 9
Stations 2 8 11 14 17 20 MM 2 8 11 14 17 20 MM TM
Acrocalanus longicornis 0 0 0 0 0 0 0.0 2 1 0 0 0 0 0.5 0,2
Paracalanus aculeatus 21 8 11 0 4 9 8.9 23 28 5 7 150 0 35.6 22
Paracalanus indicus 48 79 0 267 65 9 78.0 20 44 26 37 32 4 27.2 53
Paracalanus quasimodo 521 117 16 6359 516 677 1367.6 91 16 51 214 274 25 111.6 740
Paracalanus spp. 62 0 11 267 45 92 79.5 20 1 3 96 108 0 38.1 59
Parvocalanus crassirostris41 4 0 93 65 0 33.9 4 0 0 15 124 0 23.8 29
Calocalanus pavo 7 25 6 0 0 0 6.3 21 0 1 1 0 0 4.0 5
Acrocalanus longicornis 0 0 0 0 0 93 15.5 0 0 7 0 0 3 1.7 9
Paracalanus aculeatus 240 321 274 293 138 248 252.5 27 45 66 35 24 45 40.4 146
Paracalanus indicus 96 0 165 352 746 217 262.5 79 45 15 143 121 121 87.4 175
Paracalanus quasimodo6096 4125 2745 1702 2899 1208 3129.1 1320 4740 184 863 1360 1421 1647.9 2389
Paracalanus spp. 0 0 467 293 828 650 373.1 36 307 217 62 82 129 139.1 256
Parvocalanus crassirostris 0 0 0 0 0 0 0.0 0 15 0 4 0 0 3.1 2
Calocalanus pavo 0 0 137 0 0 217 59.0 6 0 0 0 2 5 2.3 31
Stations 3 9 12 15 18 21 MM 3 9 12 15 18 21 MM TM
Acrocalanus longicornis 0 0 0 0 0 0 0.0 0 0 0 0 0 6 1.0 0,5
Paracalanus aculeatus 5 0 0 12 0 0 2.9 8 3 0 9 3 1 4.3 4
Paracalanus indicus 0 0 0 37 0 14 8.4 37 20 0,5 76 36 10 30.0 19
Paracalanus quasimodo 5 0 18 16 2 16 9.5 280 8 0 96 31 19 72.3 41
Paracalanus spp. 0 0 0 0 0 0 0.0 100 0 0 20 0 0 20.0 10
Parvocalanus crassirostris 0 0 0 4 0 0 0.7 0 0 0 0 0 0 0.0 0
Calocalanus pavo 0 5 0 4 2 5 2.8 8 1 0 4 1 18 5.2 4
Acrocalanus longicornis 37 0 122 90 0 123 62.0 0 3 35 2 5 6 8.6 35
Paracalanus aculeatus 112 108 92 180 0 31 87.1 18 31 79 12 5 21 27.6 57
Paracalanus indicus 2433 31 900 0 276 727.9 21 9 223 58 4 25 56.6 362
Paracalanus quasimodo8122 1424 0 2099 28 123 1966.1 338 938 529 379 2 239 404.2 1185
Paracalanus spp. 1048 0 0 60 0 123 205.1 37 83 4 39 7 0 28.4 117
Parvocalanus crassirostris 0 0 0 0 0 0 0.0 0 3 0 0 0 0 0.5 0,2
Calocalanus pavo 225 39 122 270 85 184 154.1 7 0 4 0 12 4 4.7 79
June 2002 June 2003
20m Isobath
December 2001 December 2002
June 2002 June 2003
December 2001 December 2002
June 2003 June 2002
10m Isobath
30m Isobath
Calocalanus pavo and Acrocalanus longicornis
were mainly recorded at the 30 m isobath and presented low abundances. C. pavo presented a density peak (270 ind.m-3) in the rainy season. It was identified in 56% of all analyzed samples, in the salinity range from 25.8 to 39.3 psu, and in temperatures ranging from 23.5 to 29.5°C.
Acrocalanus longicornis presented maximum density (123 ind.m-3) in the rainy season. This species
occurred in salinities ranging from 25.8 to 39.3 psu and temperatures from 24.0 to 29.0ºC.
Cluster analysis revealed two groups of species. Group 1 compounded by oceanic species Calocalanus pavo and Acrocalanus longicornis and group 2 by coastal and shelf species such as Parvocalanus crassirostris, Paracalanus quasimodo, Paracalanus aculeatus, Paracalanus indicus and Paracalanus spp. (Fig. 2). Among the species of group 2 P. crassirostris
was far apart from the other ones because it is a coastal species whose abundance was high in the dry season and basically remains restrict to 10 m isobaths.
The correlation analyses between the abiotic and biotic variables performed by the canonical correspondence analysis (CCA) revealed that samples of December 2001 and 2002 were correlated directly to nitrite and phosphate and inversely correlated to temperature. Conversely the samples of June 2002 and 2003 were directly correlated to nitrate, ammonia and temperature. The spatial gradient was associated with depth and salinity. The measured variables explained 35% of biotic data variance. (Fig. 3).
The Monte Carlo permutation test revealed that the Paracalanidae species distribution presented
significant correlation to salinity, temperature and depth (p<0.05).
D
ISCUSSIONIn the shelf off Sergipe and Alagoas States the Paracalanidae family was constituted by coastal and shelf species such as Parvocalanus crassirostris,
Paracalanus quasimodo, P. indicus and P. aculeatus
and by oceanic species as Calocalanus pavo and
Acrocalanus longicornis. They are common copepods in the Brazilian coast and have been cited by Björnberg (1963; 1981), Valentin & Monteiro-Ribas (1993), Vega-Pérez & Hernandez (1997), Lopes et al. (1999) and Neumann-Leitão et al. (1999).
In the present study P. quasimodo was the dominant and most frequent species in all sampled months. The mean density values of this species were higher in the 10 m isobath, decreasing towards 20 and 30 m isobaths. It has been registered in other regions of the continental shelf off Northeast Brazil but not as one of the most abundant species (Neumann-Leitão et al., 1998; 1999). Björnberg (1963; 1980) characterized this species as abundant in coastal waters with salinity above 30 psu and in shelf waters of tropical regions. The dominance of P. quasimodo in the Brazilian shelf waters has been cited by Campaner (1985), Araujo et al. (1991), Vega-Pérez & Hernandez (1997) and Lopes
et al. (1999). It was also registered in the mouth of estuarine areas where tidal currents have a great influence (Montú & Cordeiro, 1988; Lopes, 1994; Eskinazi-Sant’Anna & Tundisi, 1996).
Fig. 3. Projection of stations, months and environmental variables on the first two axis of canonical correspondence analysis.
D = depth; S = salinity; T = temperature; Si = silicate; s = surface; b = bottom.
Paracalanus indicus seems to be a typically shelf species, more abundant in the 20 and 30 m isobaths. It was the second species in abundance as also recorded by Vega-Pérez & Hernandez (1997) and Lopes et al. (1999) in the Brazillian southeast shelf. P. indicus is a coastal and shelf species and jointly with P. quasimodo and P. aculeatus dominate most part of the Paracalanidae assemblages of the Brazilian coast (Björnberg, 1981; Bradford-Grieve et al., 1999).
P. aculeatus is an offshore and shelf species (González & Bowman, 1965; Bowman, 1971) and it has been recorded in the Brazilian coastal and shelf waters (Björnberg, 1963). It occurred in the dry and rainy months in all extension of the continental shelf off Sergipe and Alagoas as well.
P. crassirostris was more abundant on the inshore shelf, confirming its characteristics as an indicator species of coastal waters and reflecting the influence of estuarine outflow on the shelf. In Brazilian waters it was observed only in coastal or
mixed coastal and shelf waters (Björnberg, 1963) and belongs to the central complex of species that appear in all estuaries along the East coast of Brazil (Almeida Prado-Por & Lansac-Tôha, 1984).
Calocalanus pavo and Acrocalanus longicornis
were more abundant in the outer-shelf stations and in the rainy season. They are thermophile species, common in temperatures above 25°C (Björnberg, 1963). In the Northeastern Brazilian coast (Lat. 2 to 9o) C. pavo was the most abundant Paracalanidae species (Neumann-Leitão et al., 1999). In the dry months P. indicus and C. pavo presented higher abundance at stations located in the 20 m isobath while in the rainy months these populations were more abundant in the 30 m stations, probably avoiding low salinity waters of the inner shelf.
isobaths. Although this species had limited influence on community dynamics, its distribution may indicate the influence of oceanic water masses on the Sergipe and Alagoas shelf. Lopes et al. (1999) verified that copepod assemblages were strongly related to distinct water masses in the continental shelf off Rio de Janeiro.
The tropical zones of the oceans are usually considered to have low organic production and within this oligotrophic environment, trophic enrichments occur in response to wind-induced coastal upwelling along the continental shore (Dessier & Donguy, 1985). Besides the coastal upwelling contribution, the estuarine mangrove ecosystems play an important role as sources of food for marine food webs (Schwamborn
et al., 1999) and replenishes inorganic components, mainly phosphorates, nitrogenates and silicates (Eskinazi-Leça et al., 2004).
Although the identified species have been registered in all isobaths, in the dry and rainy months, abundance values of the Paracalanidae assemblage presented very clear spatial and temporal patterns. The spatial pattern included maximum densities at the inner shelf in both seasons and the seasonal pattern was characterized by high abundances in the rainy season, when the water flux from estuarine areas increased.
The CCA analysis showed that samples collected in December (2001, 2002) were associated directly to high nitrite and phosphate values and low temperatures. A slight vertical gradient of temperature was observed at stations located in the 20 and 30 m isobaths. Paes (2004) verified that in the December months the northeast winds transported surface waters (Ekman transport) and allowed the entrance of deep cold waters from SACW into the Sergipe shelf. The lowest temperatures were registered near the canyons of the São Francisco and Japaratuba rivers suggesting that coastal upwelling was occurring in these areas. In these months species densities were low.
In June (2002, 2003) samples were associated to high temperature, nitrate and ammonia values. A salinity vertical gradient was only observed at the stations near the São Francisco river mouth. In the rainy season, runoff increases the water flux coming from estuaries and the surface salinity values decrease. All species presented density peaks during these months except Parvocalanus crassirostris.
In the studied area the Paracalanidae species distribution seems to be influenced by the estuarine waters and oceanic water masses as indicated by the significant correlations between salinity and temperature values and species densities in the Monte Carlo’s permutation test.
Further studies about the dynamic of water masses at the Sergipe coast are essential to understand
the distribution patterns of the zooplanktonic populations.
A
CKNOWLEDGEMENTSThis work was supported by “Petróleo Brasileiro S. A., Financiadora de Estudos e Projetos (FINEP)”. Chemical analyses were performed in the “Laboratório de Química Ambiental, Universidade Federal de Sergipe” under José do Patrocínio Hora Alves responsibility.
R
EFERENCESAPHA - American Public Health Association. 1995. Standard methods for the examination of water and wastewater. 19 ed. Washington, DC APHA.
Almeida Prado-Por, M. S. & Lansac-Tôha, F. A. L. 1984. The distribution of brackish water Calanoida (Copepoda) along the coast of Brazil. Hydrobiol., 113:147-50. Araujo, H. M. P.; Dórea, R. A.; Rezende, M. H. S. G. & Leal,
M. L. S. 1991. Copepoda das águas da plataforma continental do Estado de Sergipe. In: Encontro Brasileiro de Plâncton, 4. Recife, 1990. Anais. Recife, UFPE, 4:283-291.
Björnberg, T. K. S. 1963. On the marine free-living copepods off Brazil. Bolm Inst. oceanogr., S Paulo, 13(1):3-142. Björnberg, T. K. S. 1980. Revisão da distribuição dos
gêneros Paracalanus, Clausocalanus e Ctenocalanus (Copepoda, Crustacea) ao largo do Brasil. Bolm Inst. oceanogr., S Paulo, 29(2): 65-68.
Björnberg, T. K. S. 1981. Copepoda. In: D. Boltovskoy ed., Atlas del zooplancton del Atlántico Sudoccidental y métodos de trabajos con el zooplancton marino. Mar del Plata, INIDEP. 936p.
Bowman, T. E. 1971. The distribution of calanoid copepods off the Southeastern United States between Cape Hatteras and Southern Florida. Smithsonian Contr. Zool., 96:1-58.
Bradford-Grieve, J. M.; Marhaseva, E. L.; Rocha, C. E. F. & Abiahy, B. 1999. Copepoda. In: D. Boltovskoy ed., South Atlantic Zooplankton. Leiden, Backhuys. 1706p. Campaner, A. F. 1985. Occurrence and distribution of
copepods (Crustacea) in the epipelagial off Southern Brazil. Bolm Inst. oceanogr., S Paulo, 33:5-27.
Castro, B. M. & Miranda, L. B. 1998. Physical oceanography of the western Atlantic continental shelf located between 4º N and 34º S: coastal segment (4, W). In: A. R. Robinson & Kenneth, H. B. eds. The Sea. v. II: 209-251. Coutinho, P. N. 1981. Sedimentação na plataforma
continental Alagoas-Sergipe. Arq. Ciênc. Mar, Brás. 21(1/2):1-18.
Cunha, S. B. & Guerra, A. J. T. 2003. Geomorfologia do Brasil. 3 ed. Rio de Janeiro, Bertrand Brasil. 388p. Dias, C. O. 1996. Copépodes da costa leste do Brasil. Arq.
Biol. Tecnol., 39(1):113-122.
Eskinazi-Leça, E.; Koening, M. L. & Silva-Cunha, M.G.G. 2004. Estrutura e dinâmica da comunidade fitoplanctônica, p. 353-374. In: Eskinazi-Leça, E.;
Neumann-Leitão, S. & Costa, M. F. eds.Oceanografia: um cenário tropical. Recife: UFPE. 761p.
Eskinazi-Sant’Anna, E. M. & Tundisi, J. G. 1996. Zooplâncton do estuário do Pina (Recife-Pernambuco-Brasil): composição e distribuição temporal. Rev. Bras. Oceanogr., 44(1):23-33.
França, A. M. C.; Coutinho, P. N. & Summerhayes,C.P. 1976. Sedimentos superficiais da margem continental nordeste brasileira. Revta. bras. Geol., 6(2):71-88. González, J. C. & Bowman, T. E. 1965. Planktonic copepods
from Bahia Fosforescent, Puerto Rico, and adjacent water. Proc. U.S. natn. Mus. Smithsonian Inst., 117(3513):241-303.
Lopes, R. M. 1994. Zooplankton distribution in the Guaraú river estuary (South-eastern Brazil). Estuar. coast. Shelf. Sci., 39:287-302.
Lopes, R. M.; Brandini, F. P. & Gaeta, S. A. 1999. Distribution patterns of epipelagic copepods off Rio de Janeiro (SE Brazil) in Summer 1991/19992 and winter 1992. Hydrobiologia, 411:161-174.
Montú, M. & Cordeiro, T. A. 1988. Zooplancton del complexo estuarial de la Bahia de Paranaguá. I. Composición, dinámica de las espécies, ritmos reprodutivos y acción de los fatores ambientales sobre la comunidad. Neritica, 3:61-83.
Neuman-Leitão, S.; Gusmão, L. M. O.; Nascimento-Vieira, D. A.; Silva, T. A.; Silva, A. P.; Porto Neto, F. F. & Moura, M. C. O. 1998. Biodiversidade do mesozooplâncton do nordeste do Brasil. Trabs Oceanogr. Univ. Fed. PE, 26(1):27-34.
Neumann-Leitão, S.; Gusmão, L. M. O.; Silva, T. A.; Nascimento-Vieira, D. A. & Silva, A. P. 1999. Mesozooplankton biomass and diversity in coastal and oceanic waters off North-Eastern Brazil. Arch. Fish. mar. Res., 47(23):153-165.
Paes, E. T. 2004. Monitoramento da plataforma continental dos Estados de Sergipe e Alagoas sob influência de atividades petrolíferas. Relatório Técnico. Convênio nº 08/2001/FAPESE/UFS. v. II – Parte 2. p. 705-721.
Schwamborn, R.; Ekau, W.; Silva, A. P.; Silva, T. A. & Saint-Paul, U. 1999. The contribution of estuarine decapod larvae to marine macrozooplankton communities in Northeast Brazil. Arch. Fish. mar. Res., 47:201-210.
Stramma, L.; Ikeda, Y. & Peterson, R.G.1990.Geostrophic transport in the Brazil Current region north of 20º S. Deep-Sea Res., 37:1875-1886.
Strickland, J. D. H. & Parsons, T. R. A. 1965. A manual of seawater analysis. Bull. Fish. Res. Bd. Can., 125:1-205. Summerhayes, C. P.; Fainstein, R. & Ellis, J. P. 1976.
Continental margin off Sergipe and Alagoas northeastern Brazil: a reconnaissance geophysical study of morphology and structure. Mar. Geol., 20:345-361. ter Braak, C. J. F. 1986. Canonical correspondence analysis:
a new eigenvector technique for multivariate direct gradient analysis. Ecology, 67:1167-1179.
ter Braak, C. J. F. 1987. The analysis of vegetation-environment relationship by canonical correspondence analysis. Vegetatio, 69:69-77.
ter Braak, C. J. F. 1989. CANOCO - an extension of DECORANA to analysis species-environment relationships. Hydrobiologia, 184: 169-170.
Valentin, J. L. & Monteiro-Ribas, W. 1993. Zooplankton community structure on the east-southeast Brazilian continental shelf (18-23ºS. Latitude). Continent. Shelf Res., 13: 407-424.
Vega-Pérez, L. A. & Hernandez, S. 1997. Composição e distribuição da Família Paracalanidae (Copepoda: Calanoida) ao largo de São Sebastião, Estado de São Paulo-Brasil, com ênfase em três espécies de Paracalanus. Rev. Bras. Oceanogr., 45(1/2):61-75.