Limiar da função de crescimento das emissões otoacústicas
-produto de distorção em neonatos****
Otoacoustic emissions growth rate threshold - distortion product in
neonates
*Fonoaudióloga. Mestre em Ciências da Reabilitação - Comunicação Humana pela Faculdade de Medicina da Universidade de São Paulo (FMUSP). Endereço para correspondência: R. Cipotânea, 51 São Paulo SP -CEP 05360-160
**Fonoaudióloga. Doutora em Ciências da Reabilitação -Comunicação Humana pela FMUSP. Fonoaudióloga do Departamento de Fisioterapia, Fonoaudiologia e Terapia Ocupacional da FMUSP.
***Fonoaudióloga. Livre-Docente da FMUSP. Professora Associada do Departamento de Fisioterapia, Fonoaudiologia e Terapia Ocupacional da FMUSP.
****Trabalho Realizado no Departamento de Fisioterapia, Fonoaudiologia e Terapia ocupacional da FMUSP e no Hospital Universitário da USP.
Artigo Original de Pesquisa
Artigo Submetido a Avaliação por Pares
Conflito de Interesse: não
Recebido em 11.06.2010. Revisado em 12.11.2010.
Aceito para Publicação em 30.11.2010. Patricia Pinheiro de Almeida* Seisse Gabriela Gandolfi Sanches** Renata Mota Mamede Carvallo***
Abstract
Background: distortion product otoacoustic emission measures (DPOAE) verifies, among other characteristics, the emergence and growth rate of the DPOAE response according to sound stimulus intensity (growth curve). Aim: to estimate the DPOAE threshold in neonates according to the DPOAE growth curve at 2kHz and 4kHz, with stimulus presentation ranging between 35 and 70 dB SPL. Method: participants were 51 neonates, with 24 to 84 hours of life and with no indication of risk for hearing impairment. The DPOAE were registered in the growth curve function at 2kHz and at 4kHz. Neonates were evaluated during the period of hospital stay, after birth. Three possible thresholds were considered (LIM 1, LIM 2 and LIM 3) based on the presence of response at 3dB SPL in the signal to noise ratio. Results: the average thresholds intensities ranged from 47.55 to 49.85dB at 2kHz and from 55.52 to 59.94dB at 4kHz. The mean amplitude response ranged from 6.67 to 8.27dB at 2kHz and from 6.99 to 11.35dB at 4kHz. There was significant difference between the three thresholds for the two studied frequencies. Conclusion: the procedure was feasible for the neonatal population revealing mean thresholds of up to 60dB for both frequencies. Even though participants presented elevated thresholds, robust amplitude responses were observed.
Key Words: Otoacoustic Emissions, Spontaneous; Hearing Tests; Infant, Newborn; Hearing.
Resumo
Tema: as medidas das emissões otoacústicas-produto de distorção (EOAPD) possibilitam verificar o surgimento e o crescimento da resposta das EOAPD de acordo com a intensidade do estímulo sonoro apresentado (curva de crescimento). Objetivo: estimar o limiar das EOAPD por meio da curva de crescimento das EOAPD nas freqüências de 2kHz e 4kHz, com apresentação do estímulo entre 35 e 70dB NPS em neonatos. Método: foram estudados 51 neonatos, de 24 a 84 horas de vida sem indicador de risco para deficiência auditiva. Foram registradas as EOAPD na função curva de crescimento em 2kHz e 4kHz. Os neonatos foram avaliados no período de internação após nascimento. Foram considerados três possíveis limiares (LIM 1, LIM 2 e LIM 3) a partir da presença de resposta considerada 3dBNPS na relação sinal/ ruído. Resultados: as intensidades médias dos limiares variaram de 47,55 a 49,85dB em 2kHz e de 55,52 a 59,94dB em 4kHz. As médias das amplitudes de resposta nos limiares variaram de 6,67 a 8,27dB para 2kHz e de 6,99 a 11,35dB para 4kHz. Houve diferença estatística entre os três limiares considerados para as duas frequências pesquisadas. Conclusão: o procedimento foi viável para a população neonatal que revelou limiares médios de até 60dB para as duas frequências estudadas. Para esta população foi evidenciado que mesmo apresentando limiares elevados foram observadas amplitudes de respostas robustas. Palavras-Chave: Emissões Otoacústicas Espontâneas; Testes Auditivos; Recém-Nascido; Audição.
Referenciar este material como:
Introduction
The basilar membrane has an important role in the function of the nonlinearity of the cochlea, which is related to compression in cochlear amplification, suggesting a strong link between peripheral physiology and the final auditory perception¹.
The nonlinearity of the cochlea is related to the difference in the amplification rate in regard to the stimulus level. Whitnell² stressed that the process which provides the cochlear amplification is physiologically vulnerable and dependent on the level of stimulation.
The presence of otoacoustic emissions indicates active biological mechanisms within the cochlea. The Distortion-Product Otoacoustic Emissions (DPOAE) are originated from the interaction of two simultaneous pure tones at two different frequencies, typically f1 and f2 (f2 f1) and the response is a by-product of distortion of the two stimuli (2f1-f2). DPOAE are preferable to assess cochlear function, since it enables to evaluate the growth of response according to the intensity of sound stimulus delivered. (DPOAE input/output function). Studies have used the DPOAE i/o (input/ output) function as an indirect measure of cochlear nonlinearity in humans ³,4,5,6,7,8.
A major problem in neonatal assessment is the interpretation of amplitude responses. Different levels of response in DPOAE may be associated with different DPOAE thresholds. DPOAE threshold, detected by DPOAE i/o function, corresponds to the lowest level of stimulus intensity that occurred the emergence of DPOAE. Therefore, the aim of the study was to determine the DPOAE threshold in neonates by means of the DPOAE growth rate at frequencies of 2 kHz and 4 kHz.
Method
Study Participants
Fifty-one (51) infants aged between 24 and 84 hours of life, 26 males and 25 females, were evaluated. They presented no risk for hearing loss. The newborns were evaluated after birth, still in the period of hospitalization at the University Hospital, in the University of São Paulo.
The eligibility criteria included infants with Capurro greater than 37 weeks, considered term, adequated for their gestational age and without background of maternal gestational intercurrences
such as, smoking, alcohol ingestion, drugs or medication use during pregnancy.
Parents responsible for neonates in the study received information individually and gave their consent to participate in the study (Research Ethics Committee of the University Hospital of USP Protocol. 740/07).
Equipment
The measurements of otoacoustic emissions were performed with the cochlear emission analyzer "ILO 292 / PLUS Echoport Otodynamics Analyzer Version 5.6." Neonatal probe was used (SND - type OAE Probe) attached to channel A of the external equipment. The equipment had been connected to a notebook.
Procedures
The procedures were performed in a single session in an acoustically untreated room, next to a nursing shared room in the maternity hospital. The average procedure lasted forty minutes (40min). For the accuracy of the inclusion and exclusion criteria the researcher investigated the files available in the maternity where the newborns were hospitalized.
Before the data was collected, it was performed the neonatal probe calibration.
Otoacoustic emissions were carried out by Transient-Evoked Otoacoustic Emission (TEOAE) and were also considered an exclusion criterion in the absence of response. The recording of TEOAE was performed preferable with the neonate asleep after feeding. A probe tip adapted to the probe was inserted in the external auditory canal without previous examination. The procedure was performed on both ears. Quickscreen software was used for this evaluation. .
algorithm. However, the collection of responses could be performed in all neonates studied, so that it was possible to trace all the DPOAE growth rate curves in the ranges of intensities previously described.
Even performing the tests in sleeping neonates, at this age group the physiological noise is easily captured by the probe of the equipment. Therefore, to obtain the responses, at least five sweeps were performed to each of the intensities studied. The completion of the data collection was defined manually by the researcher when the background noise was close to 0 dB SPL or lower.
Given the lack of criteria for analysis of recorded DPOAE growth rate curves, for this study, three possible criteria were elaborated to consider DPOAE threshold: THR1 (Threshold1) THR2
(Threshold2) and THR3 (Threshold3). All criteria were defined based on the DPOAE emergence response in relation to signal/noise ratio (S/N), considering the responses occurring at least 3 dB SPL above the second standard deviation of background noise:
THR 1 - Considered the lowest intensity studied when S/N was higher than or equal to 3 dB SPL regardless of S/N in intensity thereafter.
THR 2 - Considered the lowest intensity studied when S/N was higher than or equal to 3 dB SPL and 2f1-f2 should necessarily be a positive value, regardless of S/N in intensity thereafter.
THR 3 - Considered the lowest intensity studied when S/N was higher than or equal to 3 dB SPL regardless of 2f1-f2, but all subsequent intensities also showed SNR greater than or equal to 3 dB.
Statistical analysis
The results obtained by the variable studied were submitted to descriptive analysis by means of central tendency measures and inferential analysis by nonparametric statistical tests: Wilcoxon and Mann-Whitney. Nonparametric tests were used because the sample does not fulfill the requirements for use of parametric tests: normal distribution and homogeneity of variances.
It was also performed the correlation test of Spearman. For all the analysis the significance level was 0.05.
Results
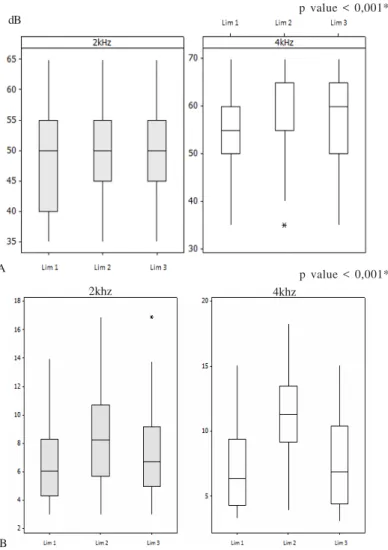
For this study, the search for the threshold was performed by DPOAE i/o function and according to the criteria established and described previously. Figure 1 shows the thresholds THR 1, THR 2 and THR 3 with the respective distributions. Regardless of the concept by which the threshold was defined (THR 1, THR 2 and THR 3), the median intensity that generated responses was 50 dB SPL for 2 kHz and 55 to 65 dB SPL for 4 kHz. In general, the amplitude of DPOAEs generated by the intensities shown in Figure 1 panel B, presents a significant difference according to the criterion adopted for the threshold so as to 2kHz as to 4kHz. However, the THR 2 for both frequencies studied, showed higher values compared to THR1 and THR 3.
Comparisons were made between the frequencies for each criterion threshold. Table 1 shows the descriptive and inferential comparisons
FIGURE 1. Comparison of thresholds in dB SPL, DPOAE (THR 1, THR 2 and THR 3) for frequencies from 2 kHz and 4 kHz in the growth curves (A). Below the amplitudes of responses obtained through the SNR in the respective thresholds considered in neonates can be viewed (B).
p value < 0,001* dB
p value < 0,001* A
B
between 2 and 4 kHz. The thresholds had been presented, lower for 2 kHz in all three criteria, with statistical difference in the three thresholds.
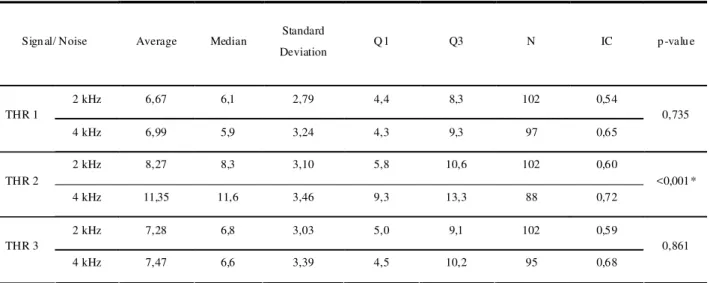
Concerning the DPOAE amplitudes in the comparison of both frequencies, it was observed that regardless of the threshold considered, the values were higher at 4 kHz. There was statistical significance for THR 2 (Table 2).
TABLE 1. Descriptive and comparative analysis of DPOAE thresholds under conditions termed THR1 in 2 and 4 kHz, 2
THR2 in 2 and 4 kHz and THR3 in 2 and 4 k Hz, in neonates
Threshold On set Average Median Standard
Deviation Q1 Q3 N IC p-value
2 kHz 47,55 50 ,0 7,76 4 0,0 53,8 102 1,51
THR 1
4 kHz 55,52 55 ,0 8,79 5 0,0 60,0 97 1,75
<0,001*
2 kHz 49,85 50 ,0 7,49 4 5,0 55,0 102 1,45
THR 2
4 kHz 59,94 60 ,0 8,29 5 5,0 65,0 88 1,73
<0,001*
2 kHz 49,12 50 ,0 7,69 4 5,0 55,0 102 1,49
THR 3
4 kHz 56,89 60 ,0 8,32 5 0,0 65,0 95 1,67
<0,001*
L ab el: Q1 = first quartile , Q3 = third Quartile, N= total number of ears, CI = confidence interval
TABLE 2. Descriptive and comparative analysis of the response amplitude, the SNR conditions termed THR1 in 2 and 4 kHz, THR 2 in 2 and 4 kHz and THR3 in 2 and 4 kHz, in neonates.
Sign al/ Noise Average Median Standard
Deviation Q 1 Q3 N IC p -valu e
2 kHz 6,67 6,1 2,79 4,4 8,3 102 0,54
THR 1
4 kHz 6,99 5,9 3,24 4,3 9,3 97 0,65
0,735
2 kHz 8,27 8,3 3,10 5,8 10,6 102 0,60
THR 2
4 kHz 11,35 11,6 3,46 9,3 13,3 88 0,72
<0,001 *
2 kHz 7,28 6,8 3,03 5,0 9,1 102 0,59
THR 3
4 kHz 7,47 6,6 3,39 4,5 10,2 95 0,68
0,861
of term neonates, due to the difference in noise level that was lower in the preterm group.
Analyzing the three criteria previously suggested to assess the threshold of DPOAEs, the THR 3 seemed more appropriate and stable. The THR3 was determined as the presence response amplitude of at least 3 dB SPL above the second standard deviation of background noise and that this range was repeated in subsequent intensities. This criterion, which has been outlined in the preparation of this study, agrees with the proposition of recent studies that also consider the occurrence of threshold, the presence of DPOAE, 3 dB SPL above the background noise in at least three consecutive intensities 7, 13. Such concordance confirms the condition as the best suited to be determined as the DPOAEs threshold when analyzed the DPOAE growth rate curve . The line of reasoning behind this choice had been brought by the analogy with concepts in psychoacoustics threshold, whereby the threshold for defining the hearing "status" comes from the consistency of individual responses evaluated. The threshold must be set at intensity above the body always responds and below which it never responds. It is necessary that the individual responds to at least 50% of the times at which the sound stimulus is presented 14.
For the group studied, the DPOAE growth curve appears to be a viable procedure to be performed along a number of hearing tests. Another aspect, to which this procedure can be useful, is that the growth curve can elucidate details of the cochlear nonlinearity by the change in growth response and therefore also provides information on cochlear integrity. In a recent study with adults, Hatzopoulos et al.15, comparing the DPOAE growth curve with the amplitude of hearing responses evoked from steady-state, has suggested additional studies to be conducted so that we could have the usefulness of growth curve procedures in neonates and infants confirmed.
A relevant characteristic for studied population,was the elevated threshold. However the greatness of response magnitude (amplitude) must be noted in the considered threshold above 3 dB SPL of signal to noise ratio recommended as a minimum criterion for response presence 7, 13.
Conclusions
The results suggest that the DPOAE threshold should meet the following conditions: the lowest stimulus intensity able to generate a response greater than 3 dB SPL above the background noise and that the response remains present at levels of stimulus presented consecutively higher. DPOAE i/o function may be used for obtaining otoacoustic emissions thresholds, and it is an additional procedure for verifying the auditory integrity in neonates.
Discussion
The use of DPOAE i/o function to indirectly verify the compression and cochlear nonlinearity in humans has been studied in recent publications 3, 4,6,7,11. Nevertheless, this issue has rarely been addressed to newborns.
In this study, there was statistically significant difference at 2 kHz and 4 kHz thresholds among the three THR 1, THR 2 and THR 3 (Figure 1-A). The thresholds were different among them, even with absolute values very close there was statistical significance (p-value <0.001). When compared the amplitude responses through the relation signal / noise (Figure 1-B) it was also found statistically significant differences between THR 1, THR 2 and THR3 for each frequency.
These results, showing the proximity of the three levels of intensity thresholds, despite the statistical difference, generated the need to find a condition which could better define the DPOAE threshold when performed DPOAE i/o function.
The threshold values found in the so-called THR2, at 2 kHz and 4 kHz were higher than THR1 and THR3 in both frequencies, and therefore it would be likely to consider questions about THR 2 as the most reliable to reproduce the DPOAE threshold for the population studied. On the other hand, it is noteworthy that THR 2 must necessarily meet the criterion for positive value of 2f1-f2, regardless of the values of signal to noise ratio in intensity thereafter.
References
1. Oxenham AJ, Bacon SP. Cochlear compression: perceptual measures and implications for normal and impaired hearing. Ear Hear. 2003;24(5):352-66.
2. Withnell RH, Shaffer LA, Lilly, DJ. What drives mechanical amplification in the mammalian cochlea? Ear Hear. 2002;23(1):49-57.
3. Dorn PA, Konrad-Martin D, Neely ST, Keefe DH, Cyr E, Gorga MP. Distortion product otoacoustic emission input/output functions in normal-hearing and hearing-impaired human ears. J Acoust Soc Am. 2001;110(6):3119-31.
4. Neely ST, Gorga MP, Dorn PA. Cochlear compression estimates from measurements of distortion-product otoacoustic emission. J Acoust Soc Am. 2003;114(3):1499-507.
5. Janssen T, Niedermeyer HP, Arnold W. Diagnostics of the cochlear amplifier by means of distortion product otoacoustic emissions. ORL J Otorhinolaryngol Relat Spec. 2006;68(6):334-9.
6. Gorga MP, Neely ST, Dierking DM, Kopun J, Jolkowski K, Groenenboom K, Tan H, Stiegemann B. Low-frequency and high-frequency cochlear nonlinearity in humans. J Acoust Soc Am. 2007;122(3):1671-80.
7. Neely ST, Johnson TA, Kopun J, Dierking DM, Gorga MP. Distortion-product otoacoustic input/output characteristics in normal-hearing and hearing-impaired human ears. J Acoust Soc Am. 2009;126(2):728-38. 8. Sanches SGG, Sanchez TG, Carvallo RMM. Influence of cochlear function on auditory temporal resolution in tinnitus patients. Audiol Neurootol. 2010;15(5):273-81.
9. Kummer P, Janssen T, Arnold W. The level and growth behavior of the 2 f1 - f2 distortion product otoacoustic emission and its relationship to auditory sensitivity in normal hearing and cochlear hearing loss. J Acoust Soc Am. 1998;103(6):3431-44.
10. Boege P, Janssen T. Pure-tone threshold estimation from extrapolated distortion product otoacoustic emission I/O - functions in normal and cochlear hearing loss ears. J Acoust Soc Am. 2002;111(4):1810-8.
11. Williams EJ, Bacon SP. Compression Estimates Using Behavioral and Otoacoustic Emissions Measures. Hear Res. 2005;201:44-54.
12. Ribeiro FM, Carvallo RMM, Marcoux. Auditory steady-state evoked responses for preterm and term neonates. Audiol Neurotol. 2010;15(2):97-110.
13. Johnson TA, Neely ST, Kopun JG, Dierking DM, Tan H, Gorga MP. Clinical test performance of distortion-product otoacoustic emissions using new stimulus conditions. Ear Hear. 2010 Feb;31(1):74-83.