J. Braz. Chem. Soc., Vol. 14, No. 2, 265-268, 2003. Printed in Brazil - ©2003 Sociedade Brasileira de Química 0103 - 5053 $6.00+0.00
A
r
ti
c
le
* e-mail: [email protected]
Improved Separation of IA and IIA Metal Cations in Matrices with High Sodium
Concentration by Capillary Electrophoresis with Contactless Conductometric Detection
José A. Fracassi da Silvaa, Nara L. Ricellib, Alexandre Z. Carvalhoc, Claudimir L. do Lago*,c
a
Escola Politécnica, Universidade de São Paulo, Av. Prof. Luciano Gualberto, travessa 3, 158, 05508-900 São Paulo - SP, Brazil
b
Faculdade de Ciências Farmacêuticas, Universidade de São Paulo, Av. Prof. Lineu Prestes, 580, 05508-900, São Paulo - SP, Brazil
c
Instituto de Química, Universidade de São Paulo, Av. Prof Lineu Prestes, 748, 05508-900, São Paulo - SP, Brazil
Um dos usos mais comuns da eletroforese capilar com detecção condutométrica é a análise de vários tipos de amostras contendo metais alcalinos e alcalinos terrosos. No entanto, a alta concentração de sódio, a qual é uma ocorrência bastante comum, pode causar perda de resolução de alguns picos. Neste trabalho, as condições e o eletrólito de corrida conveniente para análises de soro e fluído para hemodiálise são apresentados. A idéia básica é deslocar os picos de Ca2+ e Mg2+ pela redução de suas
mobilidades pela adição de lactato e metanol ao eletrólito de corrida. Limites de detecção da ordem de 0,5 a 1,0 µmol L-1 e razão molar Na+/Ca2+ da ordem de 1000 foram obtidos. Estas condições
excedem as necessidades da aplicação pretendida.
One of the most common uses of capillary electrophoresis with conductometric detection is the analysis of different samples containing alkaline and alkaline earth metals. However, the high sodium content, which is a very common occurrence, may cause loss of resolution of some peaks. In this work, the conditions and a running buffer suitable for serum and hemodialysis fluid analyses are presented. The approach basically consists in the reduction of mobilities of Ca2+ and Mg2+ by
addition of methanol and lactate in the running buffer. Limits of detection in the range from 0.5 to 1.0 µmol L-1 with molar Na+/Ca2+ ratios as high as 1000 were obtained, which are conditions that
exceed the requirements of the proposed determination.
Keywords: capillary electrophoresis, contactless conductivity detection, human serum, hemodialysis fluid
Introduction
Metal cations from groups IA and IIA play an important role in numerous processes in the human body, such as volume and osmotic regulation, myocardial rhythm, blood coagulation, neuromuscular excitability, as cofactors in enzyme activation, in the regulation of ATPase ion pumps, and so on. The reference ranges for potassium, sodium, calcium, and magnesium in serum of normal individuals are 3.4–5.0, 135–145, 0.65–1.0, and 2.15–2.65 mmol L-1, respectively. Abnormal concentration values for these ions can help in the diagnosis of many metabolism disorders, such as diabetes, advanced renal disease, polydipsia, aldosterone deficiency or excess, cardiac disorders, alcoholism etc.1
Capillary electrophoresis (CE) is a separation technique based on differences of mobility of charged species and has been applied for determination of several kinds of analytes, from small ionic species to macromolecules.2,3
Metal cations from groups IA and IIA have been mainly analyzed by free solution capillary electrophoresis (FSCE) with indirect UV-visible absorption detection.4-7 Although these cations can be readily separated at low concentrations (typically 10-6 mol L-1), separations of concentrated samples require the use of complexating agents to selectively modify the ion mobility and improve resolution. Examples of ligands widely used in FSCE separations include carboxylic acids4-6 – such as oxalic, tartaric, lactic, α -hydroxyisobutyric (HIBA) and ethylenediaminetetraacetic acid (EDTA) – and polyethylene glycols (PEG).7
266 Silva et al. J. Braz. Chem. Soc.
In this mode of detection, the response is proportional to the difference of mobilities between the analyte and the running electrolyte co-ion. In general, the greater the mobility difference, the greater the sensitivity achieved. Unfortunately, the conductivity differences between the zone analyte and the running electrolyte cause the so-called electrodispersion effects.18 As a consequence, electrodispersion spreads the analyte zones, prejudicing the separation. For this reason, FSCE-CD is, in most cases, characterized by poor resolution and efficiency, compared to photometric modes of detection.
Recently, attention has been paid to contactless conductometric detection (CCD).19-26 In this mode of detection the electrodes are positioned outside the capillary, avoiding contact with the inner solution and preventing against electrode fouling. Additionally, the capillary wall decouples the high electric field from the measurement circuitry. To reduce the high impedance of the capillary wall, high frequencies are used in CCD (typically 105 to 106 Hz), in comparison with conventional CD.
Despite the large number of articles involving CE-CD and CE-CCD, little effort has been applied to optimize separations of cations from groups IA and IIA. Most papers employ a mixture of 2-[N-morpholine]ethanesulphonic acid (MES) and histidine (His) as running buffer to keep the background conductivity as low as possible. Both MES and His produce the necessary pH buffering. Protonated histidine is suitable as a co-ion, because its low mobility renders positive peaks for all alkaline and alkaline earth ions. MES shows weak interaction with these metals and consequently the separation is determined mainly by their mobilities in aqueous medium. Since these species have comparable mobilities, the complete resolution of calcium, sodium and magnesium is only achieved in very dilute samples. In addition, many matrices present high sodium concentrations, making the direct quantitation of calcium and magnesium difficult. In some cases, dilution steps do not offers a good alternative, because the final concentrations of the other ions drop below the limit of quantitation (LOQ). This work focuses on the complete separation of calcium and magnesium in matrices containing a high sodium concentration, by using a running electrolyte composed of lactic acid (Hlac) and His. The capabilities of this method are demonstrated by the analysis of human serum samples.
Experimental
Reagents
All reagents were analytical grade or better. MES, Hlac (90%), His, methanol, 18-crown-6 ether, HCl, LiOH, NaCl,
KCl, CsCl, CaCl2, BaCl2, SrCl2 and MgCl2 were purchased from Merck (Rio de Janeiro, Brazil and Darmstadt, Germany) and used as received. Individual stock solutions (0.1 mol L-1 in each cation) were prepared with 18.3 MΩ deionized water (NANOpure UV, Barnstead/Thermolyne Co., Dubuque, Iowa, USA). The lithium chloride (0.1 mol L-1) stock solution was prepared by the total neutralization of LiOH with HCl. Standard solutions with mixtures of cations were prepared by dilution of individual stock solutions until the desired concentration. Running buffers were prepared daily by diluting 0.1 mol L-1 stock solutions.
Blood samples
Blood samples were collected from volunteers and the serum was separated from the whole material by centri-fugation at 3500 rpm. The supernatant was diluted 100-fold and directly injected into the CE system.
CE apparatuses
The CE equipment was built in our laboratory.24 Two platinum electrodes were connected to the high voltage power supply (Bertan AR-30, Del Global Technologies Corp., Valhalla, New York, USA), and placed in reservoirs filled with running buffer. To avoid exposure to high electrical fields, the system was placed in a Plexiglas® box with a safety lock and temperature control (air convection). A Pentium® 133 microcomputer controls the equipment parameters and acquires the CCD signal. Details of the detector construction have been reported elsewhere.20,24 Briefly, a couple of 2-mm long tubular electrodes, separated by 1 mm, are positioned outside the capillary. A function generator (FG2002, Goldstar, Korea) operating at 550 kHz and 2 Vpp is connected to one of the electrodes. The signal transmitted to the second electrode is processed, and a continuous output signal is obtained. The output signal, which is proportional to the solution conductivity inside the capillary in the region between the electrodes, is connected to a PCL711 multifunction card (Advantech Co., Taipei, Taiwan) for data acquisition.
The samples were injected at the anodic reservoir by pressure at 23 kPa (3.4 psi) for 2 s or by gravity at 10 cm for 30 s in a 75 µm (inner diameter), 360 µm (outer diameter) 50 cm long fused-silica capillary (J&W, Agilent Technologies, São Paulo, Brazil). The detector was placed 10 cm from the end of the capillary. The separation voltage was 20 kV for all experiments.
Results and Discussion
267 Improved Separation of IA and IIA Metal Cations
Vol. 14, No. 2, 2003
increasing sodium concentration and with MES/His running buffer. For Na+/Mg2+ and Na+/Ca2+ molar ratios close to one, baseline resolution can be obtained. However, for a Na+/Mg2+ ratio of 5 (Figure 1a) and or above (Figure 1b), there is a superposition of their peaks.
In hemodialysis fluid, the molar Na+/Mg2+ and Na+/ Ca2+ ratios are about 280 and 80, respectively. In human serum, these ratios range, respectively, from ca. 135 to 223 and from 50 to 70.1 These values show clearly that MES/ His running buffer is not suitable to these applications.
A simple approach to increase the resolution of these peaks is to add a complexating agent. A good compromise between sensitivity and resolution was obtained by replacing MES by lactate, which complexes calcium and magnesium and reduces their mobilities.27
Figure 2 shows the separation of 8 alkaline and alkaline earth cations in 20 mmol L-1 Lac/His. It is worthwhile to note that, due to the reduction of mobilities of Ca2+ and Mg2+, the critical pair becomes Na+ and Ca2+. Additional resolution was obtained by including 10% methanol, which reduces the mobilities of Ca2+ and Mg2+ even more. Furthermore, this organic modifier allows an increase of the running buffer concentration without significant joule heating, which produces compression of the analyte zones. Although 18-crown-6 does not significantly change the mobilities of Na+, Ca2+, and Mg2+, it was also added to the running buffer in order to separate K+ from NH
4 +, in the
case of the undesirable presence of the latter. Thus, the
optimized composition was 30 mmol L-1 Lac/His, 2 mmol L-1 18-crown-6 while the solvent for this solution was 9:1 (v/v) water:methanol.
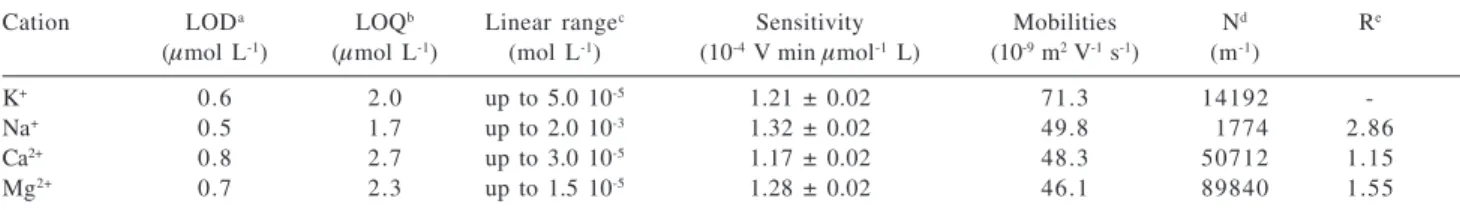
For 2-s 23 kPa injections, the limits of detection (LOD) for IA and IIA metal ions were between 0.5 and 1.0 µmol L -1. The sensitivities were 1.21 ± 0.02, 1.32 ± 0.02, 1.17 ±
0.02, and 1.28 ± 0.02 ·10-4 V min mmol-1 L for K+, Na+, Ca2+, and Mg2+, respectively.
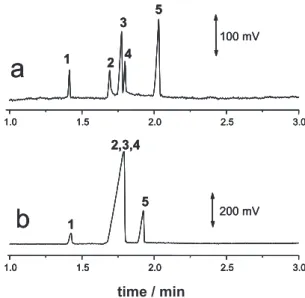
Figure 3 shows electropherograms for a standard solution containing K+, Na+, Ca2+, and Mg2+ (Figure 3a), and a serum sample (Figure 3b). The figures of merit are shown in Table 1. The standard solution was 50 µmol L-1, Figure 1. Electropherograms of solutions containing some IA and
IIA metal cations in the presence 50 (a) and 500 (b) µmol L-1 of Na+.
The running buffer was 20 mmol L-1 MES/His, pH 6.0. Separation
voltage 20 kV; Gravity injection at 10 cm for 30 s. Peaks: (1) K+
10 µmol L-1, (2) Ca2+ 10 µmol L-1, (3) Na+, (4) Mg2+ 10 µmol L-1, and
(5) Li+ 100 µmol L-1.
Figure 2. Electropherogram of a sample containing eight metal cations (50 µmol L-1 each) from groups IA and IIA using
20 mmol L-1 Hlac/His, pH 4.9, as running buffer. Separation voltage
20 kV; Gravity injection at 10 cm for 30 s. Peaks: (1) Cs+, (2) K+,
(3) Ba2+, (4) Sr2+, (5) Na+, (6) Ca2+, (7) Mg2+, and (8) Li+.
Figure 3. Electropherograms of a standard solution (a) and a serum sample (b). Running buffer: 30 mmol L-1 Hlac/His and 2.0 mmol L-1
18-crown-6 in 9:1 (v/v) water:methanol. Separation voltage 20 kV; Pressure injection at 23 kPa for 2 s. Peaks: (1) K+, (2) Na+, (3) Ca2+,
268 Silva et al. J. Braz. Chem. Soc.
1.6 mmol L-1, 30 µmol L-1, and 15 µmol L-1 in K+, Na+, Ca2+, and Mg2+, respectively. As one can note, there is no problem related to superposition of peaks. Although not shown, hemodialysis fluid could be analyzed using the same conditions. In this case, the matrix is very simple and no pretreatment but dilution is necessary.
Conclusions
Capillary electrophoresis with CCD has a great potential for analysis of alkaline and alkaline earth ions in different matrices. A frequent drawback is the high content of one of these species, but this can be overcome by adding substances that promote changes of mobilities. Since alkaline earth metals are more prone to complex formation and solvation effects than alkaline metals, these should be the focus of such an approach.
Acknowledgements
The authors thank Fundação de Amparo à Pesquisa do Estado de São Paulo (FAPESP) and Conselho Nacional para o Desenvolvimento Científico e Tecnológico (CNPq) for financial support and fellowships.
References
1. Toffaletti, J. G. In Clinical Chemistry: Principles, Procedures,
Correlations; Bishop, M. L.; Duben-Engelkirk, J. L.; Fody, E.
P., eds.; Lippincott: New York, 1996, ch. 12. 2. Tavares, M. F. M.; Quim. Nova1996, 19, 173. 3. Tavares, M. F. M.; Quim. Nova1997, 20, 493.
4. Lin, T.-I.; Lee, Y.-H.; Chen, Y.-C.; J. Chromatogr. A1993,
654, 167.
5. Shi, Y.; Fritz, J. S.; J. Chromatogr. A1994, 671, 429. 6. Tangen, A.; Lund, W.; Frederiksen, R. B.; J. Chromatogr. A
1997, 767, 311.
7. Stathakis, C.; Cassidy, R. M.; Analyst1996, 121, 839. 8. Zemann, A. J.; Trends Anal. Chem.2001, 20, 346.
9. Huang, X.; Pang, T.-K. J.; Gordon, M. J.; Zare, R. N.; Anal.
Chem.1987, 59, 2747.
Table 1. Figures of Merit
Cation LODa LOQb Linear rangec Sensitivity Mobilities Nd Re
(µmol L-1) (µmol L-1) (mol L-1) (10-4 V min µmol-1 L) (10-9 m2 V-1 s-1) (m-1)
K+ 0.6 2.0 up to 5.0 10-5 1.21 ± 0.02 71.3 14192
-Na+ 0.5 1.7 up to 2.0 10-3 1.32 ± 0.02 49.8 01774 2.86
Ca2+ 0.8 2.7 up to 3.0 10-5 1.17 ± 0.02 48.3 50712 1.15
Mg2+ 0.7 2.3 up to 1.5 10-5 1.28 ± 0.02 46.1 89840 1.55
a for SNR = 3; b for SNR = 10; c Used in this work, linearity is higher; d Number of plates per meter; e Resolution between the corresponding peak
and the previous one.
10. Huang, X.; Zare, R. N.; Anal. Chem.1991, 63, 2193. 11. Haber, C.; Jones, W. R.; Soglia, J.; Surve, M. A.; McGlynn,
M.; Caplan, A.; Reineck, J. R.; Krstanovic, C.; J. Capillary
Electrophor.1996, 3, 1.
12. Müller, D.; Jelínek, I.; Opekar, F.; Stulík, K.; Electroanalysis
1996, 8, 722.
13. Govindaraju, K.; Cowley, E. A.; Eidelman, D. H.; Lloyd, D.
K.; Anal. Chem.1997, 69, 2793.
14. Zhao, H.; Dadoo, R.; Reay, R. J.; Kovacs, G. T. A.; Zare, R. N.;
J. Chromatogr. A1998, 813, 205.
15. Stocking, C. J.; Slater, J. M.; Unwin, R.; Walter, S.; Folkerd,
E.; Kidney Int.1999, 56, 338.
16. Tuma, P.; Opekar, F.; Jelínek, I.; Stulík, K.; Electroanalysis
1999, 11, 1022.
17. Williams, R. C.; Boucher, R. J.; J. Pharm. Biomed. Anal.2000,
22, 115.
18. Mikkers, F. E. P.; Everaerts, F. M.; Verheggen, Th. P. E. M.; J.
Chromatogr.1979, 169, 11.
19. Zemann, A. J.; Schnell, E.; Volgger, D.; Bonn, G. K.; Anal.
Chem.1998, 70, 563.
20. Fracassi da Silva, J. A.; Lago, C. L.; Anal. Chem.1998, 70, 4339.
21. Mayrhofer, K.; Zemann, A. J.; Schnell, E.; Bonn, G. K.; Anal.
Chem.1999, 71, 3828.
22. Chvojka, T.; Jelínek, I.; Opekar, F.; Stulík, K.; Anal. Chim. Acta2001, 433, 13.
23. Tuma, P.; Opekar, F.; Jelínek, I.; Electroanalysis2001, 13, 989.
24. Fracassi da Silva, J. A.; Guzman, N.; Lago, C. L.; J. Chromatogr. A2002, 942, 249.
25. Kubán, P.; Karlberg, B.; Kubán, P.; Kubán, V.; J. Chromatogr. A2002, 964, 227.
26. Tanyanyiwa, J.; Galliker, B.; Schwartz, M. A.; Hauser, P. C.;
Analyst2002, 127, 214.
27. Pospíchal, J.; Gebauer, P.; Bocek, P.; Chem. Rev.1989, 89, 419.
Received: October 19, 2002 Published on the web: March 28, 2003