www.eerp.usp.br/rlae
Corresponding Author: Helenice Bosco de Oliveira Universidade Estadual de Campinas
Rua Waldyr Aparecido da Silva, 60 – Residencial II Bairro: Barão do Café – Barão Geraldo
CEP: 13085-065, Campinas, SP, Brasil E-mail: [email protected]
Tuberculosis, AIDS and tuberculosis-AIDS co-infection in a large city
Nanci Michele Saita
1Helenice Bosco de Oliveira
2This study aimed to analyze the incidence of tuberculosis (TB), AIDS and
tuberculosis-AIDS co-infection in the municipality of Campinas, in the state of São Paulo, Brazil, in the
period 2001 - 2009. A historical trend study, it uses secondary data from the Tuberculosis
Surveillance Database of the University of Campinas (UNICAMP) and the São Paulo State
STD-AIDS Center of Excellence and Training. It included new cases of TB, AIDS, and of
tuberculosis-AIDS reported in the municipality of Campinas. A decrease in cases of TB until
2007 was observed, with an increase in 2008 and 2009. There was a general reduction
in AIDS from 2007, but with an increase among men aged 60 or over, in the years 2007
to 2009. For tuberculosis-AIDS co-infection, the tendency was to reduce. The proportion
of HIV tests not undertaken, among patients with tuberculosis, was high (27.5%). This
scenario shows the need for integration of the databanks into the planning and control
activities.
Descriptors: Incidence; Tuberculosis; HIV.
Tuberculose, AIDS e coinfecção tuberculose-AIDS em cidade de grande porte
Este estudo objetivou analisar as incidências da tuberculose (TB), AIDS e coinfecção
TB-AIDS no município de Campinas, SP, Brasil no período de 2001 a 2009. Trata-se de
estudo de tendência histórica, em que se utilizaram dados secundários do Banco de
Dados em Vigilância da Tuberculose-Unicamp e do Centro de Referência e Treinamento
DST-AIDS do Estado de São Paulo. Foram incluídos casos novos de TB, de AIDS e da
coinfecção TB-AIDS notiicados pelo município de Campinas. Observou-se decréscimo
dos casos de TB até 2007, com aumento em 2008 e 2009. Na AIDS ocorreu redução
geral a partir de 2007, mas com aumento entre os homens com 60 anos e mais, entre os
anos 2007 e 2009. Para a coinfecção TB-AIDS, a tendência foi de redução. A proporção
de testes anti-HIV não realizados, entre pacientes com tuberculose, foi elevada (27,5%).
Esse cenário revela a necessidade de integração dos bancos de dados nas atividades de
planejamento e controle.
Descritores: Incidência; Tuberculose; HIV.
Tuberculosis, SIDA y co-infección SIDA-tuberculosis en una gran ciudad
Esta investigación tuvo como objetivo analizar la incidencia de tuberculosis (TBC), SIDA
y el co-infección SIDA-TB en Campinas-SP-Brasil, 2001-2009. Se trata de un estudio de
la tendencia histórica con datos de la Base de Datos de Monitoreo de TBC-UNICAMP y del
sitio web del Centro de Referencia en SIDA de São Paulo. Se incluyeron los casos nuevos
de TBC, SIDA y co-infección SIDA-TBC registrados a cada año en Campinas. Se observó
disminución de casos de tuberculosis en 2007, con aumento en 2008-2009. El SIDA
se produjo en la reducción global a partir de 2007, pero aumentan entre los hombres
mayores de 60 años, en los años 2007-2009. Para la co-infección TB-VIH la tendencia de
reducción. La proporción de exámenes VIH no realizados en pacientes con TBC fue alta
(27,5%). Este escenario pone de maniiesto la necesidad de integración de las bases de datos de TBC y SIDA para las actividades de planiicación y control.
Descriptores: Incidencia; Tuberculosis; VIH.
Introduction
In 2010 the incidence coeficient (IC) for tuberculosis
(TB), worldwide, was 128 per 100,000 persons(1). Brazil, with an incidence of 43 cases per 100,000 in 2010, is in
19th place among the 22 countries which reported 80% of cases of TB(1).
The State of São Paulo recorded 19,024 cases
in 2010, of which 16,406 were identiied as new(2). The municipality of Campinas presented an IC of
26.4/100,000 inhabitants in 2010(3).
Despite advances in the detection of new cases,
in the introduction of powerful medication, and in the
prevention of millions of deaths, the incidence of TB did
not decline as expected(4).
Biological, social and environmental determinants
have long been recognized as risk factors for infection and
falling ill with TB(5). HIV is one of these factors, responsible for high morbidity and mortality. It has the heaviest impact
on TB incidence, modifying its clinical presentation,
the duration of treatment it requires, its resistance to
medication, and its epidemiological tendency. Poverty,
too, is clearly associated with TB(6-7), underlying the other risk factors; this relationship, however, is often mitigated
in multivariate models which include more proximate
determinants(5).
The variations in the tendency of TB, AIDS and
and cities due to the different regional characteristics
and to the different levels of health planning and health
care(8-9). The municipality of Campinas, in 2010, was among the ive cities in the State of São Paulo which
reported the most cases of TB(2) and AIDS(10).
The current reality of the two diseases strengthens
the need for surveillance of the cases reported, which
would permit veriication of the scale of TB-AIDS
comorbidity and the guidance of control actions,
optimizing the use of the available resources.
As part of the global strategy of reducing
morbidity-mortality from TB, the World Health Organization
(W.H.O) established targets - not only of detecting
70% of new cases and achieving an 85% success rate
in treatment for TB, but also of implementing actions
aiming to reduce prevalence and mortality by 50% by
2015 compared to 1990, and of eliminating TB as a
public health problem by 2050(11-12).
To achieve these goals, it is necessary to evaluate
and monitor the actions, using local data collected from
the epidemiological surveillance system. This being so,
this study aimed to analyze the incidence of cases of TB,
of AIDS, and of TB-AIDS co-infection, in the municipality
of Campinas, between 2001 and 2009.
Methods
A historical trend study was undertaken, with
annual distribution of the incidence of TB, AIDS, and
TB-AIDS co-infection, in the municipality of Campinas in the
state of São Paulo, for the period 2001 – 2009.
Campinas is considered one of the state of São
Paulo´s industrial and technological centers and has the
characteristic of attracting patients from neighboring
municipalities in search of treatment. These include
people with TB and AIDS, who are frequently diagnosed
in the city. According to the Brazilian Institute for
Geography and Statistics (BIGS), in 2010, Campinas
had 1,024,912 inhabitants.
The study included new cases of TB and AIDS which
occurred in patients resident in Campinas and which
were notiied there. Individuals who were resident in
other municipalities were excluded, as were patients in
prison.
Information about the number of cases of TB and
of TB-AIDS co-infection among new cases of TB were
obtained from the TB Surveillance Database of the
Faculty of Medical Sciences (FMS) of the University of
Campinas (UNICAMP), which uses oficial notiications, laboratory data and mortality data. The notiications
were veriied in the Ministry of Health’s Case Registry
Database (SINAN, in Portuguese), in the years 2001 – 2006. From 2007, the São Paulo State Health
Secretariat’s TB-WEB system was used instead.
The TB Surveillance Database has been a continuous activity of the Faculty of Medical Sciences at UNICAMP
since 1993, and the correction and puriication of the
records are carried out based on the patient’s name,
the name of the patient’s mother, and the patient’s date
of birth. The notiication registers for cases of TB – like the illing out of the items in the complementary tests
previously carried out, and the closing of cases– are
followed up on a weekly basis via the TB-WEB system,
so as to avoid duplicating records. Information about
TB-AIDS co-infection was extracted from the data ields
referring to the associated illnesses and to the result of the HIV test.
The website of the Center of Excellence and Training in STD/AIDS of the State of São Paulo was used for
obtaining data on AIDS. The databanks TABNET (adult) and TABNET (child) were used to ascertain the number
of cases for each year studied. It was not possible to
research the notiication forms directly.
For the study of the historical series for TB, AIDS
and TB-AIDS co-infection in the municipality, their
Incidence Coeficients (IC) were calculated for the
period 2001 – 2009. For each series, the numerator was made up from the new cases of TB, AIDS and
TB-AIDS, respectively, among residents of Campinas. The populational data used in the IC’s denominator was
from the Brazilian Institute for Geography and Statistics
(IBGE). The coeficients were standardized based on the
age distribution of the population in the 2000 Census.
The coeficients’ tendencies were represented in
tables, with regular intervals of one calendar year, and
the calculation of moving averages. The moving average is a non-parametric method which has the purpose
of smooth out the series when this varies as a result of time. The series was transformed through moving
averages of order three to make it stationary and with toned-down values.
Further, the behavior of each temporal series was checked using the LOWESS (Locally-Weighted Regression
Scatterplot Smoothing) method, which is a technique for
adjusting curves based on locally-weighted regression
or irst-degree polynomial regression (non-parametric
method). As the series extended over nine years, a small number for the adjustment, the moving averages
were considered more suited than the LOWESS method. In addition to the visualization of the
Rev. Latino-Am. Enfermagem 2012 July-Aug.;20(4):769-77.
of cases involving TB-AIDS co-infection among the new
cases of TB reported was also veriied. The distribution of
cases of TB and AIDS was plotted, according to sex and
age range. The proportions of the clinical forms of TB –
pulmonary and extra-pulmonary – were also calculated,
according to the carrying out of the HIV test among the
patients with TB. Due to shortcomings in the illing out
of the TB notiication form, variables such as level of
schooling, occupation and other comorbidities were not
studied, compromising the undertaking of multivariate
analyses. A different data collection instrument would
be necessary for studying factors which could alter the
historical trend of the diseases presented.
Electronic spreadsheets and a statistical package
were used for statistical procedures.
This study was approved by the Research Ethics
Committee of the Faculty of Medical Sciences of the
State University of Campinas (UNICAMP), under Verdict
n°413/2006 and was given authorization for the
collection of data.
Results
In the period 2001 – 2009, notiication was received
of 2876 patients with TB, 2619 with AIDS and 512 with
the co-infection. In Table 1, one may observe a higher
CI for TB in 2001 (with 39.61/100,000 inhabitants)
followed by a decrease until 2007, and a rise in 2008
and 2009.
For AIDS, the highest IC was in 2006, with
40.98/100,000 inhabitants. For the cases of
co-infection, a decrease was ascertained during the period
studied. Table 1 also shows that among the TB cases,
the proportion of co-infected individuals varied between
23.1% (in 2002) and 13.8% (in 2009).
Table 1 – Number of cases, incidence coeficients, variation of the number of cases of TB, AIDS and TB-AIDS
co-infection and the proportion of cases of TB-AIDS Campinas, São Paulo, Brazil, 2001-2009
Year Pop.
Tuberculosis n=2.876
AIDS n=2.619
TB-AIDS
n=512 TB-AIDS (%)
n° IC Var (%) n° IC Var (%) n° IC Var (%)
2001 979414 388 39.61 232 23.68 85 8.67 22.0
2002 991893 385 38.81 -2.0 285 28.73 +21.3 89 8.97 +3.5 23.1
2003 1003597 327 32.58 -16.1 377 37.56 +30.7 63 6.27 -30.1 19.3
2004 1016236 300 29.52 -9.4 232 22.82 -39.2 46 4.52 -27.9 15.3
2005 1028599 314 30.52 +3.4 348 33.83 +48.2 47 4.56 +0.9 15.0
2006 1039397 297 28.57 -6.4 426 40.98 +21.1 47 4.52 0 15.8
2007 1050299 264 25.13 -12.0 281 26.75 -34.7 44 4.18 -7.5 16.7
2008 1061316 296 27.88 +10.9 219 20.63 -22.9 49 4.61 +10.3 16.5
2009 1072418 305 28.44 +2.0 219 20.42 -0.97 42 3.91 -15.2 13.8
Pop= Population N°= number of cases
IC=Incidence Coeficient
Var= Variation
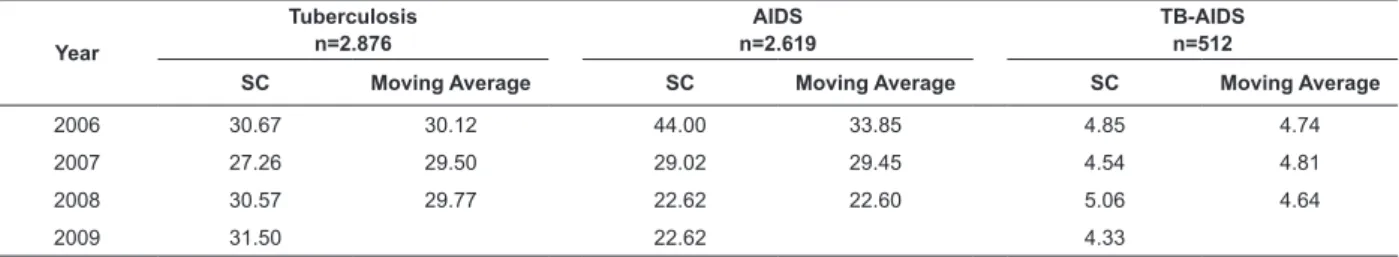
Table 2 presents the standardized coeficients and
moving averages for TB, AIDS and TB-AIDS co-infection.
Comparison of the raw and standardized coeficients
showed a small difference between the two.
Year
Tuberculosis n=2.876
AIDS n=2.619
TB-AIDS n=512
SC Moving Average SC Moving Average SC Moving Average
2001 40.07 23.96 8.77
2002 39.76 37.86 29.43 29.99 9.19 8.15
2003 33.77 34.83 38.93 29.70 6.50 6.81
2004 30.98 32.39 23.96 31.40 4.75 5.36
2005 32.43 31.36 35.94 32.54 4.85 4.81
Table 2 – Standardized coeficients and moving averages for TB, AIDS, and TB-AIDS co-infection. Campinas, São Paulo, Brazil, 2001-2009
Women
Year Tuberculosis (n=932) AIDS (n=896)
0-9 10-19 20-39 40-59 60 e + 0-9 10-19 20-39 40-59 60 e +
2001 18.64 12.61 37.84 30.23 18.84 1.33 1.14 26.95 14.22 5.65
2002 7.84 10.17 30.02 27.34 35.70 0 4.52 37.38 15.87 0
2003 3.85 11.13 35.84 15.79 20.70 2.56 1.11 48.72 50.90 7.52
2004 5.04 13.18 21.55 25.16 33.64 6.31 1.09 32.05 19.08 5.60
2005 12.40 13.00 19.10 28.39 48.46 14.88 3.25 44.22 23.23 5.59
2006 7.33 10.70 19.44 17.94 26.03 0 2.14 47.00 39.30 9.29
2007 8.43 6.34 21.92 18.65 12.98 2.40 2.11 34.75 28.82 7.41
2008 8.33 7.30 20.66 20.20 33.33 2.38 0 20.13 18.52 5.55
2009 7.03 9.28 21.99 20.85 14.74 2.34 1.03 19.37 15.01 5.53
Men
Year Tuberculosis (n=1910) AIDS (n=1722)
0-9 10-19 20-39 40-59 60 e + 0-9 10-19 20-39 40-59 60 e +
2001 12.84 14.83 65.97 91.67 59.97 1.28 3.42 61.26 48.76 14.99
2002 8.83 13.50 70.91 91.75 72.15 0 0 78.47 57.95 4.97
2003 6.19 6.65 52.14 76.25 66.49 3.71 1.10 78.50 77.20 7.38
2004 6.08 7.65 48.67 70.09 49.34 1.21 0 51.50 43.57 12.33
2005 0 11.85 50.83 62.84 71.21 7.17 3.23 81.55 56.27 14.73
2006 12.96 12.78 43.07 78.12 58.72 7.07 0 105.48 79.98 7.34
2007 4.64 7.36 38.78 65.43 48.72 1.16 2.10 63.36 46.08 12.18
2008 5.74 12.45 45.90 71.77 38.53 1.14 2.07 54.54 39.06 16.86
2009 5.65 7.18 39.52 84.99 82.04 2.26 0 52.87 44.30 19.30 SC= standardized coeficient
Table 2 - (continuation)
Year
Tuberculosis n=2.876
AIDS n=2.619
TB-AIDS n=512
SC Moving Average SC Moving Average SC Moving Average
2006 30.67 30.12 44.00 33.85 4.85 4.74
2007 27.26 29.50 29.02 29.45 4.54 4.81
2008 30.57 29.77 22.62 22.60 5.06 4.64
2009 31.50 22.62 4.33
Between 2001 and 2009 notiication was received
of 941 female patients with TB and 1935 male patients
with TB (Table 3). Among women, the higher incidences
predominated in the age range ‘60 years and over’,
while among men the higher ICs were observed in the
age range 40 – 59. The ratio between the male/female
sexes (M/F) varied from 1.7 in 2005 to 2.3 in 2009 (data
not presented in the tables).
In relation to AIDS, 896 new cases were notiied
among women, and 1722 among men (Table 3). There
was practically no variation in the ratio among men,
with 2.4 in 2001 and 2.5 in 2009 (data not presented in
the tables). For both sexes, the highest incidences were
between 20 and 39 years of age. In the years 2007 –
2009, an increase was observed in the incidence among
men aged 60 or over.
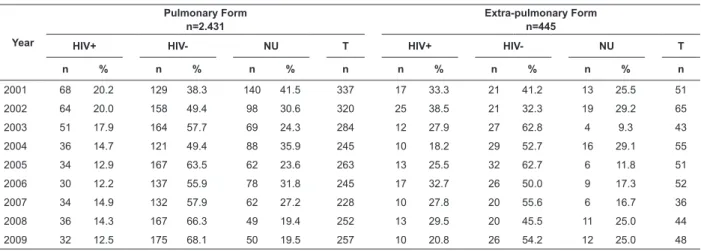
2431 patients were diagnosed with pulmonary TB,
and 445 with extra-pulmonary TB. The number of HIV
tests not carried out was high. (Table 4).
Table 3 – Incidence coeficients for TB and AIDS, according to sex and age range. Campinas, SP, Brazil, 2001-2009
Rev. Latino-Am. Enfermagem 2012 July-Aug.;20(4):769-77.
Year
Pulmonary Form n=2.431
Extra-pulmonary Form n=445
HIV+ HIV- NU T HIV+ HIV- NU T
n % n % n % n n % n % n % n
2001 68 20.2 129 38.3 140 41.5 337 17 33.3 21 41.2 13 25.5 51
2002 64 20.0 158 49.4 98 30.6 320 25 38.5 21 32.3 19 29.2 65
2003 51 17.9 164 57.7 69 24.3 284 12 27.9 27 62.8 4 9.3 43
2004 36 14.7 121 49.4 88 35.9 245 10 18.2 29 52.7 16 29.1 55
2005 34 12.9 167 63.5 62 23.6 263 13 25.5 32 62.7 6 11.8 51
2006 30 12.2 137 55.9 78 31.8 245 17 32.7 26 50.0 9 17.3 52
2007 34 14.9 132 57.9 62 27.2 228 10 27.8 20 55.6 6 16.7 36
2008 36 14.3 167 66.3 49 19.4 252 13 29.5 20 45.5 11 25.0 44
2009 32 12.5 175 68.1 50 19.5 257 10 20.8 26 54.2 12 25.0 48 Table 4 – Number of cases of, and incidence coeficient of TB, according to clinical presentation and results of HIV
test. Campinas, São Paulo, Brazil, 2001-2009
NU = not undertaken/unknown T = total
Discussion
The change in the frequency of the diseases can be
studied through the historical series and the number of
years depends on the availability of data. The incidence
is the indicator which, in the case of tuberculosis,
responds most slowly to control measures. According to
the W.H.O(1), even in countries which have the disease under control, incidence does not decline more than 5 –
10% per year.
As the city of Campinas had an incidence rate of
26.4 per 100,000 inhabitants em 2010(3), it is classiied as having average incidence(1). Table 1 shows that in the period 2001-2009 there was a reduction in the number
of cases of TB and in its IC, although the category of
low incidence – with less than 20 cases per 100,000
inhabitants – remains distant.
Both TB and AIDS present a higher number of cases
among men, principally affecting the
economically-active population. This data is similar to that from other
municipalities in the state of São Paulo(2,10). Among men, the higher incidences of TB were in the age range 40
– 59 years old, followed by 60 years and over. Among
women, the higher incidences alternated between 20 –
39 years old and 60 years and over. TB in the elderly
is becoming more evident due to the ageing of the
population, the increase in life expectancy, and the
improvement in quality of life. The elderly are, however,
subject to risk factors such as poverty, malnutrition and
smoking, which favor the re-activation of the bacillus(13). In relation to AIDS, in the state of São Paulo, the
ratio between the male and female cases was 34:1 in
1985; a tendency to fall was shown until 1996, with 2:1
after which it remained stable until 2011(10). Campinas, with a ratio of 2.5:1, in 2009, was following the same
tendency as the state of São Paulo having passed through
important processes such as heterosexualization,
decentralization, feminization and the pauperization(14) of the epidemic.
AIDS, which used to be little-spread among the
states of Brazil, has become wide-spread in the country
over the years, principally in the Southwest and
Center-West regions, which have the largest number of cases
reported in Brazil(14-15). On a small scale, Campinas may be considered as a space representing Brazil, and some
factors deserve highlighting: it is near the city of São
Paulo, facilitating both access to this metropolis and the
other small cities around it(3); it has a large number of favelas, while being at the same time a inancial and
business center, attracting investment. Besides this, the
health area receives incentives, carries out research
and has two teaching hospitals. This may explain the
attractiveness that seeking treatment in Campinas has
for ill people, who often fail to mention that they are
from other cities.
In a study on the feminization and pauperization
of AIDS in Campinas(16), differences were observed in the ratio of men to women, which was heterogeneous
in the city itself, higher in the city center and in the
region north of the municipality, and with lower values
in the outskirts, particularly in the region southwest of
the municipality. The increase in the incidence of AIDS
among men aged 60 or over in the years 2007 – 2009
may be attributed to factors linked to sexuality, such as
a low understanding of risk, the practice of sex without
that sexuality has been promoted among the elderly
due to the expectation of having more active lives. In
addition, the impact of the introduction of anti-retroviral
drugs has been to increase the prevalence of individuals
living with AIDS.
The understanding of the presence of TB-AIDS
co-infection is fundamental for the differentiated
monitoring of patients, because this is related with lower
compliance with treatment, higher drug resistance and
higher mortality(17).In this study, a decline was observed in the IC and in the proportion of co-infected patients
with TB, from 23.1% in 2001 to 13.8% in 2009, similar
to that found in other municipalities in the state of São
Paulo(18-19). It is worth emphasizing that the scale of the association between TB and AIDS may not be apparent,
owing to problems related to under-reporting of these
diseases, being estimated at 17.7% for Brazil(20). Another piece of data which calls one’s attention
in this study, contributing to under-reporting, is the
high proportion of HIV tests which are not carried out
(27.5%). Despite the occurrence of a reduction in the
number of tests not carried out among patients with the
pulmonary forms of TB during the period assessed (from
41.5% to 9.5%), the same was not observed among the
extrapulmonary forms. The fewer the TB patients who
do the HIV test, the greater the uncertainty about the
prevalence of co-infection(20).
It may be the case that many ill people fail to take
this test, probably from fear about catching a stigmatizing
disease such as AIDS, from lack of information about the
test´s importance, or due to the dificulties which health
care professionals have in choosing the best approach in
guiding people to take the HIV test and in the requesting
of the test for ill people with TB. The doctor too may
pay little attention to the result of the HIV test among
patients diagnosed with TB, due to having to carry out
too many consultations, to lack of supervision, or lack
of updating.
The application of the HIV test should be guaranteed
to all those who consent, but it must also be ensured
that the results be entered into the information systems
as soon as they become available(20).
The importance of evaluating secondary data, such
as that used in the present study, must be emphasized.
This data should be from different professionals who have
distinct knowledge about the diseases and the different
places in question, and be directed at improving the
quality of the data and implementing interventions(21), in parallel with the organization and maintenance of
a fast and analytical surveillance system, capable of
providing data which preventive actions could be based
on, and for evaluating the situation and the co-infection
tendency(22). In 2004, 26% of Brazilian municipalities – of which 1% had populations equal to or over 20,000
- did not report cases of TB(23).
One of this study’s limitations was the small number
of years of the series. With the exception of TB-AIDS
co-infection after 2004, which showed a tendency to
stabilize, relevant alterations were not detected. Factors
for the possible alterations, such as changes in the
diagnostic criteria or in treatment, were not observed
in the period studied. In the case of AIDS, the drop in
lethality had already been veriied after the introduction
of highly active antirretroviral therapy (HAART) at the
end of 1996(17). Factors linked to the notiication of patients could explain the luctuations observed in the
series studied.
Acknowledgements
We are grateful to the state program for TB for
the provision of TB-WEB for direct researching in the
notiication documentation. Also to the International
Clinical, Operational and Health Services Research
Training Awards Project for AIDS and Tuberculosis
(ICOHRTA) - Brazil and the John Hopkins University for
encouraging the research and for offering courses in the
area of tuberculosis.
Final Considerations
The series’ study, using secondary data, illustrated
the tendency of the number of cases notiied, as well as the epidemiological proile of TB, AIDS and the
TB-AIDS co-infection, allowing the detection of a decrease
in cases of TB until 2007, with an increase in 2008 and
2009. In the case of AIDS, there was a general reduction
from 2007, but with an increase among men aged 60 or
over, in the years 2007 – 2009. For TB-AIDS co-infection,
the tendency was one of reduction. This scenario shows
the need for integration of information on TB and AIDS,
with thorough illing-out of the records for TB-AIDS
comorbidity, and in training which stimulates success
in the communication of the different professionals
involved, as support for planning and control actions.
In the face of the high proportion of HIV tests
which are not carried out (27.5%) among patients
with tuberculosis, the importance must be emphasized
of requesting the test and the guarantee that the
results will be entered on the information systems. It
Rev. Latino-Am. Enfermagem 2012 July-Aug.;20(4):769-77.
the development and concretization of this objective,
when they undertake appropriate monitoring of notiied
cases, in the orientation of community health workers
seeking greater effectiveness in case inding, in directly
supervised treatment, and in the investigation of
contacts between family members.
The interface of actions related to TB and AIDS
occurs in the technical and political area. The present
study’s data strengthens the need for knowledge of
the speciic characteristics related to each region,
with monitoring at a local level, by the TB and AIDS
surveillance systems, contributing to a vision which
completes the understanding of the national panorama
relative to TB-AIDS co-infection.
References
1. World Health Organization. Global tuberculosis
control: WHO report 2011. [acesso 22 ago 2011].
Disponível em: http://www.who.int/about/licensing/
copyright_form/en/index.html.
2. Secretaria do Estado de São Paulo (BR). Centro de
Vigilância Epidemiológica. Série histórica 1998 a 2010
– Casos novos de tuberculose por forma clínica e faixa
etária. [acesso 13 set 2011]. Disponível em: http://www.
cve.saude.sp.gov.br/htm/tb/tb_num/tb_result.htm.
3. Prefeitura Municipal de Campinas (BR). Secretaria
Municipal de Saúde de Campinas. Boletim Epidemiológico
de Tuberculose - 2011. [acesso 17 ago 2011]. Disponível
em: http://www.campinas.sp.gov.br.
4. Dye C, Lönnroth K, Jaramillo E, Williams BG,
Raviglione M. Trends in tuberculosis incidence and their
determinants in 134 countries. Bull World Health Organ.
2009;87:683-91.
5. Murray M, Oxlade O, Lin H-H. Modeling social,
environmental and biological determinants of
tuberculosis. Int J Tuberc Lung Dis. 2011;15(6):S64-S70.
6. Janssens JP, Rieder HL. An ecological analysis of
incidence of tuberculosis and per capita gross domestic
product. Eur Respir J. 2008;32:1415-6
7. Oxlade O, Schwartzman K, Behr MA, Benedetti A,
Pai M, Heymann J, Menzies D. Global tuberculosis
trends: a reflection of changes in tuberculosis control
or in population health? Int J Tuberc Lung Dis.
2009;13(10):1238-46.
8. Gonçalves MJF, Penna MLF. Morbidade por
tuberculose e desempenho do programa de controle em
municípios brasileiros 2001 – 2003. Rev Saúde Pública.
2007;41(supl1):95-103.
9. Grangeiro A, Escuder MML, Castilho EA. Magnitude e
tendência da epidemia de Aids em municípios brasileiros
de 2002-2006. Rev Saúde Pública. 2010;44(3):430-40
10. Secretaria do Estado de São Paulo (BR). Centro de
Vigilância Epidemiológica. Boletim Epidemiológico CRT
DST/Aids. Ano 27(1). 2010. [acesso 15 maio 2012].
Disponível em: http://www.crt.saude.sp.gov.br.
11. World Health Organization. The Global Plan to Stop
TB, 2006–2015. Actions for life – towards a world free
of tuberculosis. Geneva: WHO; 2006. (WHO/HTM/
STB/2006.35).
12. World Health Organization. The Stop TB Strategy:
Building on and enhancing DOTS to meet the TB-related
Millennium Development Goals. Geneva: WHO; 2006.
WHO/HTM/TB/2006.368
13. Davies PDO. TB in the elderly in industrialised
countries. Int J Tuberc Lung Dis. 2007;11:1157-9.
14. Brito AM, Castilho EA, Szwarcwald CL. AIDS e
infecção pelo HIV no Brasil: uma epidemia multifacetada.
Rev Soc Bras Med Trop. 2000;34(2):207-17.
15. Ministério da Saúde (BR). Boletim Epidemiológico
DST-Aids 2010. [acesso 17 ago 2011]. Disponível em:
http://www.aids.gov.br/sites/default/files/anexos/
publicacao/2010/
45974/vers_o_final_15923.pdf
16. Stephan C, Henn CA, Donalisio MR. Expressão
geográfica da epidemia de Aids em Campinas, São Paulo,
de 1980 a 2005. Rev Saúde Pública. 2010,44(5):812-9.
17. Oliveira HB, Marin-León L, Cardoso JC. Perfil de
mortalidade de pacientes com tuberculose relacionada
à comorbidade tuberculose-Aids. Rev Saúde Pública.
2004;38(4):503-10.
18. Santos MLSG, Ponce MAS, Vendramini SHF, Villa
TCS, Santos NSGM, Wysocki AD, et al. A dimensão
epidemiológica da co-infecção TB/HIV. Rev. Latino-Am.
Enfermagem. 2009;17(5):683-8.
19. Secretaria do Estado da Saúde de São Paulo (BR).
Coordenadoria de Controle de Doenças. Tuberculose no
Estado de São Paulo. Indicadores de Morbimortalidade
e Indicadores de Desempenho. Bol Epidemiol Paul.
2006;3,supl 4.
20. Carvalho CN, Dourado I, Bierrenbach AL.
Subnotificação da comorbidade tuberculose e Aids: uma
aplicação do método de linkage. Rev Saúde Pública.
2011;45(3):548-55.
21. Miranda AE, Golub JE, Lucena FF, Maciel EM, Gurgel
MF, Dietze R. Tuberculosis and AIDS co-morbidity in
Brasil: Linkage of the tuberculosis and AIDS databases.
Received: Nov. 22nd 2011
Accepted: Aug. 3rd 2012 22. Jamal LF, Moherdauí F. Tuberculose e infecção pelo
HIV no Brasil: magnitude do problema e estratégias para
o controle. Rev Saúde Pública. 2007;41(supl 1):104-10.
23. Bierrenbach AL, Gomes ABF, Noronha EF, Souza MFM.
Incidência de tuberculose e taxa de cura, Brasil, 2000 a