A Work Project, presented as part of the requirements for the Award of a Masters Degree in Economics from the NOVA – School of Business and Economics.
Economic Rents, Institutions and Growth
International Aid and Natural Resources: a Comparative Analysis
Mariana Ribeiro da Silva Lopes da Fonseca
Student Number – 416
A Project carried out in the Globalization and Development area, under the supervision of: Professor Pedro Camarinha Vicente
Abstract
The aim of this study is to investigate to what extent foreign aid rents and natural resource rents can be compared with respect to their impact on economic growth. For this purpose, the direct impact of both economic rents on GDP growth, as well as their impact conditional on the quality of the institutional environment is assessed in cross-country and panel contexts. A natural resource curse is indeed identified in countries with poor institutional quality, however results regarding the impact of international aid rents are ambiguous.
1 Introduction
Gross Domestic Product (GDP) varies widely across countries. Actually, the highest GDP per capita value achieved by a country in 2010 is more than 500 times the lowest one.1 This huge gap poses serious concerns bearing in mind that GDP is often seen as the most representative measure of economic development. Particularly, GDP growth is linked to progress and prosperity, while its decline is connected to stagnation and poverty. The study of the roots of economic growth is therefore of utmost importance, and constitutes a classical area of research in economics.
As a result of years of investigation, nowadays institutions are thought to play a crucial role in determining economic growth. They are believed to influence economic outcomes through the structuring of economic incentives in the society.2 Hence, several areas in economics are taking a political and institutional approach to economic growth. Among them, the natural resource curse and the aid effectiveness topics that are the focus of this study.
With regards to natural resources, their discovery and exploitation has had perverse effects on the economic growth of several countries worldwide over the past decades. These effects were at first explained relying on an economic resource curse, i.e. the Dutch Disease.3 More recently, albeit not rejecting the Dutch Disease hypothesis, there has been a turn to a political resource curse that is in fact supported by evidence, being the two main findings in the literature that resource rich countries on average do tend to grow slower, but this undesired effect can nevertheless be overcome in a good institutional environment.
The aid effectiveness literature, in turn, provides less homogeneous results. In fact, decades ago international aid programmes started to be carried out, without any convincing empirical or
1
The data on GDP per capita (expressed in current US$) has been retrieved from the World Bank (WB). The richest country in terms of GDP per capita in 2010 is Luxembourg and the poorest Burundi.
2
See Acemoglu, Johnson and Robinson (2005)
3
theoretical foundation and still nowadays there is no compelling evidence of their growth enhancing potential or traceable benefits.
Providing either more, or rather less sharp results, the existence of a vast literature on the macroeconomic effects of both economic rents is undeniable. Furthermore, there is an emergence of new studies comparing aid rents to natural resource rents. Notwithstanding the important differences between them, natural resource rents and foreign aid share in fact two crucial aspects; they are both fungible and have a windfall character, i.e. provide extra revenues to an economy. In this study it is hypothesized that whatever negative impact these extra revenues have, it is a result of the interaction between the rents and the local institutional arrangements. Specifically this analysis tries to answer two questions, in light of the evidence coming from the natural resource curse literature: what is the impact of aid on economic growth and whether this impact depends on the institutional environment. Multiple regression (MR), Fixed Effects (FE) regression, and Instrumental Variable (IV) regression models are the empirical methods used for this purpose.
The MR approach, relying on the Ordinary Least Squares (OLS) estimator, provided evidence of a negative impact of both windfalls on economic growth. When assessing to what extent institutional quality influences this result, the average impact of the rents remained negative, however the impact on economic growth of natural resource rents in the presence of good institutions is estimated as significantly positive, despite lacking robustness. Using country FE, most specifications show a significant positive impact of aid inflows in good institutional environments. The IV regression, in turn, reinforces the results obtained by the OLS estimator in the MR context.
A theoretical model complements the empirical analysis motivating the importance of institutional quality, within a very simple framework that relies on centralized political economy models.
presents the results; section 6 develops the theoretical model; and section 7 concludes. 2 Literature Review
The emergence of a vast literature accounting for the fundamental role of institutions as a determinant of development, shaped economic theory and evidence, with institutions becoming one of the three main factors in explaining cross-country differences in economic performance, along with geography and culture (Acemoglu, Johnson and Robinson 2005). Similarly, European colonization, which shaped the establishment of different types of economic institutions throughout the world, has become an object of study with verified implications for today’s patterns of development (Acemoglu, Johnson and Robinson 2001, 2002b). Ever since, several areas in economics have relied on institutional and political channels when approaching economic growth. 2.1 The Natural Resource Curse
One of the most counterintuitive concepts, and therefore a vastly analysed and debated topic in Development Economics, is the natural resource curse. Throughout the last decades, several theories were put forward in an attempt to shed some light on the dynamics that may be behind the underperformance exhibited by several resource rich economies.
Early literature focused on an economic resource curse. From the Prebish-Singer hypothesis, concerning the disadvantage natural resource dependent countries would likely face given a context of deteriorating terms of trade, that dominated the 50’s and 60’s to the Dutch Disease that had by the 80’s become the prevailing theory explaining the impact of natural resource richness on a country’s growth performance (Corden and Neary 1982).
Notwithstanding the fact that many resource rich economies have performed very poorly in terms of GDP growth, such as Nigeria, Zambia, Sierra Leone, it is undeniable that there are also success cases where the curse is not apparent (e.g. Norway, Botswana, Canada).4 The rationale behind these diverging experiences was uncovered by the recent institutional approach to the natural resource curse. In Robinson Torvik and Verdier (2006) and Caselli and Cunningham (2009) several channels that link natural resources to economic growth are analysed in political economy frameworks. Furthermore, following a rent-seeking approach both Boschini Pettersson and Roine (2007) and Mehlum Moene and Torvik (2006), provide compelling evidence on the fundamental role of institutions in determining the impact of resource rents on economic growth. The later resumes the state of the art in the literature, documenting the existence of a natural resource curse exclusively in countries with poor institutions.
Nonetheless, despite the prevailing view supporting a natural resource curse in weak institutional environments, there is still extensive debate around fundamental aspects of the empirical and theoretical literature. As a matter of fact, concerns regarding the legitimacy of the commonly used measure of resource abundance, which can be in its essence interpreted as a proxy for resource dependency, are pointed out in Brunnschweiler and Bulte (2008) that argue that natural resources negatively affect growth only if they are excessively relied upon. Furthermore, in Brunnschweiler (2008) the author presents evidence of a natural resource blessing, rather than curse. In a different approach Gylfason and Zoega (2006) refuse institutions as the only channel through which natural resources affect growth, documenting the importance of two macroeconomics variables through which natural resources have a direct impact, investment and savings.
Finally, more recent literature has tried to move beyond the regular cross-country evidence and has focused on microeconomic data regarding country specific experiences. In Vicente (2010), changes
4
in perceived corruption in Sao Tome and Principe and Cape Verde are compared following the oil discovery in the former, with the results supporting a political resource curse. In the same spirit, Caselli and Michaels (2009) investigate the impact of natural resources through the study of the variations in oil output among Brazilian municipalities, with the results fitting a model of patronage but specially consistent with theories accounting for the easy appropriation of oil resources.
2.2 International Aid: Effectiveness and Allocation
Having as many supporters as opponents, international aid transfers as a way of reducing poverty dates back to the World War II, inspired by the experience of the Marshall Plan.
Without having so far proved irrefutable results of its benefits, foreign aid is often regarded as the problem rather than the solution. This pessimistic view found its roots in the 70’s due to works by Peter Bauer, who believed that aid would more likely be effective in countries that were not in need of it, the Bauer-paradox. More recently, Easterly (2003) is a strong proponent of this view. Aid optimists on the other hand believe aid inflows are crucial in overcoming major constraints to economic development. This view is expressed in Chenery and Strout (1966), and has been reviewed to include conditionality features, in light of the past decades experience.
In Collier and Dehn (2001), export price shocks were introduced in the analysis of the effectiveness of aid confirming the significance of BD’s results. In fact it is documented that aid is likely to be effective when directed to countries experiencing negative shocks. In Collier and Dollar (2002) the robustness of the results is also validated, through the use of a different measure of policies, and the extension of the period and countries under study.
Nevertheless there are several studies in the literature that refuse these findings. Using the same econometric technique, specification and data, extended through 1993-97, in Eastely Levine and Roodman (2004), the interaction term between policies and aid ceases to be significant, jeopardizing the robustness of the result. Moreover, in Easterly (2003), the use of alternative definitions of aid, policies and growth, as well as different period averages, leads to statistical insignificance of the interaction term under study. Among others also the results documented in Hansen and Tarp (2001), as well as in Brumm (2003), do not support BD’s findings.
Later on, in Burnside and Dollar (2004), the aid-growth relationship is revisited and reviewed. Rather than an index of macroeconomic growth-promoting policies, the interaction term is built using an index of institutional quality. The result is a robust positively significant interaction term, which is strongest in IV regression.
Ambiguity around the relationship between aid and economic growth remains. A recent study describes well where the literature stands: in Rajan and Subramanian (2008), it is found little robust evidence of a positive and negative relation between the two, there is no evidence that aid works better in healthier policy environments, or that certain forms of aid work better than others.
the regime where the welfare of a fixed coalition is maximized through the transference of aid rents to a high-income political elite. A different explanation, which justifies the inefficiency of aid with its positive effect on rent seeking and corruption, is supported in Svensson (2000) and dismissed in Tavares (2003). Furthermore, following a different approach, in Rajan and Subramanian (2005), it is argued that aid may have negative long term effects through a Dutch Disease mechanism.
Besides its effectiveness, another enduring topic in the field of international aid relates to its allocation. In an attempt to explain the pattern of bilateral aid, Dudley and Montmarquette (1976) present one of the first formal models of aid determinants and find that political and economic links to donor countries significantly help explaining aid allocation.
While in early literature (McKinley and Little 1979, Mosley 1981) allocation was estimated through two distinct equations, one accounting for the developmental concerns of the donor and the other for its strategic interests, nowadays studies rely on a model including both recipient characteristics as well as donor interest variables. Evidence is consensual and reports that the political and economic interests of donor countries outweigh the need and merits of the recipient. In Alesina and Dollar (2000) it is documented a tendency of major donors to care about historical factors in what concerns flows to ex-colonies, and also a strong link between UN voting patterns and aid commitments. It is worth noting though that this trend is changing, as reported in Dollar and Levin (2004), that found, mainly during the 90’s, a move towards aid selectivity in what concerns the recipient countries’ institutions and policies.
2.3 Natural Resource Rents and Aid: What brings them together?
As shown, there is a vast literature on the macroeconomic effects of natural resources and international aid. Moreover, a closer look at the literature allows recognizing a similar path, in what concerns both the empirical and theoretical approaches to the two topics.
subject to discretionary distribution by the incumbent (Caselli and Cunningham 2009, Robinson, Torvik and Verdier 2006). In fact, this fungible character of natural resource rents is shared by foreign aid rents as documented in Feyzioglu Swaroop and Zhu (1998). To this extent, both rents represent fungible, extra revenues available to the incumbent. Despite their important differences, the characteristics these rents have in common may be the factors offsetting their potential growth enhancing effects. Even though they are expected to provide a “big-push", which is regarded as essential for economic progress, or relax capital constraints that are seen as a barrier to economic development, and therefore promote growth, so far this has not been confirmed by evidence. Actually, while in Collier (2006) aid is claimed to be on average considerably more effective in promoting development than oil, leading the author to encourage an aid scale up, which as he suggests could provide a big push, in Easterly (2006) this theory is strongly rejected.
Ever since Collier first explicitly compared aid and natural resource rents, new studies have taken the same approach. Namely, the effect of both rents on corruption was comparatively studied in Dalgaard and Olsson (2008) that documents a positive impact of aid and a negative impact of natural resources on corruption, in line with Tavares (2003) and Vicente (2010). Moreover, in Morrison (2007) the author presents a model that aims at dealing with the fungibility of both rents by funnelling them to the citizens rather than to the governments.
3 Empirical Model
!!" = !!"!!+ !!"!!+ !"!"!!"+ !"!"!!"+ !!"!"!"!!+ !"!"!"!"!!+ !!"!!+ !!"
!
(1)
where i indexes countries, t indexes time, !!" is the annual percentage growth of GDP per capita, !!" is the logarithm of initial GDP per capita, !!" is the percentage of aid receipts to GDP, !"!" is the percentage of natural resource rents to GDP, !"!" is a measure of institutional quality, and !!"
!
is the error term. Both !!"!"!" and !"!"!"!" are interaction terms, the first between aid receipts and institutional quality and the later between natural resource rents and institutional quality. Finally, !!" is a vector of other exogenous variables that might affect growth, i.e. control variables; it consists of a measure of the level of investment to control for capital formation, a measure of openness of the economy, which is believed to have a positive impact on growth, and an ethnic tensions index as suggested by Easterly and Levine (1997).5
While the logarithm of initial GDP per capita is included in order to capture convergence effects, the variables measuring natural resource rents and aid receipts as fractions of GDP are included to assess the impact of both on growth. Furthermore, institutional quality being one of the most important variables in this work is included not only to control for the institutional environment, which might affect growth, but also in the interaction terms allowing to infer upon the predicted conditionality. Variants of this equation have been estimated previously in the literature, specifically in Burnside and Dollar (2004), where the authors complement their earlier study by reviewing the interaction term used, to incorporate a institutional quality index. Its differentiating feature concerns the link made with the natural resource curse literature, through the inclusion of the terms !"!" and !"!"!"!". MR, FE and IV procedures are used to estimate equation (1). The first relies on the OLS estimator, which is used as a general technique for estimating linear regression models, however since the introduction in Boone (1996) of the use of instrumental variables, due to concerns about the possible endogeneity of aid inflows, IV regressions have become a standard procedure. This move towards
5
IV regression, which relies on the Two Stage Least Squares (2SLS) estimator, created the need to estimate a new equation relating aid to variables known as instruments and the exogenous variables included in the equation of interest. The following equation is therefore regressed as a 1st stage in the referred procedure:
!!" = !!!!+ !!"!!+ !"!"!!"+ !"!"!!"+ !!"!!+ !!"
!
(2)
where !! is a vector of instrumental variables. The two instruments used in this study are the logarithm of population and the colonial links between donor and recipient countries. While the first was already used as an instrument in Boone (1996), the choice of the second was motivated by the literature concerning the allocation of aid that reports evidence of a trend of aid rents flowing from former colonizers to former colonies (Alesina and Dollar 2000, Dudley and Montmarquette 1976). Regarding the FE regression model, while time fixed effects are widely used in the aid literature, and are employed in this study in every specification for robustness, country fixed effects are seldom used to assess the impact of aid inflows on GDP growth.6 Nevertheless, this study implements this procedure given its unique feature of controlling for unobserved variables that are intrinsic to the countries and do not vary over time, hence minimizing omitted variable bias.
Furthermore, it is a common practice to divide the time frame into sub-periods.7 This is done for mainly three reasons: it increases the size of the sample; it is useful to explore the time dimension in the data; and it eliminates business cycle factors and measurement error. In this study the 22-years time frame is divided into four sub-periods, of 5 years each with the exception of the last period which averages the last 7 years under analysis, from 2000 to 2006.8
6
Time fixed effects were used in Boone (1996), Burnside and Dollar (2000, 2004),Collier and Dehn (2001), Easterly Levine and Roodman (2004) among others. Country fixed effects were used in Hansen and Tarp (2001) and Rajan and Subramanian (2008).
7
While Burnside and Dollar (2000) use 4-year periods, Boone (1996) uses both 5-year and decade averaged data and Easterly (2003) uses 8, 12 and 24 year periods.
8
4 Data: Main Variables Description and Sources9
The dependent variable in equation (1) is the WB series entitled GDP per capita growth (annual %) and defined as the annual percentage growth rate of GDP per capita.
Aid is measured as the net disbursements of Official Development Assistance (ODA) available from the Development Assistance Committee (DAC-OECD).10 It is expressed in current US$ and defined as flows that are concessional in character and convey a grant element of at least 25%. For the purpose of this work it is divided by the WB series GDP (current US$).
Following Sachs and Warner (1995), the WB series total resource rents to GDP, defined as the sum of oil, natural gas, coal, mineral, and forest rents, is used as the measure of natural resources.
Regarding institutional quality, two different measures are used to capture this variable throughout the empirical analysis, being both based on data from the International Country Risk Guide (ICRG-PRS), the most widely used source of information on institutions in the literature.11 The first, used as the prime measure of institutional quality in this study, consists of an unweighted average of four indices: Law and Order, Investment Profile, Bureaucratic Quality and Corruption.12 The resulting index is believed to capture the essence of the degree of property rights protection and rule of law prevalence. The second measure is used in order to test for robustness and consists solely of the Law and Order index.13 The institutional quality variable, which is not provided for several developing countries, is the major source of constraint in terms of data availability.
5 Empirical Results
The evidence presented in this section results from the estimation of the equations described above using a panel of 88 countries with data across four five-years periods from 1985 to 2006.
9
The description and source of all variables in this study is available in the Appendix Table A.1.
10
ODA is used to measure aid also in Boone (1996), Easterly (2003), Burnside and Dollar (2004).
11
ICRG-PRS constitutes the source of information regarding institutional quality in Sachs and Warner (1995), Burnside and Dollar (2000, 2004), Easterly Ross and Levine (2004), Tavares (2003), Mehlum, Moene and Torvik (2006), among others.
12
The index is based on the analysis of Knack and Keefer (1995).
13
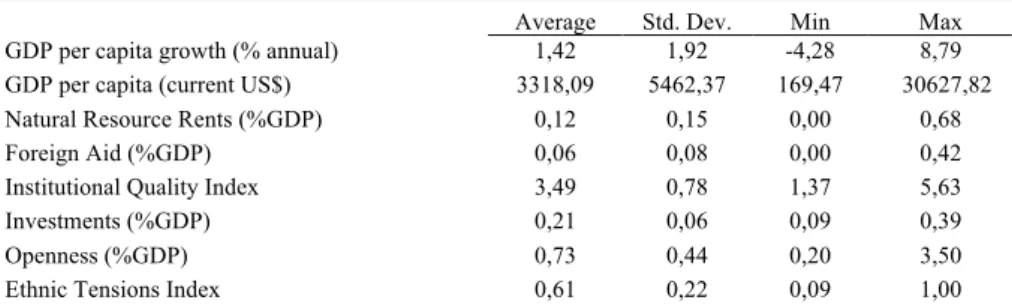
Table 1 - Descriptive Statistics
Average Std. Dev. Min Max
GDP per capita growth (% annual) 1,42 1,92 -4,28 8,79
GDP per capita (current US$) 3318,09 5462,37 169,47 30627,82
Natural Resource Rents (%GDP) 0,12 0,15 0,00 0,68
Foreign Aid (%GDP) 0,06 0,08 0,00 0,42
Institutional Quality Index 3,49 0,78 1,37 5,63
Investments (%GDP) 0,21 0,06 0,09 0,39
Openness (%GDP) 0,73 0,44 0,20 3,50
Ethnic Tensions Index 0,61 0,22 0,09 1,00
Note: The Institutional Quality Index varies from 0 to 6. The Ethnic Tensions Index varies from 0 to 1.
Descriptive statistics of the main variables across the 22-year timeframe are reported in Table 1. Concerning the economic rents, the average percentage of natural resource rents to GDP is two times the average percentage of foreign aid rents to GDP. Moreover, dependence on natural resource rents appears greater than dependence on foreign aid rents as suggested by the maximum value of the two.
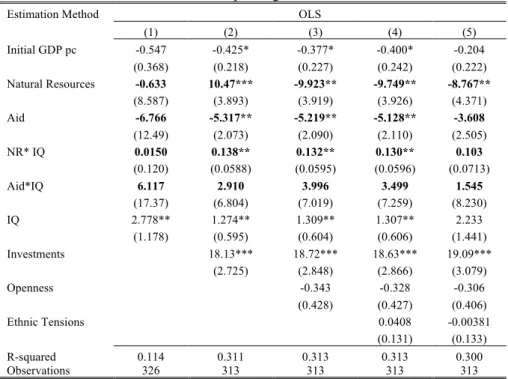
5.1 Multiple Regression Model
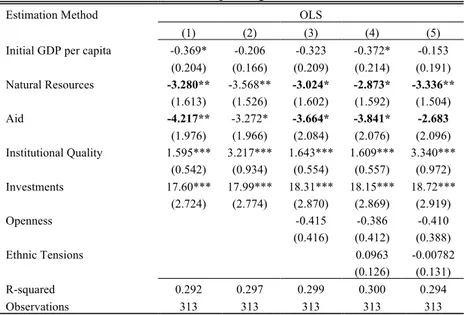
To start with, equation (1) is regressed excluding the interaction terms. The results are presented in Appendix Table A.2 and provide evidence of a significant negative impact of natural resources and foreign aid on GDP per capita growth, robust to the inclusion of controls and to some extent to the use of the second measure of institutional quality.
Table 2 presents the results of the OLS estimation of equation (1) including the interaction terms. Albeit the lack of robustness to a different measure of institutional quality in column (5), and the statistical insignificance of the interaction term involving aid receipts, results are in line with the hypothesis previously described; both economic rents present negative coefficients while both interaction terms present positives coefficients.
significance level, of the hypothesis that there exists no omitted variable. Table 2 – Multiple Regression Model
Estimation Method OLS
(1) (2) (3) (4) (5)
Initial GDP pc -0.547 -0.425* -0.377* -0.400* -0.204
(0.368) (0.218) (0.227) (0.242) (0.222)
Natural Resources -0.633 10.47*** -9.923** -9.749** -8.767**
(8.587) (3.893) (3.919) (3.926) (4.371)
Aid -6.766 -5.317** -5.219** -5.128** -3.608
(12.49) (2.073) (2.090) (2.110) (2.505)
NR* IQ 0.0150 0.138** 0.132** 0.130** 0.103
(0.120) (0.0588) (0.0595) (0.0596) (0.0713)
Aid*IQ 6.117 2.910 3.996 3.499 1.545
(17.37) (6.804) (7.019) (7.259) (8.230)
IQ 2.778** 1.274** 1.309** 1.307** 2.233
(1.178) (0.595) (0.604) (0.606) (1.441)
Investments 18.13*** 18.72*** 18.63*** 19.09***
(2.725) (2.848) (2.866) (3.079)
Openness -0.343 -0.328 -0.306
(0.428) (0.427) (0.406)
Ethnic Tensions 0.0408 -0.00381
(0.131) (0.133)
R-squared 0.114 0.311 0.313 0.313 0.300
Observations 326 313 313 313 313
Note: The dependent variable is GDP per capita growth. IQ stands for Institutional Quality. Variables are described in more detail in the text. In regressions (1) , (2) , (3) and (4), the IQ variable is the contructed IQ Index. In regression (5) the IQ variable corresponds to a Law and Order Index. All regressions include time dummies and a constant, which coefficients are not reported. Robust standard errors in parentheses. Full sample. *significant at 10%, **significant at 5%, ***significant at 1%.
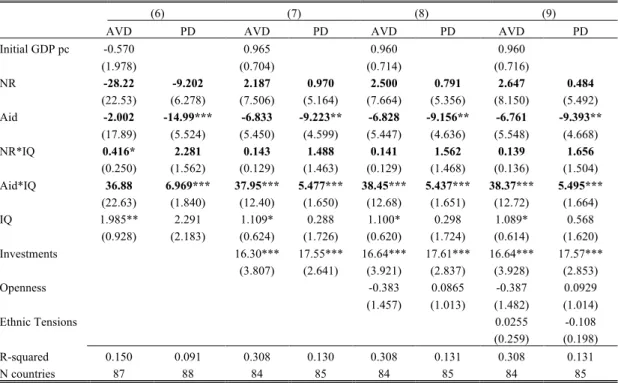
5.2 Fixed Effects Regression Model
A way of controlling for omitted variables is the use of FE regression, the main tool of regression analysis of panel data. As described data have been divided into sub-periods resulting in four observations per country, however to maximize the advantages of this method the whole panel data including every year from 1985 to 2006 is also used in estimating equation (1).
Table 3 – Fixed Effects Regression
(6) (7) (8) (9)
AVD PD AVD PD AVD PD AVD PD
Initial GDP pc -0.570 0.965 0.960 0.960
(1.978) (0.704) (0.714) (0.716)
NR -28.22 -9.202 2.187 0.970 2.500 0.791 2.647 0.484
(22.53) (6.278) (7.506) (5.164) (7.664) (5.356) (8.150) (5.492) Aid -2.002 -14.99*** -6.833 -9.223** -6.828 -9.156** -6.761 -9.393**
(17.89) (5.524) (5.450) (4.599) (5.447) (4.636) (5.548) (4.668)
NR*IQ 0.416* 2.281 0.143 1.488 0.141 1.562 0.139 1.656
(0.250) (1.562) (0.129) (1.463) (0.129) (1.468) (0.136) (1.504) Aid*IQ 36.88 6.969*** 37.95*** 5.477*** 38.45*** 5.437*** 38.37*** 5.495***
(22.63) (1.840) (12.40) (1.650) (12.68) (1.651) (12.72) (1.664)
IQ 1.985** 2.291 1.109* 0.288 1.100* 0.298 1.089* 0.568
(0.928) (2.183) (0.624) (1.726) (0.620) (1.724) (0.614) (1.620)
Investments 16.30*** 17.55*** 16.64*** 17.61*** 16.64*** 17.57***
(3.807) (2.641) (3.921) (2.837) (3.928) (2.853)
Openness -0.383 0.0865 -0.387 0.0929
(1.457) (1.013) (1.482) (1.014)
Ethnic Tensions 0.0255 -0.108
(0.259) (0.198)
R-squared 0.150 0.091 0.308 0.130 0.308 0.131 0.308 0.131
N countries 87 88 84 85 84 85 84 85
Note: AVD stands for Averaged Data. PD Stands for Full Panel Data. The dependent variable is GDP per capita growth. IQ stands for Institutional Quality. Variables are described in more detail in the text. All regressions include time dummies and a constant, which coefficients are not reported. Robust standard errors in parentheses. Full sample. *significant at 10%, **significant at 5%, ***significant at 1%.
5.3 Instrumental Variable Regression Model
The use of IV regression is the most standard approach in the aid literature to overcome the problems of endogeneity and omitted variable bias not addressed by OLS. It involves the use of instruments, which ideally capture the movements in the aid variable that are uncorrelated to the error term in equation (1), allowing for a consistent estimation of its coefficients. A 2SLS estimation strategy fitting equations (1) and (2) is used for this purpose.
Table 4 – Instrumental Variables Regression
Estimation Method 2SLS
(10) (11) (12) (13)
Initial GDP pc -0.750*** -0.748** -0.808** -0.542*
(0.266) (0.298) (0.333) (0.307)
Natural Resources -10.53*** -10.52*** -10.23*** -10.18**
(3.937) (3.942) (3.935) (4.399)
Aid -11.46*** -11.46*** -11.21*** -11.70**
(3.726) (3.806) (3.759) (4.721)
NR*IQ 0.142** 0.142** 0.139** 0.130*
(0.0599) (0.0605) (0.0604) (0.0725)
Aid*IQ 3.053 3.124 1.462 5.862
(9.506) (9.953) (10.53) (13.26)
IQ 1.383** 1.382** 1.386** 1.445
(0.619) (0.623) (0.627) (1.589)
Investments 18.18*** 18.19*** 17.98*** 18.83***
(2.781) (3.002) (3.043) (3.333)
Openness -0.00342 0.0386 0.0551
(0.451) (0.456) (0.446)
Ethnic Tensions 0.0835 0.0450
(0.138) (0.137)
R-squared 0.292 0.292 0.292 0.279
Observations 313 313 313 313
1st Stage
(14) (15) (16) (17)
Initial GDP pc -0.294*** -0.294*** -0.295*** -0.301***
(0.0477) (0.0478) (0.0475) (0.0482) Initial GDP pc ^2 0.0162*** 0.0162*** 0.0162*** 0.0168***
(0.00313) (0.00314) (0.00312) (0.00318)
Population -0.0264*** -0.0263*** -0.0262*** -0.0257***
(0.00284) (0.00347) (0.00356) (0.00343)
Colonies -0.0340*** -0.0341*** -0.0336*** -0.0314***
(0.00861) (0.00812) (0.00871) (0.00820) Natural Resources -0.0496*** -0.0498*** -0.0487*** -0.0516***
(0.0187) (0.0181) (0.0187) (0.0181)
IQ 0.00645 0.00640 0.00599 -0.0158
(0.00833) (0.00833) (0.00807) (0.0215)
Investmets 0.136** 0.135* 0.134 0.143*
(0.0665) (0.0803) (0.0811) (0.0830)
Openness 0.000654 0.000791 0.00236
(0.0103) (0.0104) (0.0102)
Ethnic Tensions 0.000767 0.00195
(0.00234) (0.00228)
R-squared 0.679 0.679 0.679 0.679
Observations 317 317 317 317
Relevance of the instruments test
F ( 2, . ) 43.78 28.95 27.01 28.30
Overidentification test
!!(1) 2.51809 2.72585 2.01601 2.33746
(p = 0.1125) (p = 0.0987) (p = 0.1556) (p = 0.1263)
Notes: The dependent variable is GDP per capita growth in columns (10), (11), (12) ,(13), and Aid in columns (14), (15), (16) and (17). IQ stands for Institutional Quality. Variables are described in more detail in the text. The variables Colonies and Population are used as instruments. In columns (13) and (17) the measure of IQ is the Law and Order index. All regressions include time dummies and a constant, which coefficients are not reported. Robust standard errors in parentheses. Full sample. *significant at 10%, **significant at 5%, ***significant at 1%.
exogenous. As reported there is a non-rejection of the null hypothesis that the instruments are exogenous at 5% significance level, which fulfils the remaining condition confirming the validity of the instruments.
Focusing on the results from the 2nd stage regression, there is evidence of a natural resource curse as documented in Mehlum, Moene and Torvik (2006), robust to the inclusion of all controls and the use of the second measure of institutional quality. Furthermore, the interaction term involving aid has a positive coefficient as in Burnside and Dollar (2004) but it is not significant as in Rajan and Subramanian (2008). The unconditional impact of aid rents is negative, significant and robust. The growth deterrent character of aid rents has been documented previously though as non-robust (Brumm 2003, Easterly 2003, Easterly, Levine and Roodman 2004, Rajan and Subramanian 2008). Contrary to what is documented in Collier (2006) this study is not able to robustly qualify aid rents as superior to natural resource rents, nor to provide compelling evidence of a growth enhancing potential of aid conditional on institutional quality as suggested in Burnside and Dollar (2004). 6 Theoretical Model
The theoretical model hereby developed attempts to predict the impact of international aid and natural resource rents on growth through an institutional channel, and is adapted from the workhorse model in Besley and Persson (2010). It is a centralized political economy model, which along with the rent seeking approach and the Dutch Disease models are representative of the main theories in the aid effectiveness and natural resource literature.14
This model relies on the assumption that aid rents, as well as natural resource rents accrue entirely to the political elite and are thus subject to the leader’s discretionary behaviour.15 The leader’s budget consists therefore of both aid and natural resource rents, which will be collectively referred to as windfalls, denoted by W and normalized to one.
14
This model is characterized as a centralized political economy model due to its focus on the incentives and constraints faced by a political elite. Decentralized models, i.e. rente seeking, focus on the incentives faced by private individuals.
15
The economy is characterized by a non-booming, yet productive, tradable sector. Formally, the tradable sector GDP depends on the share of W invested in the economy (!), according to the
following production function
! ! =!!/!. (3)
that is increasing in the share ! but characterized by diminishing returns (!! > 0;!!!< 0).
As in all political economy models, there is state intervention that in this case is modelled as a decision making process by a political elite, represented by a pro-active, self-interested utility maximizing individual, henceforth the leader. The leader’s decision entails allocating W across his own consumption of politically valuable goods, which can be thought of as distributions across the elite that are unproductive from an economic point of view, or to investments in the economy. However the freedom the leader enjoys in allocating W across the two ends is constrained by an exogenous variable ! that captures the quality of the local institutional environment and assumes
values from 0 to 1, i.e. ! ∈ 0,1 , with high values indicating high institutional quality. For
simplicity the computations rely on the use of the parameter ! =(1−!), that varies inversely to ! though also between 0 and 1. All in all, the leader maximizes the following utility function
!! = 1−! !+!"(!) (4)
where ! is an exogenous tax rate. Hence, the share the leader directs to his own consumption of politically valuable goods, (1−!), enters his utility function directly, while the share devoted to
investments in the economy enters through the taxation levied on the productive tradable sector. The leader cannot capture the entire tradable sector GDP due to the distortionary effects of taxation. The focus should lie on the parameter !, that enters the utility function creating a mechanism that
higher enforcement of rule of law and protection of property rights in better institutional environments that leave less room for the leader to not honour his commitments with the aid agencies, or the closer link between citizens and government in better institutional environments that promote transparency and government accountability. On the other hand if the institutional quality is very poor, it does not play a significant role in influencing the allocation of W.
Plugging equation (3) into equation (4) and taking the first order condition (FOC) with respect to the variable of choice, !, yields
!
!!!/!=! !=
!
!
!
! !
(5)
which shows the allocation of aid rents and natural resource rents to investments in the economy depends positively on the tax rate and institutional quality. Given that ! is exogenous the focus is on the parameter !, whose interpretation is summarized in Proposition 1.
Proposition 1. The higher the institutional quality, the higher is the share of aid and natural
resource rents allocated to investments in the economy.
Finally an adaptation of the Solow model relates the allocation decision made by the leader and GDP growth. Assuming the share ! of the aid and natural resource rents allocated to investments in
the economy has an impact on long-term growth through the accumulation of capital, the dynamics between the windfall and GDP growth can be derived. Starting with a standard production function
!=!"!!!!!
!"#$"%!&$ !"#$
!=!!! (6)
where A represents technology, the parameter ! is the share of capital in income, != ! ! and ! =! !. And relying on the following capital accumulation equation
! =!−!" (7)
where ! refers to the depreciation rate and ! corresponds to investment and therefore to the share !
! =!"−!"
!"#$"%!&$ !"#$
!=!"
! − !+! ! (8)
with ! being population growth rate, and from where it is possible to derive the following conditions
!" !< !+! ! !<0; !" !> !+! ! !>0; !" != !+! ! !=0.
The implications coming from the above conditions lead to the following proposition
Proposition 2. There is capital accumulation only if the magnitude of the investment in the
economy exceeds the depreciation rate of capital coupled with the growth rate of the population.
Furthermore GDP growth can be written relying on equations (6) and (8) as
!! =
!
!=!
!
!+
! ! =!
!"
! − !+! +
! !
and given the fact that both rents have been considered in the empirical model as shares of GDP it is more consistent to write the above equation as
!! =!
!"
! !
!− !+! +
! !
and derive the FOC w.r.t. the share of aid and natural resource rents to GDP
!!! ! !"
!
=!"! !
whose intuitive result is expressed in Proposition 3.
Proposition 3. The impact of aid and natural resources on economic growth if fundamentally
positive and depends on the share allocated to investments in the economy.
This model therefore uncovers the growth enhancing potential of both economic rents that is offset by poor institutions that do not enforce the allocation of a share of the revenues high enough to overcome the depreciation rate of capital and the growth rate of the population allowing for capital accumulation and long-term growth.
7 Conclusion
natural resource rents on GDP growth. The aim was to assess to what extent both revenues are comparable. To this end two questions were addressed, namely what is the impact of aid on GDP growth and if this impact is linked with the local institutional environment.
Using the standard measures of aid, natural resources, institutional quality and growth, and relying on controls previously used in the literature, the results were not encouraging with respect to foreign aid inflows. While the results regarding the impact of natural resource rents were consistent with previous literature, reinforcing the acknowledged conditionality on institutions, aid inflows’ positive impact on growth in a good institutional environment was left to prove given the lack of robustness of the results.
Once again the aid-growth relationship has been revisited, both in cross-country and panel contexts, without providing any conclusive results. Further research should aim at going beyond cross-country analysis, and uncover what lies behind the impact of aid on economic growth. Analysing through what channels aid may be either promoting or hindering growth and understanding the different successful or rather unsuccessful experiences is imperative in order to promote aid effectiveness. Also, to bear in mind that every case is unique is very important in a developing world that comprises such a vast and dissimilar amount of countries.
Appendices
Table A.1 – Data Description and Sources
Variable Description Source
GDP per capita growth Annual growth rate of GDP per capita WB
Initial GDP per capita Logarithm of GDP per capita (current US$) measured at the beginning of each period WB
Natural Resource Rents Total natural resource rents as % GDP WB
Foreign Aid Net disembursementsof ODA (current US$) as % GDP DAC-OECD; WB
Intitutional Quality Index Unweighted average of the indices: Law and Order, Corruption, Investment Profile and
Bureaucratic Quality ICRG-PRS
Investments Gross capital formation as %GDP WB
Openness Sum of exports and imports of goods and services as %GDP WB
Ethnic Tensions Ethnic Tensions Index ICRG-PRS
Colonies Dummy variable equal to one if the country is a former colony of France, UK or
Belgium CIA
Population Logarithm of total population WB
Note: WB refers to the World Bank Data Catalog. DAC-‐OECD, in turn, refers to the Development Assistance Committee of the Organization for the Economic Co-‐operation and Development. The ICRG-‐PRS is the International Country Risk Guide from the Political Risk Services Group. Finally the CIA is the Central Intelligence Agency World Fact Book.
Table A.2 – Multiple Regression Model
Estimation Method OLS
(1) (2) (3) (4) (5)
Initial GDP per capita -0.369* -0.206 -0.323 -0.372* -0.153 (0.204) (0.166) (0.209) (0.214) (0.191) Natural Resources -3.280** -3.568** -3.024* -2.873* -3.336**
(1.613) (1.526) (1.602) (1.592) (1.504) Aid -4.217** -3.272* -3.664* -3.841* -2.683
(1.976) (1.966) (2.084) (2.076) (2.096) Institutional Quality 1.595*** 3.217*** 1.643*** 1.609*** 3.340***
(0.542) (0.934) (0.554) (0.557) (0.972) Investments 17.60*** 17.99*** 18.31*** 18.15*** 18.72***
(2.724) (2.774) (2.870) (2.869) (2.919)
Openness -0.415 -0.386 -0.410
(0.416) (0.412) (0.388)
Ethnic Tensions 0.0963 -0.00782
(0.126) (0.131)
R-squared 0.292 0.297 0.299 0.300 0.294
Observations 313 313 313 313 313
References
Acemoglu, Daron; Simon Johnson and James A. Robinson. 2002a. "An African Success Story: Botswana," D. Rodrik, In Search of Prosperity: Analytic Narratives on Economic Growth. Princeton University Press, 80-122.
Acemoglu, Daron; Simon Johnson and James A. Robinson. 2001. "The Colonial Origins of Comparative Development: An Empirical Investigation." American Economic Review, 91, 1369-401.
Acemoglu, Daron; Simon Johnson and James A. Robinson. 2005. "Institutions as the Fundamental Cause of Long-Run Economic Growth," P. A. a. S. Durlauf, Handbook of Economic
Growth. 386-472.
Acemoglu, Daron; Simon Johnson and James A. Robinson. 2002b. "Reversal of Fortune: Geography and Institutions in the Making of the Modern World Income Distribution." Quarterly
Journal of Economics, 117, 1231-94.
Alesina, Alberto and David Dollar. 2000. "Who Gives Foreign Aid to Whom and Why?" Journal
of Economic Growth, 5(1), 33-63.
Besley, Timothy and Torsten Persson. 2010. Pillars of Prosperity: The Political Economics of
Development Clusters. Princeton University Press.
Boone, Peter. 1996. "Politics and the Effectiveness of Foreign Aid." European Economic Review, 40 (2), 289-329.
Boschini, Anne D.; Jan Pettersson and Jesper Roine. 2007. "Resource Curse or Not: A Question of Appropriability." Scandinavian Journal of Economics, 109(3), 593-617.
Brumm, Harold J. 2003. "Aid, Policies and Growth: Bauer Was Right." Cato Journal, 23(2), 167-75.
Brunnschweiler, Christa N. 2008. "Cursing the Blessings? Natural Resource Abundance, Institutions, and Economic Growth." World Development, 36(3), 399-419.
Brunnschweiler, Christa N. and Erwin H. Bulte. 2008. "The Resource Curse Revisited and Revised: A Tale of Paradoxes and Red Herrings." Journal of Environmental Economics and
Management, 55(3), 248-64.
Burnside, Craig and David Dollar. 2000. "Aid, Policies, and Growth." The American Economic
Review, 90(4), 847-68.
Burnside, Craig and David Dollar. 2004. "Aid, Policies, and Growth : Revisiting the Evidence."
World Bank Policy Research Working Paper 3299.
Caselli, Francesco and Tom Cunningham. 2009. "Leader Behaviour and the Natural Resource Curse." Oxford Economic Papers, 61(4), 628-50.
Caselli, Francesco and Guy Michaels. 2009. "Do Oil Windfalls Improve Living Standards? Evidence from Brazil." NBER Working Paper 15550.
Chenery, Hollis B. and Alan M. Strout. 1966. "Foreign Assistance and Economic Development."
The American Economic Review, 56(4), 679-733.
Collier, Paul. 2006. "Is Ais Oil? An Analysis of Whether Africa Can Absorb More Aid." World
Development, 34, 1482-97.
Collier, Paul and Jan Dehn. 2001. "Aid, Shocks, and Growth." World Bank Policy Research
Working Paper 2688.
Collier, Paul and David Dollar. 2002. "Aid Allocation and Poervty Reduction." European
Economic Review, 45(8), 1470-500.
Corden, W. Max and J. Peter Neary. 1982. "Booming Sector and De-Industrialisation in a Small Open Economy." The Economic Journal, 92(368), 825-48.
Development." Journal of African Economies, 17, 72-109.
Dollar, David and Victoria Levin. 2004. "The Increasing Selectivity of Foreign Aid 1984-2002."
World Bank Policy Research Working Paper 3299.
Dudley, Leonard and Claude Montmarquette. 1976. "A Model of the Supply of Bilateral Foreign Aid." American Economic Review, 66(1), 132-42.
Easterly, William. 2003. "Can Foreign Aid Buy Growth?" The Journal of Economic Perspectives, 17(3), 23-48.
Easterly, William. 2006. "Reliving the 1950s: The Big Push, Poverty Traps, and Takeoffs in Economic Development." Journal of Economic Growth, 11(4), 289-318.
Easterly, William and Ross Levine. 1997. "Africa's Growth Tragedy: Policies and Ethnic Divisions." The Quarterly Journal of Economics, 112(4), 1203-50.
Easterly, William R.; Ross Levine and David Roodman. 2004. "New Data, New Doubts: A Comment on Burnside and Dollar's "Aid, Policies, and Growth" " American Economic Review, 94(3), 774-80.
Feyzioglu, Tarhan; Vinaya Swaroop and Min Zhu. 1998. "A Panel Data Analysis of the Fungibility of Foreign Aid." The World Bank Economic Review, 12(1), 29-58.
Gylfason, Thorvaldur and Gylfi Zoega. 2006. "Natural Resources and Economic Growth: The Role of Investment " The World Economy, 29(8), 1091-115.
Hansen, Henrik and Finn Tarp. 2001. "Aid and Growth Regressions." Journal of Development
Economics, 64(2), 547-70.
Knack, S. and P. Keefer. 1995. "Institutions and Economic Performance: Cross-Country Tests Using Alternative Institutional Measures." Economics and Politics, 7, 207-27.
McKinley , R. and R. Little. 1979. "The Us Aid Relationship: A Test of the Recipient Need and the Donor Interest Models." Political Studies, 27(2), 236-50.
Mehlum, Halvor; Karl Ove Moene and Ragnar Torvik. 2006. "Institutions and the Resource Curse." The Economic Journal, 116, 1-20.
Morrison, Kevin M. 2007. "Natural Resources, Aid, and Democratization: A Best-Case Scenario."
Public Choice, 131, 365-86.
Mosley, Paul. 1981. "Models of Aid Allocation Process: A Comment on Mckinley and Little."
Political Studies, 29(2), 245-53.
Rajan, Raghuram G. and Arvind Subramanian. 2008. "Aid and Growth: What Does the Cross-Country Evidence Really Show?" Review of Economics and Statistics, 90 4, 643-65.
Rajan, Raghuram and Arvind Subramanian. 2005. "What Undermines Aid's Impact on Growth?" National Bureau of Economic Research Working Paper Series, No. 11657.
Robinson, James A.; Ragnar Torvik and Thierry Verdier. 2006. "Political Foundations of the Resource Curse." Journal of Development Economics, 79 2, 447-68.
Sachs, Jeffrey D. and Andrew M. Warner. 1995. "Natural Resource Abundance and Economic Growth." NBER, Working Paper 5398.
Svensson, Jakob. 2000. "Foreign Aid and Rent-Seeking." Journal of International Economics, 51 2, 437-61.
Tavares, Jose. 2003. "Does Foreign Aid Corrupt?" Economics Letters, 79 1, 99-106.
Vicente, Pedro C. 2010. "Does Oil Corrupt? Evidence from a Natural Experiment in West Africa."