A Work Project, presented as part of the requirements for the Award of a Masters Degree in Economics from the NOVA – School of Business and Economics.
The Economic Value of Portuguese Pine and
Eucalyptus Forests
Ana Filipa Faria Lopes #503
Masters in Economics
Abstract: This paper estimates the total economic value for the Portuguese pine and eucalyptus forest ecosystems considering market services (timber and non timber forest products) and non-market services (recreation, landscape, carbon sequestration, watershed protection, protection of soil erosion and biodiversity). According to the results obtained, at least half of the values of the ecosystems in study come from non-market services, and eucalyptus forests are more valuable than pine forests, even after including fire risks. Moreover, the results also suggest a non-optimal management of Portuguese pine forests.
Keywords: Ecosystem Services; Total Economic Value; Portuguese Forests
1. Introduction
This dissertation aims at quantifying the total economic value of Portuguese pine and eucalyptus forests. Forests provide employment and contribute significantly to the Portuguese GDP (Gross Domestic Product). Attributing a value to forest ecosystems is important to ensure their protection, as opposed to other land uses. Eucalyptus and pine forests are the most representative tree species in the Portuguese forestry sector, mainly due to commercial interests.
Forests provide a variety of services. These can be divided in market services (timber exploitation and non-timber forest products) and non-market services (recreation, landscape, carbon sequestration, watershed protection, protection from soil erosion and biodiversity). However, provision of non-market services are not internalized by the private owner. Therefore, to maximize the value of forest ecosystems from a social perspective, society’s optimal management will be different from private owners’.
The total economic value (TEV) of each service is obtained by summing up the value of each service, for which different methodologies were chosen, summarized in Annex 1.
The obtained results provide evidence that eucalyptus forests have a greater value than pine forests. It also found that half of the value of pine and eucalyptus forest ecosystems can be attributed to the value of non-market services. This means that there is scope for intervention towards greater forest conservation since 86% of forested land is privately owned.
The remainder of the paper is as follows. The second section describes the forestry sector and current legislation that regulates the forestry sector. The third section presents ecosystem services theory and the Faustmann model with externalities. The fourth section presents the literature review, with both some national and international studies. The fifth and sixth sections present the methodology and results obtained for each ecosystem service, respectively, and section seven concludes. Annex 1 summarizes the description, methodology and data source used for each service.
2. Brief Description of Portuguese Forests
2.1. The Portuguese Forestry Sector
Forests are an important element of the Portuguese landscape. As shown
in Graph 1, forests are the most
common land use, with 39% of land used for forestry purposes (3.45 million hectares). Portugal has
39%
21% 2% 33%
5%
Forest
Other forested lands
Interior waters
Agriculture
Other uses
Graph 1 – Percentage of Land Use by Purpose in Continental Portugal (Source: INF, 2005)
the 12th biggest forest area in the European Union (EU) (BES, 2011). Agricultural land and other forested lands are other important land uses (33 and 21% respectively).
The Portuguese forestry sector contributed 1,65% to the Portuguese GDP in 2008 and the sector’s GVA (gross value added) was 310€ per hectare, the highest value recorded by EU countries (BES, 2011). About 1,8% of Portuguese employment is provided by forests (227.800 people in connected activities to forestry as stated in Mendes, 2005).
The risk of fire is the biggest threat for the Portuguese monoculture forests (BES, 2011). It endangers biodiversity, destroys physical capital and decreases investment (MEA, 2009). Graph 2 illustrates the number of fires and burnt area in Portugal. Until 2004 both the burnt area and the number of fires were relatively high, but due to more vigilance and prevention efforts in 2004, both burnt area and number of fires have decreased. The number of fires has remained relatively stable with a decreasing trend from 2005 until 2008, after which it increased slightly.
Graph 2 – Number of fires (bars/left scale) and burnt area (line/right scale) in Portugal from 2001 to 2010 (Source: Autoridade Florestal Nacional)
The distribution of tree species across the Portuguese territory is described in Graph 3. Eucalyptus, a hardwood tree, and pine tree, a softwood tree, were the tree types considered in this study and are the most representative forests in the Portuguese
0 100.000 200.000 300.000 400.000 500.000
0 10.000 20.000 30.000 40.000
2001 2002 2003 2004 2005 2006 2007 2008 2009 2010
Number of fires Burnt Area
landscape, with 23% and 28% of forest territory occupation, respectively, followed by the cork tree (23%).
The eucalyptus production cycle is between 9 and 12 years (MEA, 2009) because eucalyptus is a fast growth species (compared with the pine tree) and management is mostly motivated for commercial uses, mainly by the pulp and paper industries. Whereas the pine forest
management is also focused on commercial uses, exploitation of these forests is not as intensive as in the case of eucalyptus. There are other distinguishing impacts on the environment, notably on watershed protection. While the eucalyptus is a thirsty tree, thus putting at risk watershed protection, the pine tree purifies the underground water.
Because of their importance on the Portuguese landscape and apparent contrasting characteristics, the aim of this dissertation is thus to estimate the economic value of the forests of pine and eucalyptus.
Landowners do not internalize the provision of market services, leading to the non-optimal management of forests. About 86% of Portuguese forest is privately-owned (MEA, 2009), and private owners will react to mechanisms.
Total Maritime Pine Eucalyptus
State Forests (%) 1,2 2,8 0,0
Other/Private (%) 98,8 97,2 100,0
28%
23% 23%
13% 5%
4% 1% 0% 3% 0% Maritime Pine
Eucalyptus
Cork
Holm Oak
Oak
Stone Pine
Chestnut
Thorntree
Other
Graph 3 – Percentage of forest area occupied by each tree species (Source: INF 5, 2006)
Table 1 – Description of percentage of forest land owned by state or other private agents and by tree species (Source: Mendes (2005), DGF (1992,2011) and Associação da Indústria Papeleira (2002)
2.2. Regulation of Portuguese Forests
There is legislation to limit the plantation of eucalyptus (Decreto lei nº175/88, 17th May 1988) due to the perception that plantations of eucalyptus have negative effects in the existing biodiversity (Millenium Ecosystem Assessment, 2009).
Recently, Planos Regionais de Ordenamento Florestal (PROF) areas were established with authority to create plans of action for each Portuguese region. However, existing plans of action are very similar in what concerns management of pine and eucalyptus forests and do not specify how to achieve the desired percentages for each species. Due to the monoculture plantations that induce a high risk of fire and disease, the desired action is to promote forest diversity, decreasing the percentage of land occupied by pine and eucalyptus and introducing other broadleaved species with a slower growth. Forecasted values of density of pine and eucalyptus forests present a decreasing trend in the majority of the PROF action plans. Moreover, after recognizing the value of pine trees, PROF plans also aims at certification of the maritime pine trees’ quality.
3. Theory
3.1. Determining the value of Ecosystem services
TEV will be the methodology used to find the value of forest ecosystems, obtained by adding the estimations of the value of each ecosystem service provided by forests.
Ecosystems, in this case forests, provide a variety of services, which are denoted by Ecosystem Services (ES) (Santos, 2010). These are the tangible and intangible services provided by ecosystems from which users benefit, such as, services of commodities,
regulation, support and cultural services as defined in the Millenium Ecosystem Assessment (2009), depending on the state and management of the ecosystem (Santos, 2010).
The MEA, or Millennium Ecosystem Assessment for Portugal (2009), is a major reference, highlighting the importance of ES and listing some of the services provided by ecosystems. Based on the MEA, the most important services forests provide were identified, as shown in Annex 1. Market services include the provision of timber and other Non Timber Forest Products (NTFPs) and non-market services include recreation, landscape, carbon sequestration, watershed protection, protection from soil erosion and biodiversity.
Pearce et al. (1989) and Bishop (1999) make the distinction between direct use values, indirect use values and non-use values. The former are commercial and subsistence benefits that forests provide, including timber exploitation, mushrooms, medicinal herbs, recreation or landscape uses, among others. Indirect uses “comprise the many ecological functions of trees” (Bishop, 1999), such as watershed protection, reduction of air pollution or protection of soil erosion. The latter (non-use values) are benefits associated with the existence of forests, for example, biodiversity.
The value of market goods or services can be easily calculated. Since there is a market price for the service, the value can be obtained using the observed price and quantity or other statistics such as the GVA (gross value added).
However, obtaining the value of market services is not so easy. Some forest non-market goods are public (or quasi-public goods) (Bishop, 1999): these are goods that are non-excludable and increased consumption by one individual does not reduce the
availability to others, unless in the case of congestion. Public goods imply distortions and underprovision of ecosystems. Because no one can be excluded from consuming the good, some people will have incentives to free ride.
There are no markets for some ES, implying that the true economic value of forests will be underestimated from a social perspective if only the market value is considered. Different methods were developed to estimate the value of non-market services:
• The travel cost method, which assumes that the recreational or landscape benefit
people get from a forest can be approximated to the cost of travelling to that forest (Bishop, 1999).
• The substitute goods approach, that takes the market price of similar or substitute
goods of forest benefits as a value approximation (Bishop, 1999).
• Hedonic pricing, that isolates the influence of forests (environmental quality) on the
property value or on the wage differential (Bishop, 1999)
• The contingent valuation method (CVM); a stated preference method that surveys ES
users to obtain their willingness to pay for a benefit (Bishop, 1999).
• Cost-based approaches, such as replacement costs (the cost of replacing a benefit
with some other good or service), averting expenditure (the cost of preventing the loss of a certain benefit) and opportunity cost of labour (the labour cost of supplying the service should be equal or lower than the actual benefit).
Benefit transfer (BT) is an alternative to estimating ES’ value when there are no studies available. As stated in Kerr (2010), there are three important BT methods: point transfer, value function transfer and transfer by meta-analysis. Point transfer simply applies the estimates of one or more studies to the ecosystem of interest, with
calculation of mean and median. Value function transfer attempts, by using regressions, to create a more adjusted estimate using other studies’ estimates as dependent variable and social/management aspects as independent variables. Meta-analysis uses large scale databases of past studies to understand which factors explain changes in estimates.
PES (Payments for Ecosystem Services) are payments to compensate the individuals that manage the ecosystem that provides ES (Jack, 2008). These can be subsidies, tradable permits, command-and-control measures or any other mechanism in place to maintain a certain state of the ecosystem. The rationale is that if ES users are willing to pay for a service, then PES may exist (Wunder, 2005).
PES can alter private incentives to induce desired outcomes (Jack, 2008), If the social optimum choice is different from the market outcome, then by changing incentives the social optimum can be reached.
4. Literature Review
Measuring indirect benefits provided by ecosystems is a relatively recent topic. Peters et al. (1989) compares two alternative land uses: the sustainable extraction of NTFPs and the extraction of all the existing timber or other commercial oriented uses. While the author did not incorporate non-market benefits, he still found extraction of NTFPs in a sustainable way to be the most valuable option.
The aggregate value of Mediterranean forests based on available data was also determined (Croitoru, 2007). Separating the Mediterranean countries by northern, eastern and southern, the author found northern Mediterranean forests to be on average 3 times more valuable (173€ 2001/hectare) than eastern or southern Mediterranean forests.
Mendes (2005) determined the economic value of Portuguese forests taken as a whole obtaining 1.193.232.000€. The author also concluded that 83,5% of the value of Portuguese forests is provided by non-market services. However, the value for each species not discriminated and it assumes simplistic assumptions for some services, for example when determining the value of watershed protection1.
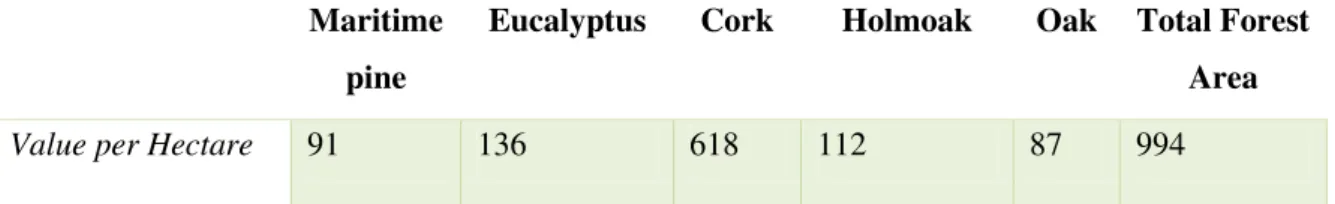
The National Strategy for Forests (ICNF, 2006) has already obtained an estimate of the value of forests for each tree species, including negative externalities such as fire that decrease by one third the value of forests. The total value of eucalyptus and pine tree forests (including non-market services) and other tree species is depicted inTable 2.The authors conclude eucalyptus is more valuable than pine tree and, notably, the value per hectare of other tree species like the cork tree is very high due to cork production. However, this study does not take into account some important services, like watershed protection, and its methodology is based in Mendes’s, ignoring its limitations.
Maritime
pine
Eucalyptus Cork Holmoak Oak Total Forest
Area
Value per Hectare 91 136 618 112 87 994
Table 2 – Value of Forests per hectare and year as described in the National Strategy for Forests (Source: ICNF, 2006)
Gatto et al. (2009) assess the possibility of managing processionary moth in Pine forests of Portugal using a cost-benefit analysis. First, the authors estimated the total value of Portuguese pine forests, taking into account market and non-market services. Internalizing the non-market services’ values changes private owners’ decisions towards protection of forestry stock and pest management, especially in the long-run. Private
1
Mendes (2005) does not make the distinction between benefit and service, mixing the concepts when estimating the value of services (Fisher, 2009).
owners prefer to spend more towards protection from pests. However, this study has some methodological limitations, as it uses Mendes’s methodology.
5. Estimating the TEV
To obtain the TEV, compatible services are added, including both market and non-market. To avoid overestimation of non-market services, the rationale will always be to pick the lowest bound value of estimates (Bishop, 1999). The summary of description, methodology and data sources used for each service is in Annex 1.
5.1. Evaluation of Market Goods
5.1.1. Timber Extraction
Timber extraction is one of the most important market services provided by the forests.
Eucalyptus tree, a hardwood type of tree, has most of its timber used for grinding in the paper industry (MEA, 2009). This explains the increasing trend of eucalyptus exploitation in Portuguese. In contrast, the pine tree, resinous or softwood and a slow growth tree, is expected to have a lower value when it comes to timber exploitation and its uses are mostly for sawing. Certification of maritime pine timber, as expected with the PROF plans, could increase the its value.
Several statistics could be used to calculate the value of this service, such as the GVA. However, due to lack of data, the statistics in INE (2010) are used, reporting the production for each forestry industry, including grinding industry from hardwood trees and sawing industry from softwood trees production value. These will be used as proxies to calculate timber service for eucalyptus and pine tree, respectively (Graph 4). ICNF (2006) confirms that hardwood to grind and softwood to saw are good estimates of the timber value of eucalyptus and pine, respectively.
In absolute values, hardwood to grind has shown an increasing trend while softwood to saw has remained relatively stable, as shown in Graph 4.
Graph 4 – Evolution of softwood to saw and hardwood to grind from 1986 to 2010 in 106€ (Source: INE, Contas
Económicas da Silvicultura)
5.1.2. NTFP Extraction
NTFP, or non timber forest products, are forest by-products, usually not as lucrative as timber. However, since these products also have a market, their value can be easily obtained. Eucalyptus’ NTPFs are vegetal carbon and mushrooms. Pine’s NTPFs are mushrooms and resin, the only NTFP considered in this study (Mendes, 2005).
Resin’s price evolved from 0,40€/kg in 2004 to 0,75 in 2008 and 2009 and, finally, to 1,50€/kg in 2010. This significant increase in price is partly explained by the decrease in hectares occupied by pine trees (AFENA, 2011). The lower bound value of 0,40 €/kg as a reference for the year of 2005 was considered. Data on tonnes of resin produced per year was collected from the IFN (2005).
0 50 100 150 200 250
1986 1988 1990 1992 1994 1996 1998 2000 2002 2004 2006 2008 2010P
Softwood to Saw Hardwood to Grind
5.2. Evaluation of Non-Market services
5.2.1. Recreation
Recreation service is commonly measured in the literature using the contingent valuation method (Rosenberg, 2012), the travel cost method or BT2.
The methodology used in Mendes (2005) was to take the number of campers as a proxy to the interest in forest recreation (INE). Using the willingness to pay obtained in Loureiro and Albiac (1996) for a forest reserve in Azores, which was the only estimate for the value of recreation found for Portuguese forests, Mendes (2005) estimates the value for recreation. Using these estimates and assuming 10% of recreation to be attributed to pine tree forests, Gatto (2009) obtained a recreation value for pine.
By considering that only public forest areas are open for public use, then using data from IFN (2005) of public forest areas by dominant forest species, I adjusted the value found in Mendes for the whole Portuguese forest just considering Pine and Eucalyptus forests (that cover 66% and 10% of public forest area, respectively).
Willingness to pay per person varies between 1US$ to 3US$ per visit (Pearce, 2001). Although Loureiro and Albiac (1996)’s estimates of 2,75€ per visit are outdated, since it is the only study available for Portuguese forests, it will also be used in this paper adjusted with the CPI (consumer price index).
5.2.2. Carbon Sequestration
Carbon sequestration is a privately produced public good, since the atmosphere is available to all and no one can be excluded from benefiting from it (Heal, 2000). There
2 Some studies also include hunting as part of recreation benefits (Kerr, 2010).
are several methods to measure sequestration of carbon. In this work, yearly average values of sequestration per hectare will be used for pine and eucalyptus.
As the EU ETS (Emission Trading System) market has created a market for carbon, the value of sequestration of carbon is attained by multiplying the EU ETS permit price by the average amount of CO2 sequestered for each tree.
The lower bounds of the values (22,75 tonnes of CO2 per year and hectare for eucalyptus forests and 6,77 for pine forests) were considered (Pedro, 2010). As expected, due to the young age of eucalyptus plantations that grow at a faster rate, eucalyptus plantations sequester higher amounts of CO2. According to Heal (2000), sequestration per hectare and year is about 0 to 15 tonnes of CO2. The estimates considered are consistent with this range.
Bloomberg has data on the EU ETS emissions price. Since 2007, this price has been decreasing due to the crisis, recently reaching its lowest value of 6,05€ per ton of carbon. This minimum value recorded will be the ETS price used in calculations.
5.2.3. Watershed Protection
Watershed protection ensures, among other benefits, quality of drinking water, moderation of water and nutrient flows, and conservation of the soil (Postel, 2005, and Pearce, 2001). Investment in green infrastructures and keeping forests intact, as opposed to building water treatment plants, reduces property damage and future costs to supply clean water and to treat waste water, becoming more cost effective over time (EPA, 2012).
The New York City (NYC) watershed management is a notorious example of a watershed protection project. To comply with US regulation regarding water quality
NYC opted to invest in a forest covered watershed. It has required a high amount of initial investment but, in the course of 5 years, it proved to be a cost-effective method compared with the cost of building a water treatment plant.
Replacement costs have been used to capture the value of watershed protection (Bishop, 1999), as well as contingent valuation techniques. Postel (2005) estimated the value of watershed protection by obtaining the costs avoided in terms of water treatment. Mendes (2005) also adopts this methodology for Portuguese forests. However, Dias (2012) finds that extracting eucalyptus timber imply using fertilizers that pollutes water.
To measure this service, point transfer was used, taking a result from Brander (2006). The authors surveyed existing literature on valuation of wetlands, including valuation of woodland and services of interest, such as flood control and water quality. The median value obtained in these studies was considered and, after being converted to 2005 Euros, the value was of 30,26€. The distinction between pine and eucalyptus was made using water consumption. Eucalyptus is a very water efficient tree but it grows faster than other species. As a result, it consumes on average twice as much water as the maritime pine does.3
5.2.4. Protection from soil erosion
Soil erosion is mainly caused by splashing of raindrops, whose impact on the soil make the soil particles detach. Therefore sediment yield in the plantation is influenced by free fall of rain and by the rain intercepted by the canopy (Zhou , 2002).
Chopra (1993) and Niskanen (1998) estimate the value of soil protection by estimating the soil nutrients lost. According to those authors, increased soil erosion is associated
3 http://www.geasphere.co.za/downloadable_docs/ThirstyTreesNoWaterClimateConfusion.pdf
with logging and the cost of soil protection could be obtained by the value of manufactured fertilizer needed to replace the eroded nutrients.
Zhou (2002) estimated soil erosion for eucalyptus plantations in Southern China. Soil erosion was divided between rainfall intercepted and not intercepted by the canopy, the former being influenced by the tree species. The authors conclude that the presence of canopy decreases soil erosion for rainfall intensity greater than 24,3 mm per hectare, implying a positive benefit from having forests when comparing to unused land, only when there is greater intensity of rain. For rainfall levels lower than 24,3 mm per hectare, bare land appeared to suffer from lower soil erosion.
However, the parameter in the estimation of soil erosion that depends on tree species follows a normal distribution with mean 3,9 and standard deviation 1,09 for the eucalyptus and with mean 3,5 and standard deviation of 0,97 for pine. Therefore, since the distributions are very similar, it is plausible to assume that the results obtained for eucalyptus can be applied to the pine tree forests. Therefore, the value for soil protection will not be calculated.
5.2.5. Biodiversity & Landscape
The Landscape value of forests is typically estimated using the hedonic pricing method or using stated preference methods, such as CVM. Most studies are conducted for protected areas, which explain the high landscape value obtained from forests.
On the other hand, the importance of biodiversity is related to productivity, insurance, knowledge and provision of ES and without it ecosystems would not be able to renew themselves (Pearce, 2001). Biodiversity is influenced by land use changes, exploitation of resources, pollution, fire, introduction of exotic species, shelter, wildlife and
deforestation, and climate change (MEA, 2009), among other factors. The value of biodiversity increases if the area studied is habitat of an endangered species and it changes with fire exposure. In Nunes et al. (2001), the authors survey the willingness to pay for protection of endangered species.
Proença (2010) found that species richness, diversity and evenness of plants and bird species in oak, pine and eucalyptus forests differ. Oak forests seem to have more biodiversity in all indicators, whereas eucalyptus forests have the lowest biodiversity out of the three tree species. The total number species found in forest stands in NW Portugal are depicted in Table 3. The results obtained show different economic values for the ES of biodiversity, suggesting pine tree forests to be more valuable than eucalyptus trees. The results are consistent with MEA (2009), according to which, as compared with trees like oak, both pine and eucalyptus have a negative impact on biodiversity. Using data for July and August in 2005, an indicator of the biodiversity was calculated, in the last line of Table 3 (Ratio of species found in the forest and all species found in all 3 forests).
Oak Pine Eucalyptus Total
Area occupied (%) 4,72% 27,87% 23,29% 55,88%
Total bird and plant species found 68 51 39 158
Ratio 43,03% 32,28% 24,68% 100%
Table 3 – Bird and plant Species found per 100m2 in Proença (2010) for oak, pine and eucalyptus forests and own calculations
Following the methodology in Mendes (2005), the amount of government expenditures on biodiversity and landscape conservation was considered as the economic value of these two services. Adjusting this value to account just for forest conservation (39% of land use) and considering only 55,88% of forest area (occupied by Oak, Pine and
Eucalyptus), the estimate of the value of biodiversity and landscape per hectare can be obtained, as described below in the Results section.
6. Results
In this section, the value per hectare of all the ecosystem services provided by pine and eucalyptus forests are presented (Graph 5).
Graph 5 – Value of pine and eucalyptus forests discriminated by type of service (2005€ per hectare)
The results confirm that the market value of eucalyptus is greater than the market value of pine (eucalyptus is 1,5 times more valuable than pine), as expected. However, eucalyptus forests are also more valuable than pine forests from a social perspective by the same proportion, mostly due to carbon sequestration (37% of total value).
Although the value of protection from soil erosion was not calculated, 48% of total economic value is attributed to the aforementioned non-market goods and services4. To avoid overestimation of services, the lower bound of the estimates obtained was considered. Based on these estimations, we may conclude that the value of non-market services provided by forests is non negligible. There is scope for intervention if the
non-4
The value of the serviceof protection from soil erosion was assumed to be the same for pine and eucalyptus forests (see section 5.2.4).
0 50 100 150 200 250 300 350 400
Pine Eucalyptus
Value of Biodiversity & Landscape
Value of Watershed Protection
Value of carbon Sequestration
Value of Recreation
Resin Value (€ per hectare)
Timber Value (€ per hectare)
market services’ value is not internalized, as expected in Portuguese forests (86% of forested land being owned privately).
Eucalyptus timber exploitation is more profitable than pine’s. A marginal change in the current harvest age of pine will decrease timber revenue of eucalyptus by more than in pine’s. Therefore, it makes sense that non-market services will more easily compensate the decrease in pine timber revenue than in eucalyptus’. Assuming non-market benefits are not internalized, whereas eucalyptus’ management (e.g. harvest age) is probably close to its socially optimal, pine’s current management is far from its socially optimal level. If social benefits were internalized, the results obtained would be different as management decisions would be adjusted accordingly.
However, there are risk factors not accounted for that influence the value of services and may drastically change the value of a forest. According to the MEA (2009), these are the risk of fire, climate change, rural abandonment and insect pests.
Fires decrease the value of all benefits, notably carbon sequestration (Englin, 2000), and are the most important risk in forest management (Croitoru, 2007), especially in Mediterranean forests and with today’s climate change reality. Both species considered in this work have high fire risks but Eucalyptus has an added risk due to the natural oils it produces. Pest control is also a major problem for forest ecosystems (Gatto, 2009). Pest attack decreases timber value, imply loss of ecological functions, increasing private and public costs (Gatto, 2009).
For simplicity of calculus, it will be assumed that, in the presence of fire, all services provided by forests lose their value, except for carbon sequestration that accounts for a negative flow due to the emission of CO2 stored in the trees.
Graph 6 – Value of Portuguese pine and eucalyptus forests accounting for fire risk (2005€ per hectare)
As shown in Graph 6, the estimates including fire risk for the TEV of the two species have both decreased. In general, the results remain unchanged. However, due to the high importance of the carbon sequestration service in eucalyptus forests, the total non-market value of eucalyptus forests decreases to 43%, slightly lower than pine’s 46%. The gap between the two species decreases, but eucalyptus forests remain more valuable.
6. Conclusions
The purpose of this study is to estimate the value per hectare of Portuguese pine and eucalyptus forests.
Based on TEV estimation, we find evidence that eucalyptus forests are consistently more valuable than pine forests. Not only is timber more valuable (as expected), but due to the young age of eucalyptus plantations and thus high sequestration of carbon, non-market services associated with eucalyptus are also more valuable.
Without fire risks, we conclude that almost half of the total value of the two forest ecosystems is due to the non-marketed services: carbon sequestration, recreation, landscape, biodiversity, protection of soil erosion and watershed protection. With the
0 50 100 150 200 250 300
Pine with Fire Risk Eucalyptus with Fire Risk
Value of Biodiversity & Landscape
Value of Watershed Protection
Value of carbon Sequestration
Value of Recreation
Resin Value (€ per hectare)
Timber Value (€ per hectare)
added fire costs, the importance of non-market services decreases, notably in eucalyptus forests.
The new Forestry stock inventory (IFN 6) is scheduled to be published soon. Had this thesis being written later, it would incorporate more recent and accurate information on forests. Another criticism is the missing analysis of the remaining tree forests (ICNF, 2006), that would bring value-added to this dissertation, for example oaks and cork tree (MEA, 2009). There is also a lack to studies of recreation and landscape for Portuguese ecosystems that greatly limits the valuation of some services. This will be left for future research
References
AFENA (2011). “Revista da Associação Nacional de Empresas Florestais, Agrícolas e do Ambiente” (http://www.anefa.pt/pdf/revista_14.pdf)
BES Arte&Finança (2011). “A Fileira Florestal: Um cruzamento estratégico”, Espírito Santo Research, Research Editorial
Bishop, J. (1999). “Valuing Forests: A Review of Methods and Applications in Developing Countries”, Environmental Economics Programme
Brander, L., Florax, R., Vermaat, J. (2006). “The Empirics of Wetland Valuation: A Comprehensive Summary and a Meta-Analysis of the Literature”, 223-250
Brauman, K. et al. (2007). “The Nature and Value of Ecosystem Services: An Overview Highlighting Hydrologic Services”, The Annual Review of Environment and Resources 32, 67-98
Christie, S., Scholes, R. (1995). “Carbon Storage in Eucalyptus and Pine Plantations in South Africa”, Environmental Monitoring and Assessment 38
Croitoru, L. (2007). “How much are Mediterranean forests worth?”, Forest Policy and Economics 9, 536-545
Dias, A., Arroja, L. (2012). “Environmental impacts of eucalypt and maritime pine wood production in Portugal”, Journal of Cleaner Production 37, 368-376
Englin, J., Boxall, P., Hauer, G. (2000). “An Empirical Examination of Optimal Rotations in a Multiple-Use Forest in the Presence of fire risk”, Journal of Agricultural and Resource Economics 25
EPA (2012). “The Economic Benefits of Protecting Healthy Watersheds”, US Environmental Protection Agency
FAO (Food and Agriculture Organization of the United Nations) (2011). “State of the World’s Forests”, Rome
Fisher, B., Turner, R., Morling, P. (2009). “Defining and classifying ecosystem services for decision making”, Ecological Economics 68, 643-653
FOPER - The Forest Policy and Economics Education and Research (2009). “3. The Faustmann Model (Part I)” (http://foper.unu.edu/course/?page_id=167~)
Gatto, P., et al. (2009). “Economic Assessment of managing processionary moth in pine forests: A case-study in Portugal”, Journal of Environmental Management 90, 683-691 Heal, G. (2000). “Nature and the Marketplace: Capturing The Value Of Ecosystem Services”, Island Press
ICNF (2005). “Inventário Florestal Nacional 5” ICNF (2006). “Estratégia Nacional para as Florestas”
INE (2009). “Agricultura, Silvicultura e Pesca”, Indicadores INE (2010). “Contas Económicas da Silvicultura”
Jack, B., Kousky, C., Sims, K. (2008). “Designing payments for ecosystem services: Lessons from previous experience with incentive-based mechanisms”, PNAS 105
Kerr, G., Woods, A. (2010). “New Zealand big game hunting values: a benefit transfer study”, Land Environment and People Research Report 23
Koskela, E., Ollikainen, M. (2001). “Forest Taxation and Rotation Age under Private Amenity Valuation: New Results”, Journal of Environmental Economics and Management 42, 374-384
MAMAOT (2011). “Anuário Agrícola”
Mendes, A. Portugal. In Maurizio Merlo & Lelia Croitoru (eds.) (2005). “Valuing Mediterranean Forests: Towards Total Economic Value”, Wallingford, Oxon (UK): CAB International
Nunes, P. et al. (2001). “Economic Valuation of Biodiversity: Sense or Nonsense”, Ecological Economics 39, 203-222
Pearce, D. (2001). “The Economic Value of Forest Ecosystems”, Ecosystem Health Vol. 7 No. 4
Pedro, M. (2010). “Balanço de Carbono no Sector do Pinheiro Bravo da Mata Nacional de Leiria”, Dissertação da Universidade de Aveiro
Pereira, H. M., Domingos, T., Vicente, L., Proença, V. (2009). “Ecossistemas e Bem-estar Humano: Resultados da Avaliação para Portugal do Millenium Ecosystem Assessment”, Escolar Editora
Postel, S., Thompson, B. (2005). “Watershed protection: Capturing the benefits of nature's water supply services”, Natural Resources Forum 29, Blackwell Publishing Proença, V., et al. (2010). “Plant and bird diversity in natural forests and in native and exotic plantations in NW Portugal”, Acta Oecologica 36, 219-226
Rosenberg, R., Needham, M., Morzillo, A., Moehrke, C. (2012). “Attitudes, willingness to pay, and stated values for recreation use fees at an urban proximate forest”, Journal of Forest Economics 18, Issue 4
Santos, J. L. (2010). “Serviços dos Ecossistemas: valoração e valorização”, Espaço BES Arte&Finança
Tietenberg, T. (1984). “Environmental and Natural Resource Economics”, Scott, Foresman & Company
Wunder, S. (2005). “Payments for environmental services: Some nuts and bolts”, CIFOR Occasional Paper n.42
Zhou, G., Wei, X., Yan, J. (2002). “Impacts of eucalyptus (Eucaluptus exserta) plantation on sediment yield in Guangdong Province, Southern China – a kinetic energy approach”, Catena 49, 231-251
Annex 1 - Summary Table: Description, methodology used and data sources
Services Description Methodology Data sources
Timber exploitation
Extraction of wood that will be used as an intermediate good in other industries, for example the pulp industry. This is the main economic motivation for forest exploitation.
Production (in €) of hardwood to grind and softwood to saw per hectare
INE’s “Contas Económicas da Silvicultura”, IFN 5
and other inventories of the
portuguese forestry sector
Extraction of NTFP
Other commodities, not including timber, derived from the exploitation of forests. In this context, these can be pine nuts, pine fruit, resin, mushrooms, other biomass, etc.
Resin productivity per year times market price
IFN 5 2005/2006, Revista AFENA
Recreation Any activity of leisure that forest ecosystem provide their users (e.g. hunting, fishing).
Benefit transfer Loureiro and Albiac (1986) and tourism statistics
Landscape Aesthetic value associated with the presence of forests.
See biodiversity’s methodology. See biodiversity’s data sources. Carbon Sequestration
Storing carbon in forests as a mean of offsetting the effect of future emissions on GHG concentrations in the atmosphere.
Total value as the multiplication of price of carbon emissions per amount of CO2 sequestered.
IFN 5 (2005/2006)
Watershed protection
Protection of the land that drains water into a common water source. It provides other services such as water supply for other activities, flood control, flow regulation, water purification, among others (Postel, 2005).
Econometric regression to determine water treatment costs avoided and the ratio on water used per tree to distinguish.
Reports on the North of Portugal’s Watersheds
Protection
from soil erosion
Reduction of the splashing of waterdrops from rainfall events on the forested land from the presence of canopy (Shou, 2002).
Raindrop splashing intensity on soil as a
function of the tree canopy (Zhou, 2002).
NA (Not applicable)
Biodiversity Variability between living beings and basis of the ecosystems that makes sure other services are provided (Santos, 2010, and MEA, 2009).
Creation of a biodiversity index and multiplying it by
the government expenditures towards biodiversity and landscape conservation.
Proença (2010) and INE (2007)