energies
ISSN 1996-1073 www.mdpi.com/journal/energies ArticleSimulation of Distributed Generation with Photovoltaic
Microgrids—Case Study in Brazil
Gustavo Azevedo Xavier 1,†, Delly Oliveira Filho 1,†,*, José Helvecio Martins 1,†,
Paulo Marcos de Barros Monteiro 2,† and Antônia Sônia Alves Cardozo Diniz 3,†
1 Department of Agricultural Engineering, Universidade Federal de Vicosa, Av. P.H. Rolfs s/n,
36570-000 Vicosa, MG, Brazil; E-Mails: [email protected] (G.A.X.); [email protected] (J.H.M.)
2 Department of Control and Automation, Universidade Federal de Ouro Preto, Escola de Minas,
Campus Morro do Cruzeiro, 35400-000 Ouro Preto, MG, Brazil; E-Mail: [email protected] 3 Department of Mechanical Engineering, Pontificia Universidade Catolica de Minas Gerais,
Av. Dom Jose Gaspar, 500, Coração Eucarístico, 30535-901 Belo Horizonte, MG, Brazil; E-Mail: [email protected]
† These authors contributed equally to this work.
* Author to whom correspondence should be addressed; E-Mail: [email protected]; Tel.: +55-31-3899-1897.
Academic Editor: Josep M. Guerrero
Received: 2 March 2015 / Accepted: 24 April 2015 / Published: 7 May 2015
shows that microgrid contributes to improve the economics and the initial investments. The number of participants in a microgrid, the electricity and the equipment costs are important parameters to speed up the economic and technical feasibility process.
Keywords: photovoltaic feasibility; flexible generation; distributed energy resources
1. Introduction
Worldwide, there is a predominance of power generation in centralized systems, usually from large fossil fuel or nuclear power plants. The development of small-unit power generating systems and changes that have occurred in power system operation and regulation have created opportunities for consumers to generate their own power [1].
In Brazil, most electricity generation is hydroelectric. Because of the size of the country, a long transmission system is required to carry this energy to consumer centers. Power rationing that occurred in 2001 showed the fragility of the generation system in Brazil, strengthening the discussions on alternative energy sources [2]. These factors show the importance of diversifying energy sources through Distributed Generation (DG). A significant change is foreseen for the current structure of highly centralized, large capacity power plants. A new structure, with the highly decentralized insertion of small- and medium-capacity power units, is expected [3].
Regarding the use of renewable energy, Brazil is one of the most advanced countries in South America [4]. Data from the National Energy Balance 2011 show that the primary energy on the Brazilian matrix is composed by 45.5% renewable energy (hydraulic, firewood, charcoal, sugarcane and other renewable sources, such as agricultural residues) [5]. Figure 1 shows the distribution of the sources of primary power generation in Brazil. It should be highlighted that the percentage of useful energy consumed in Brazil obtained from renewable sources should be even greater because much of Brazilian renewable energy is hydroelectric. Moreover, power conversion efficiency, from electrical energy to final end use, is usually higher compared to other energy sources. Thus, the percentage of useful energy from renewable sources tends to be higher than the 45.5% mentioned.
Figure 1. Primary energy production in Brazil in 2010 [5].
that over 80% of the electricity used in Brazil is renewable [5]. These figures contrast strongly with the World’s electrical energy consumption because renewable sources account for approximately 20.9% of the electricity generation.
Figure 2. Domestic supply of electricity in Brazil in 2010 [5].
The use of microgrids powered by photovoltaic systems and other alternative energy sources can contribute significantly to world energy demand, gradually replacing the plants that generate electricity using coal, petroleum and nuclear power. The most important alternative sources include micro-turbines, photovoltaics, fuel cells and internal combustion engines using biofuels, such as ethanol, biodiesel and biogas. These emerging technologies have lower emissions and the potential for lower costs in the medium term. Some countries and organizations have invested in researching microgrids, and much remains to be done for the microgrids to be placed on the market [6,7].
Because of its location, Brazil has excellent solar radiation levels. This feature is an advantage over industrialized countries regarding the use of solar photovoltaic energy [8–10]. The Brazilian Government created the Incentive Program for Alternative Energy Sources (PROINFA) to diversify its energy sources based on the principle that distributed generation systems can provide a fast, modular, and decentralized solution to expand the capacity of power generation and increase reliability. Under the coordination of the Ministry of Mines and Energy, the program was set to acquire 3300 MW of electrical power in the Integrated National System to be produced by wind, biomass and small hydropower (SHP) by the year 2008 and supply approximately 10% of the consumption in 20 years.
The latest breakthrough for distributed generation in Brazil occurred on 17 April 2012 with the approval of Resolution 482 by the National Electric Energy Regulatory Agency (ANEEL), which allows consumers to install small generation units on their sites to become energy independent. Feed-in tariffs were not allowed by the Brazilian law. It should be emphasized that the operation of microgrids, connected to or disconnected from the power system, remains forbidden.
Although Brazil has high levels of solar radiation, the lack of incentives and the elevated costs of photovoltaic systems have been a barrier to the development of the PV market in Brazil. To promote the feasibility of PV systems, a microgrid model that increases the earnings from generated electricity was proposed. The present study aimed to simulate and analyze the operation of microgrids connected to the electric power system with photovoltaic generation and energy storage in batteries.
2. Methodology 2.1. Radiation Data
The methodology developed by Cabral et al. [11] was used to simulate the radiation data used in this study. Radiation data were evaluated by a stochastic method, using monthly average daily global radiation values derived from a typical meteorological year over a period of 20 years to generate hourly data to be used in the simulation. In this methodology, the following parameters were estimated: (I) the hourly global radiation on a inclined surface; (II) the hourly global radiation on a horizontal surface; (III) the daily global radiation on a horizontal surface; (IV) the hourly diffuse radiation on a horizontal surface calculated from hourly global radiation and extraterrestrial hourly radiation; (V) the hourly sky diffuse radiation based on an anisotropic model; and (VI) the hourly ground reflected diffuse radiation based on anisotropic reflection model. Markov transition matrices were used to estimate the daily clearness index based on historic data from meteorological stations. It was possible to describe the radiation data by a stochastical model improving the estimation of the electrical output power from the photovoltaic modules.
The one-diode-equivalent model was used for the simulation of photovoltaic generators [11]. The output power of a photovoltaic generator was calculated considering a system with a maximum power transfer tracker.
2.2. Battery Model
Battery set sizing depends only on battery rated capacity, voltage and the desired autonomy. For the photovoltaic system simulation, the batteries were considered to be initially fully charged, and the total stored energy (Wh) was obtained by multiplying the battery capacity (Ah) by its rated voltage (V). The efficiencies of battery charge and battery discharge were considered to be 70% and 90%, respectively, according to the data obtained by [11].
2.3. Loads Characterization
The electrical load considered was a set of residences. For each residence, the load was considered to be the sum of lights and electrical appliances. The average power values for the daily and weekly pattern of use of the electrical residential load commonly used in Brazil were considered to be the ones described by PROCEL [12].
The load curves were obtained from the adapted stochastic method proposed by Souza et al. [13]. For each load, the amount of usage time was simulated during the day, stochastically, by considering the following: (I) the random, daily average usage time variation; and (II) the random, time of day use variation.
estimate the number of times that the load is used throughout the day. The developed algorithm simulates the load probability curves using the value determined by [12] in 2011 as the average and a deviation around a range bounded by minimum and maximum limits.
2.4. Photovoltaic System Sizing
The methodology used for PV system sizing for each residential consumer was in accordance with the spreadsheets presented by Reference Center for Solar and Wind Energy (CRESESB) [14], originally produced by Sandia National Laboratories for the manual titled “Stand-Alone Photovoltaic Systems—A Handbook of Recommended Design Practices” [15] and adapted for Brazil. Spreadsheets were developed for fixed isolated systems without solar concentrators. Instructions for completion are found in this manual and in [11]. The spreadsheets provide a deterministic method to calculate the PV system, including the energy storage, based on load and radiation data and using analytical equations to predict operation of the photovoltaic systems. The storage systems size were obtained considering a consecutive number of days in which the demand can be met relying only on the storage system.
2.5. Topologies
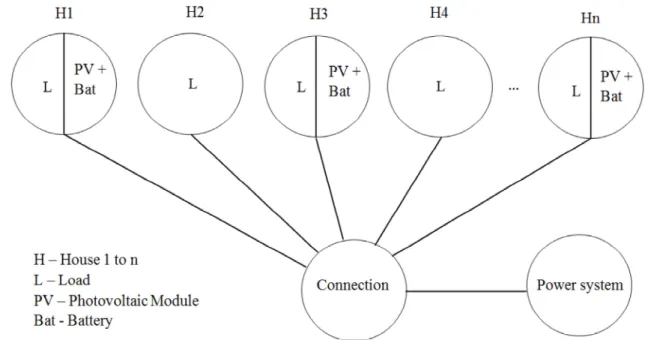
The microgrid model presented in this study proposes that residential consumers are interconnected, forming a group in which some homes have photovoltaic generation and energy storage in batteries, while others do not. Thus, the surplus of energy generated by those with photovoltaic systems could be used by those without as an alternative to a local electrical utility. The photovoltaic systems were sized to supply consumers isolated from the network. The proposed microgrid should be connected to the power system. A schematic model of the proposed microgrid is shown in Figure 3.
Figure 3. Schematic drawing of the proposed microgrid.
with photovoltaic systems which are connected among themselves to a variable number of microgrid participants without photovoltaic generation ranging from one to fifty. The number of microgrid participants was limited to sixty because the larger the microgrid, the bigger the loss of energy and the complexity of both the management and the distribution system inside the microgrid. The Net Present Value (NPV) and the Internal Return Rate (IRR) were obtained for each case to verify which arrangements make the proposed microgid economically feasible. Thereafter, the photovoltaic systems that were originally sized to supply individual consumers were studied in three different microgrid arrangements, in an effort to obtain the necessary conditions to the economic feasibility: (I) twenty residential customers connected to each other, ten of which have photovoltaic systems installed; (II) forty residential customers connected to each other, ten of which have photovoltaic systems installed; and (III) ten residential customers with photovoltaic generation connected to a commercial or industrial consumer capable of using all generated energy surplus. These arrangements were chosen between the previous fifty cases analyzed to: (I) provide a scenario with high penetration level of photovoltaic generation within a group; (II) provide a scenario with low penetration level of photovoltaic generation within a group; and (III) provide a scenario where all the energy generated by the photovoltaic modules would be consumed by the microgrid members.
The internal and external microgrid power flow was assessed using knowledge of the following: (I) the amount of energy generated by the photovoltaic generators at each moment; (II) energy and power demand; and (III) state of battery charge. The power flow analysis calculates both the individual energy consumption and the microgrid energy balance.
2.6. Energy Balance
The simulated microgrid had consumers with and without the following attributes: (I) photovoltaic generation; (II) energy storage capability; and (III) connection to the grid. The energy balance was calculated for the different topologies studied by the following evaluations:
(I) The solar radiation at the photovoltaic generators; (II) The electrical energy generated;
(III) The battery state of charge (SOC), defined as the percentage of the nominal storage capacity available, which depends on:
a. The initial state of the batteries;
b. The energy supplied by the photovoltaic generators; c. The energy sent by the batteries to the load;
(IV) For each individual consumer:
a. The load curve and the electrical demand; b. The energy consumed from the grid;
c. The energy consumed from the photovoltaic generation modules.
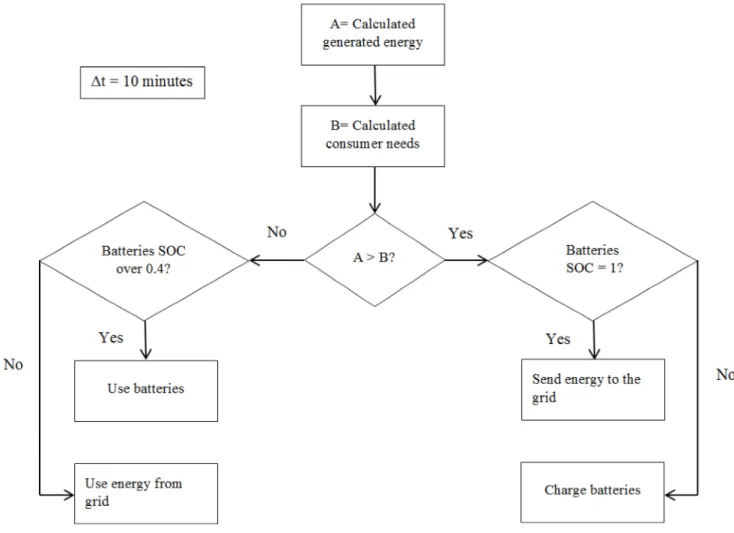
The radiation data for a typical year were available on a per hour basis. A polynomial interpolation of the hourly radiation data was carried out to obtain a 10-min basis. The load data were also generated on a 10-min basis. Thus, the energy balance could be performed over a shorter time interval.
After the energy balance was evaluated, economic aspects were also appraised to account for the individual consumer and microgrid perspectives.
Figure 4. Energy balance algorithm flowchart. 2.7. Microgrid Economic Aspects
The economic analysis considered a planning horizon of 25 years and verified the investment feasibility by accounting for revenues and expenditures with microgrid implementation for some customers using photovoltaic generators and energy storage. The internal return rate and the net present value were calculated as indicators of microgrid feasibility.
In case (II), the current value charged by the local utility, CEMIG, was used, which was, at the time of this work, $0.30/kWh. For case (III), a value of $0.22/kWh was considered, which was the average of the figures for cases (I) and (II) and may thus provide benefits to all microgrid participants.
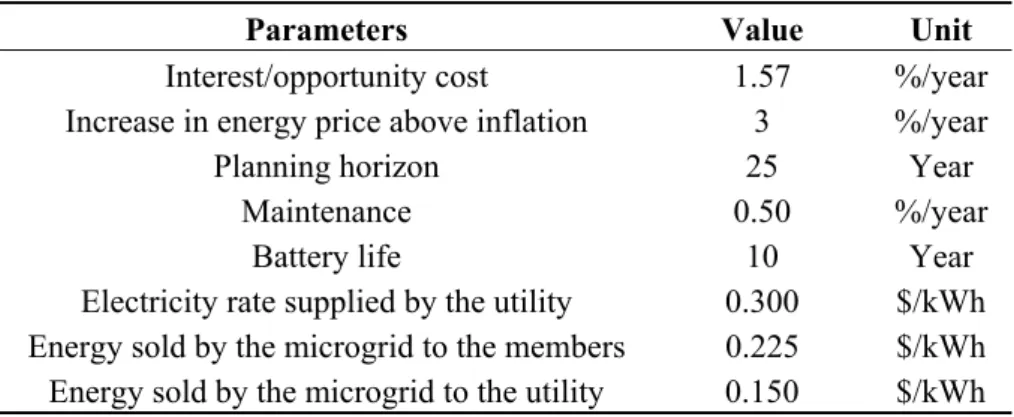
The parameters for economic analysis considered are shown in Table 1. The opportunity cost was considered to be the savings account earnings after discounting the inflation. The financial return obtained with the microgrid was compared to that obtained in the absence of interconnection to other consumers. Sensitivity analyses were performed, varying only one economic parameter per instance for each topology studied. The effects of variation in the cost of acquisition and installation of the system, increase in energy prices above inflation and opportunity cost were analyzed.
Table 1. Parameters for economic analysis.
Parameters Value Unit
Interest/opportunity cost 1.57 %/year Increase in energy price above inflation 3 %/year
Planning horizon 25 Year
Maintenance 0.50 %/year
Battery life 10 Year
Electricity rate supplied by the utility 0.300 $/kWh Energy sold by the microgrid to the members 0.225 $/kWh Energy sold by the microgrid to the utility 0.150 $/kWh
Other analyses related to the gain that could be obtained indirectly with the use of photovoltaic systems were also performed. The supply of energy at peak hours, non-guaranteed access to energy and new possibilities arising from the start of the energy certification of buildings in Brazil could significantly contribute to the growth of the photovoltaic market in the country. The impact of having no energy storage was also analyzed for the three topologies studied.
3. Results and Discussion
The results are organized by subsections. In the first subsection the PV system sizing results are presented to show the generated energy by one PV system. The second subsection show the results of load characterization. Sections 3.3–3.6 show the results of three different topologies of microgrids. Sections 3.7–3.10 show the economic analysis and sensibility analysis. Sections 3.11–3.14 show other possibilities, related to legislation that may contribute to the feasibility of the microgrid topologies proposed.
3.1. PV System Sizing
The loads for the photovoltaic system sizing for a typical Brazilian residence with three dwellings are presented in Table 2.
Table 2. Loads for sizing photovoltaic system for a typical residence.
Equipment Quantity Power (W) Monthly Use (day/month) Daily Use (h/day)
20" TV 1 90 30 5
Shower 1 3500 30 0.66
Stereo system 1 20 12 1
DVD 1 10 8 2
Lamp 7 20 30 7
Computer 1 180 20 3
Fan 2 50 30 8
Refrigerator 1 90 30 12
Hair dryer 1 1400 4 0.1
Electric iron 1 1000 4 1
Washing machine 1 500 4 1
Table 3. Description and characterization of batteries.
Description Characterization
Type Lead-acid Rated voltage 12 V
Rated capacity 220 Ah Maximum depth of discharge 0.6
Number of batteries 8 Storage capacity 880 Ah
Useful capacity 528 Ah
System sizing was performed considering an 80 W photovoltaic module, Table 4.
Table 4. Characteristics of the 80 W PV generator.
Description Characterization
Rated voltage 12 V Voltage at maximum power 17.29 V
Open circuit voltage 21.6 V Current at maximum power 4.37 A Short circuit current 4.72 A Rated power 75.56 W
The PV system dimensioning results for typical Brazilian residences are presented in Table 5.
Table 5. Generator sizing.
Description Characterization
Number of modules in parallel 11 Number of modules in series 2
Total of modules 22
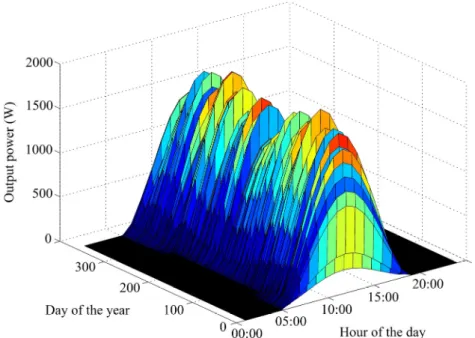
The instantaneous power generated was calculated at intervals of one hour, knowing the total number of modules required to supply power to the load. The result is shown in Figure 5.
Figure 5. Generated power simulated according to the solar radiation and ambient temperature for Viçosa, MG, Brazil.
3.2. Loads
Figure 6 shows the output of the load curves generator program for any given day. It is important to note that the software system generates a different load curve for each day, considering both the load characteristics and the stochastic aspects.
3.3. Initial Analyses
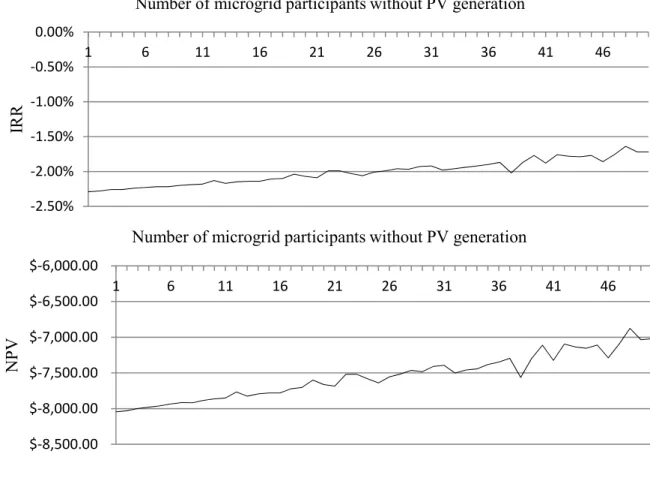
The initial analyses were performed to obtain the results of economic feasibility to the proposed microgrid for fifty different arrangements, as described in Section 2.5. The NPV and IRR results are shown in Figure 7.
Figure 7. NPV and IRR for fifty arrangements of the proposed microgrid.
The results show that increasing the number of microgrid participants without photovoltaic generation improves the economic feasibility of the system, although the feasibility has not been accomplished by varying this number from one to fifty. The graphics suggest a tendency of improve the economic aspect by raising the number of microgrid participants, but the size of the microgrid may imply in major energy losses between the microgrid members. The NPV was improved in approximately $1,000.00 by varying the number of microgrid members from 11 to 60. By a simple extrapolation of these results, we can conclude that, for the system proposed, a microgrid with approximately 400 members, that is eight times greater than the system studied in this paper, would reach feasibility. The authors are aware of the need of further analyses since simple extrapolation may result in conclusions that not necessarily reflect the behavior of a power system.
3.4. Topology 1
The total surplus energy used by the 10 homes without PV systems and energy storage for one year was 1,099.90 kWh, with a monthly average equal to 91.65 kWh. Each of the ten homes used,
‐2.50%
‐2.00%
‐1.50%
‐1.00%
‐0.50% 0.00%
1 6 11 16 21 26 31 36 41 46
IR
R
Number of microgrid participants without PV generation
$‐8,500.00
$‐8,000.00
$‐7,500.00
$‐7,000.00
$‐6,500.00
$‐6,000.00
1 6 11 16 21 26 31 36 41 46
NPV
on average, 9.17 kWh of the energy surplus available in a month from the microgrid. The total energy provided by the PV systems to the microgrid in the simulated year was 14,374.3 kWh.
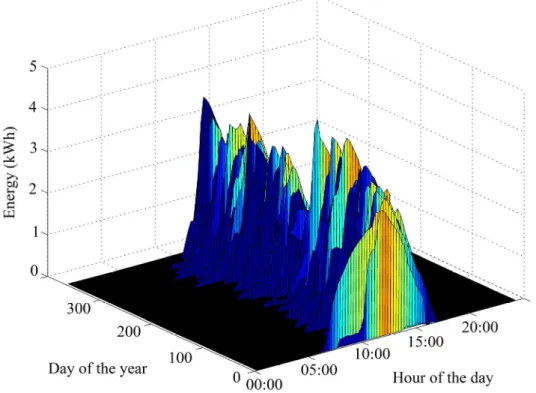
After calculating the amount of network surplus energy used by the 10 homes without PV generation, the amount of excess energy leftover from the original amount was assessed. The result is shown in Figure 8.
The total remaining for the year was 5776.00 kWh. According to the simulation results, only 16.00% of the total energy available was used in the microgrid. This result was observed because of the load characteristic studied and the time period when there is more energy available.
Figure 8. Photovoltaic energy not consumed on the microgrid for topology 1. 3.5. Topology 2
Thirty homes were tested for a year, and the total surplus energy used in these homes was 2708.50 kWh, with a monthly average equal to 225.71 kWh. Each of the thirty residences used, on average, 7.52 kWh of the total power available over a month. The total energy provided by the PV systems to the microgrid in the simulated year was 15,982.4 kWh.
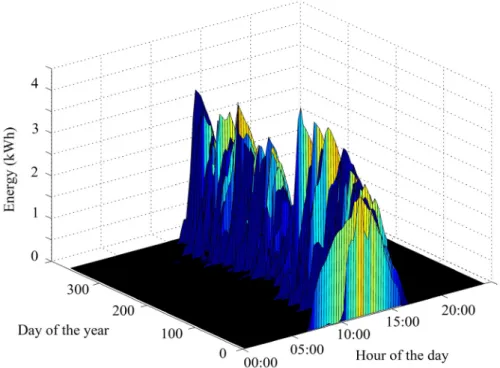
After calculating the amount of surplus energy in the grid for the 30 homes without PV generation, the amount of energy remaining was calculated. The result is shown in Figure 9.
Figure 9. Photovoltaic energy not consumed on the microgrid for topology 2. 3.6. Topology 3
The case of a group of houses with photovoltaic generators connected to the grid, in which there was a consumer whose load curve allowed the use of all surplus energy in the microgrid, was studied to maximize the economic gain from the energy sold. The same group of ten owners of photovoltaic systems evaluated for topologies 1 and 2 was considered. The total surplus energy was 6875.9 kWh per year, which corresponds to a monthly average generation of 572.98 kWh. The total energy provided by the PV systems to the microgrid in the simulated year was 20,150.3 kWh.
3.7. Economic Analyses
Table 6. PV system with energy storage installation cost for one residence.
Equipment Price ($) Quantity Total
($) (%)
Photovoltaic Module 80 W 600.00 22 13,200.00 73.57 Battery 12 V 220 Ah 410.00 8 3,280.00 18.28 Frequency Inverter 2 kW 652.00 1 652.00 3.63
Charge controller 559.00 1 559.00 3.12 Cables, connectors, meters, etc. 250.00 1 250.00 1.40
Total 17,941.00 100.00
Table 7 lists the values received during one year by members of the group in the microgrid that have photovoltaic generation systems with energy storage as a result of several activities: energy trading in the microgrid, energy selling to the electric utility and energy bill savings. There is some criticism of the energy assumed values. As previously shown in Table 1, the energy costs were considered to be 100%, 75% and 50% of the energy tariff for residential consumers, the value to be paid by the microgrid member to the owner and the value to be paid by the utility to the owner of PV system, respectively.
Table 7. Energy and economic aspects of microgrid Topologies 1, 2 and 3.
Description Unit Microgrid
Topology 1 Topology 2 Topology 3 Electricity sold within the microgrid (kWh/year) 1,099.90 2,708.50 6,875.90
Amount received from members of the microgrid ($/year) 247.48 640.91 1,547.07 Energy sold to the utility (kWh/year) 5,776.00 4,167.40 0.00
Amount received from the utility ($/year) 866.40 625.11 0.00 Reduction in energy consumption from the electrical utility (kWh/year) 13,274.40 13,274.40 13,274.40
Saved on energy bill ($/year) 3,982.30 3,982.30 3,982.30 PV participation in the microgrid (kWh/year) 14,374.30 15,982.40 20,150.30
The average values received during a year for each owner of a photovoltaic generator are shown in Table 8.
Table 8. Average annual values received by each owner of a generation system.
Description Topology 1 ($/year) Topology 2 ($/year) Topology 3 ($/year) Amount received from members of the microgrid 24.75 60.94 154.71
Amount received from the utility 86.64 62.51 0.00
Saved on energy bill 398.21 398.21 398.21
Total revenue 509.60 521.66 552.92
The net present value (NPV) and internal rate of return (IRR) were analyzed for each topology. The results are shown in Table 9.
In other words, a microgrid is an alternative to improve the economic feasibility of photovoltaic systems with and without energy storage.
Table 9. Net present value (NPV) and internal rate of return (IRR) for the topologies analyzed.
Variables Topology 1 Topology 2 Topology 3
NPV ($) −7779.28 −7436.47 −6508.99 IRR (%) −2.15 −1.95 −1.44
In the proposed system, energy storage accounts for approximately 18% of the total costs, and the cycle of charging and discharging a battery requires extra energy effort. Energy storage capability is a good option when there is a need for energy independence and in the case of time of use tariffs, where the peak rates are much greater then off peak rates. Thus, in the case of flat tariffs, when energy independence is not a concern, feasibility should be achieved more easily.
3.8. Cost Reduction of Generators and Equipment
Net present values (NPV) and internal rate of return (IRR) for the three topologies were carried out considering technology cost reductions of 20%, 40% and 60%. The results are shown in Table 10.
Table 10. Net present values (NPV) and internal rate of return (IRR) for the three topologies considering equipment cost reductions of 20%, 40% and 60%.
Economic Indicators Reduction Topology 1 Topology 2 Topology 3
NPV ($)
20% −4304.64 −3943.33 −3015.85
IRR (%) −1.07 −0.82 −0.21
NPV ($)
40% 1354.40 1712.22 2639.69
IRR (%) 2.46 2.68 3.25
NPV ($)
60% 5942.82 6300.63 7228.11
IRR (%) 6.63 6.89 7.55
The results presented in Table 10 show that the investment becomes feasible when there is an approximately 40% reduction in the initial costs of PV system installation, and greater financial return occurs in topology 3. A 40% reduction in current prices provides $6.00 per W, the same price for system feasibility found by [18] for Japan. This reduction in the prices of photovoltaic generators and other equipment necessary for system operation can be achieved if there is a substantial market expansion of photovoltaic panels, which is expected in the near future.
3.9. Increase in Energy Prices above Inflation
Table 11. Effect of variation in the annual increase in energy prices above inflation.
Economic Indicators Annual Energy Price Variation above Inflation Topology 1 Topology 2 Topology 3 NPV ($)
0% −12,633.71 −12,389.76 −11,757.42
IRR (%) – – –
NPV ($)
1% −11,274.30 −10,998.17 −10,282.44
IRR (%) – – –
NPV ($)
2% −9,684.73 −9,370.98 −8,557.75
IRR (%) – – –
NPV ($)
3% −7,822.43 −7,464.61 −6,537.14
IRR (%) −2.16 −1.96 −1.45
NPV ($)
4% −5,636.75 −5,227.21 −4,165.66
IRR (%) −0.88 −0.68 −0.18
NPV ($)
5% −3,067.48 −2,597.14 −1,377.99
IRR (%) 0.36 0.55 1.04
The results show that with current equipment prices needed to install the system, the viability of the investment cannot be achieved by considering up to a 5% increase in energy prices above inflation.
System without Energy Storage
In the fourth current analysis, PV systems without energy storage were considered. The net present values (NPV) and internal rate of return (IRR) for this case are shown in Table 12.
Table 12. Net present values (NPV) and internal rate of return (IRR) for the three topologies for a system without energy storage.
Economic Indicators Topology 1 Topology 2 Topology 3
NPV ($) −2491.64 −1068.83 2619.25
IRR (%) 0.23 1.02 2.83
3.10. Variation in the Cost of Surplus Energy Sales
The fifth analysis presented in this work considered the variation of the energy surplus selling value. Most feed-in tariff programs encourage the use of renewable sources buying energy excess for a price higher than that of conventional energy. The considered variation in the cost of surplus energy sales ranges between $0.22/kWh and $0.33/kWh. The results are shown in Table 13.
Table 13. Analysis of the variation in the selling price of surplus energy to the electrical energy utility of one microgrid participant ($/kWh).
Economic Indicator Selling Price ($/kWh) Topology 1 Topology 2 Topology 3
NPV ($)
0.22 −6543.37 −6537.73 −6508.99
IRR (%) −1.46 −1.46 −1.44
NPV ($)
0.27 −5687.89 −5919.61 −6508.99
IRR (%) −1.01 −1.13 −1.44
NPV ($)
0.33 −4832.42 −5301.49 −6508.99
IRR (%) −0.58 −0.82 −1.44
The results show that even if the utility pays 10% more than the current price of energy, the proposed microgrid is not economically viable. Simulations with higher prices would lead to a favorable condition, but these scenarios are unlikely to occur. In Reference [18], it is found that $0.23/kWh is adequate to reach economic feasibility in Japan.
3.11. Labeling of Buildings
Some countries have already developed a process to evaluate buildings on energy usage efficiency. The buildings evaluated receive a rating label that influences the value of the property. The use of renewable energy sources is a positive factor in building evaluations. In Brazil, this type of classification has recently started to be used in commercial buildings. When such ratings reach households, labeling will become an important variable in the calculation of the financial return of photovoltaic systems and may improve it considerably.
3.12. Power Supply at Peak Hours
3.13. Access to Temporary Energy Contract
According to current legislation in Brazil, consumers served at voltage levels ranging from 2.3 to 230 kV, with energy backup systems, are eligible to gain access to temporary energy contracts. Such contracts allow, for a given period of time, low cost electrical energy with the same reliability as long-run contracts. With this type of supply, the price of electrical energy from the grid is reduced because the market has an energy surplus at present, which can increase the return of the investment in photovoltaic generators.
3.14. Possibility of Legislation
Potential government incentives for photovoltaic electrical energy generation were not taken into account in analyses performed in this work, which would contribute to the feasibility of implementing such systems. These incentives could take the form of, for example, reduced energy tariffs or lending for the purchase of equipment, with a consequent market increase.
There are examples to be studied and adapted to the case of Brazil. The most prominent is the German model for encouraging the use of photovoltaic energy. In Germany, residential consumers can have their own power generation and sell it to the energy company, which is required by law to purchase all energy available at a price higher than the conventional. The cost of the PV energy is prorated to other consumers.
A procedure similar to that of Germany for electricity generation occurs in remote areas in Brazil, using diesel generators. The cost of operating these systems is prorated to consumers in other regions. Thus, those who need diesel do not pay the same cost as those in regions connected to conventional grid, which is mainly hydroelectric.
With the creation and expansion of the photovoltaic market in Brazil and the probable consequent cost reductions, solar PV energy would become attractive to residential consumers. Market creation depends on government incentives similar to those of the German program, in which the utility is required to buy all electrical energy surplus coming from renewable sources at a rate higher than the conventional price. ANEEL Normative Resolution 482, published in April 2012, which allows consumers to install small generation units in their homes, is the first step to expand the PV market in Brazil [21]. Other factors, including the relevance of energy independence and the cost of a lack of energy when the conventional grid fails, are more difficult to evaluate, but they must be considered for a better analysis.
4. Conclusions
The price of PV modules have dropped systematically and the adoption of these systems in a large scale in Brazil can force down the microgrid component prices, as has happened in countries that choose to invest in PV systems. Additionally, the energy price in Brazil has been increased in recent years because of non-favorable climatic conditions that made the hydroelectric power stations reservoirs fall to a very low level, as never seen before. Facing this scenario, the power management players had to activate all the thermal power plants which generate energy at very expensive rates in Brazil. As shown in the performed analysis, higher energy prices are favorable to the PV systems deployment.
Although the sensitivity analysis showed a range of simulation results, several other factors not yet measured can be combined to make the use of photovoltaic power generation a feasible alternative for residential consumers. The factors not yet measured include the following: (I) building labeling; (II) environmental concerns; (III) health due to avoided emissions; (IV) promotion of energy independency; and (V) decrease of fuel import, in the case of many countries.
Regulatory issues and techniques still need to be improved in Brazil, which will demand further discussions. The microgrid model proposed in this study cannot be implemented in Brazil at present because of legal issues regarding energy trading, only utilities can trade electricity. Prior to the implementation of microgrids in Brazil, it is necessary to discuss and formalize technical issues related to the electrical connection among a group of consumers and the utility.
Although the limited number of the microgrid participants used in the simulations, some conclusions can be extended to a higher penetration level of distributed photovoltaic energy. The analyses showed a tendency of an improved NPV for larger microgrid systems. The microgrid planner’s ability to overcome the issues of larger systems and the development of higher performance microgrid components may contribute to make it profitable to the investors.
Acknowledgments
The authors are grateful for the financial support provided by National Council for Scientific and Technological Development (CNPq), Research Support Foundation of Minas Gerais (FAPEMIG) and Higher Education Personnel Training Coordination (CAPES), as well as the Universidade Federal de Viçosa, for the opportunity given.
Author Contributions
This paper is part of the first author’s research conducted at the Universidade Federal de Viçosa, Viçosa, Minas Gerais, Brazil. This research was supervised, and co-supervised by the corresponding author and the remaining authors, respectively.
Conflicts of Interest
References
1. Lasseter, R.; Akhil, A.; Marnay, C.; Stevens, J.; Dagle, J.; Guttromson, R.; Meliopoulous, A.S.; Yinger, R.; Eto, J. White Paper on Integration of Distributed Energy Resources: The CERTS Microgrid Concept; Berkeley Lab Report; University of California: Berkeley, CA, USA, 2002; p. 46.
2. Diniz, A.S.A.C.; Machado Neto, L.V.B.; Camara, C.F.; Morais, P.; Cabral, C.V.T.; Oliveira Filho, D.; Ravinetti, R.F.; Franc, E.D.; Cassini, D.A.; Souza, M.E.M.; et al. Review of the photovoltaic energy program in the state of Minas Gerais, Brazil. Renew. Sustain. Energy Rev.2011, 15, 2696–2706.
3. ANEEL. Brazilian Electricity Regulatory Agency—Generation Database. Available online: http://www.aneel.gov.br/area.cfm?id_area=15 (accessed on 1 June 2010). (In Portuguese)
4. Pao, H.T.; Fu, H.C. Renewable energy, non-renewable energy and economic growth in Brazil. Renew. Sustain. Energy Rev.2013, 25, 381–392.
5. Energy Research Company Brazilian Energy Balance; Ministry of Mines and Energy: Rio de Janeiro, Brazil, 2011.
6. Lasseter, R.H. Microgrids and distributed generation. J. Energy Eng. Am. Soc. Civil Eng. 2007, 133, 144–149.
7. Huang, J.; Jiang, C.; Xu, R. A review on distributed energy resources and microgrid. Renew. Sustain. Energy Rev.2008, 12, 2472–2483.
8. Varella, F.K.O.M.; Cavaliero, C.K.N.; Silva, E.P. Energia solar fotovoltaica no Brasil: Incentivos regulatórios. Rev. Bras. Energ.2008, 14, 9–22. (In Portuguese)
9. Toledo, O.M.; Oliveira Filho, D.; Diniz, A.S.A.C. Distributed photovoltaic generation and energy storage systems: A review. Renew. Sustain. Energy Rev.2010, 14, 506–511.
10. Rüther, R.; Knob, P.J.; Jardim, C.S.; Rebechi, S.H. Potential of building integrated photovoltaic solar energy generators in assisting daytime peaking feeders in urban areas in Brazil. Energy Convers. Manag.2008, 49, 1074–1079.
11. Cabral, C.V.T.; Oliveira Filho, D.; Diniz, A.S.A.C.; Martins, J.H.; Toledo, O.M.; Machado Neto, L.V.B. A stochastic method for stand-alone photovoltaic system sizing. Sol. Energy2010, 84, 1628–1636.
12. Procel—National Program of Electric Energy Conservation. Available online: http://www.procelinfo. com.br/main.asp (accessed on 30 May 2011). (In Portuguese)
13. Souza, A.N.; Costa Junior, P.; Oliveira, R.; Zago, M.G.; Papa, J.P.; Gastadello, D.S. Algoritmos para estimar curvas de carga a partir de padrões de hábitos de consumo. In Proceedings of the 9th Brazilian Conference on Dynamics, Control and their Applications, Serra Negra, Brazil, 7–11 July 2010. (In Portuguese)
14. Grupo de Trabalho de Energia Solar—GTES; CEPEL—DTE—CRESESB. Manual de Engenharia Para Sistemas Fotovoltaicos. Available online: http://www.cresesb.cepel.br/publicacoes/ download/Manual_de_Engenharia_FV_2014.pdf (accessed on 22 February 2015).
15. General Sizing Instructions; Sandia National Lab: Springfield, VA, USA, 2009.
17. Talavera, D.L.; Muñoz-Cerón, E.; Casa, J.; Ortega, M.J.; Almonacid, G. Energy and economic analysis for large-scale integration of small photovoltaic systems in buildings: The case of a public location in Southern Spain. Renew. Sustain. Energy Rev.2011, 15, 4310–4319.
18. Ren, H.; Gao, W.; Ruan, Y. Economic optimization and sensitivity analysis of photovoltaic system in residential buildings. Renew. Energy2009, 34, 883–889.
19. Sechilariu, M.; Wang, B.; Locment, F. Building-integrated microgrid: Advanced local energy management for forthcoming smart power grid communication. Energy Build.2013, 59, 236–243. 20. Jardim, C.S.; Rüther, R.; Salamoni, I.T.; Viana, T.S.; Rebechi, S.H.; Knob, P.J. The strategic
siting and the roofing area requirements of building-integrated photovoltaic solar energy generators in urban areas in Brazil. Energy Build.2008, 40, 365–370.
21. ANEEL. Brazilian Electricity Regulatory Agency. Resolução Normativa no. 482, de 17 de Abril de 2012. Available online: http://www.aneel.gov.br/cedoc/ren2012482.pdf (accessed on 22 February 2015). (In Portuguese)
![Figure 1. Primary energy production in Brazil in 2010 [5].](https://thumb-eu.123doks.com/thumbv2/123dok_br/15702648.629349/2.892.151.727.877.1068/figure-primary-energy-production-brazil.webp)
![Figure 2. Domestic supply of electricity in Brazil in 2010 [5].](https://thumb-eu.123doks.com/thumbv2/123dok_br/15702648.629349/3.892.159.740.211.411/figure-domestic-supply-electricity-brazil.webp)