Arquivos Brasileiros de Cardiologia - Volume 82, Nº 5, Maio 2004
459
Data on the mortality profile in Brazil indicate that diseases of thecirculatory system are the major cause of death in our country 1-3. The participation of cardiovascular diseases in mortality has been increasing since the mid 20th century. In 1950, only 14.2% of the deaths occurring in Brazilian capitals were attributed to circulatory diseases 1,4. In 1999, heart diseases contributed to 32% of all deaths 5.
Several epidemiological studies, from the Framingham study onwards, have provided opinions about the risk factors involved in the etiology of cardiovascular diseases 6,7. The currently known risk factors may be classified into 2 basic groups: the unmodifiable and the modifiable 4,7-10. The unmodifiable risk factors are as follows: age, sex, race, and genetic heritage. The modifiable risk factors are as follows: dyslipidemias,dietary habit, arterial hypertension, smoking, alcoholism, sedentary lifestyle, diabetes mellitus, obesity, stress, hyperhomocysteinemia.
The usual diet has been considered a fundamental element of analysis of the determinants of susceptibility for the appearance of nontransmissible chronic diseases. The hyperlipidemic and athe-rogenic potential of the diet is related to its content of cholesterol and saturated fat, as well as to the total amount of energy in the diet 11-13.
The influence of dietary cholesterol and saturated fat is so impor-tant that Connor et al 12 developed a cholesterol/saturated-fat index to assess the effect of the diet on serum cholesterol levels. Based on this index, Torres 14 developed a table containing the caloric value and the cholesterol/saturated-fat index of 187 food items and preparations usually used by the Brazilian population. Based on these data, Abreu et al (unpublished data) developed a scoring system to control the serum levels of cholesterol and fat, aiming at providing an instrument of dietary intervention for hypercholestero-lemic patients, and also at preventing the diseases related to the excessive consumption of cholesterol and saturated fat.
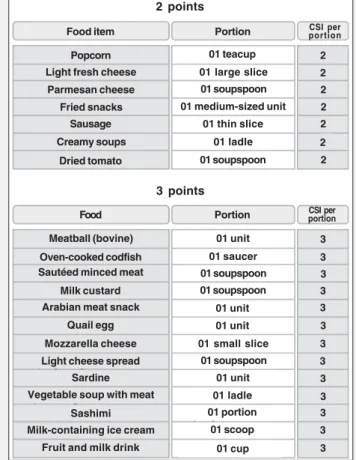
This instrument presents a list of food items measured with household utensils with a score based on the cholesterol/saturated-fat index, constituting a scoring system and explanatory material with detailed instructions for individuals to determine their target score, and also recommendations for a healthy diet (fig. 1). It is worth noting that the tools for dietary intervention can be theore-tically correct, but, if not understood, they will not fulfill their purpose 15. Therefore, the present study assessed the understanding of the population about the scoring system for controlling the serum levels of cholesterol and fat.
Methods
We carried out a methodological study assessing 153 indivi-duals of both sexes, with ages ranging from 20 to 65 years,
Original Article
Concordance of the Scoring System for Controlling
the Serum Levels of Cholesterol and Fat
Marcia de Araujo Leite Nacif, Edeli Simioni de Abreu, Elizabeth Aparecida Ferraz da Silva Torres
São Paulo, SP - Brazil
Faculdade de Saúde Pública, Faculdade de Ciências Farmacêuticas and Faculdade de Economia e Administração of USP
Mailing address: Faculdade de Saúde Pública da USP - Profa. Assoc. Elizabeth A.F.S. Torres - Av. Dr. Arnaldo, 715 – Cep 01246-904 São Paulo, SP, Brazil.
Received: 2/27/03 Accepted: 7/28/03
English version by Stela Maris C. e Gandour
Objective
To evaluate the comprehension of the scoring system for controlling the serum levels of cholesterol and fat as an instru-ment of dietary intervention for hypercholesterolemic patients.
Methods
The study comprised 153 individuals of both sexes, with ages ranging from 20 to 65 years, who sought medical care in a hospital or in a basic health unit. They were divided into the following 3 groups: hypercholesterolemic individuals, individuals with no diagnosis of hypercholesterolemia, and health care pro-fessionals. A 24-hour recall was used with each individual, who applied the cholesterol/saturated-fat index to their diets, consul-ting the scoring system. The researcher confirmed the calculation of each participant, considering her calculation as the a refe-rence pattern. Understanding of the system was assessed through comparison between the reference pattern and the data obtained by the interviewees, using the intraclass correlation coefficient.
Results
The patients without a diagnosis of hypercholesterolemia obtained a high correlation in all meals. The morning and after-noon snacks and supper were the meals with the greatest corre-lation (r=1). In hypercholesterolemic individuals, supper was the meal with the greatest concordance with the reference score (r=1), and the health care professionals obtained a correlation coefficient of 1 in all meals, except lunch (r=0.99).
Conclusion
The scoring system was fast, simple, and easy to be unders-tood and accepted by the population studied.
Key words
Arquivos Brasileiros de Cardiologia - Volume 82, Nº 5, Maio 2004
460
Concordance of the Scoring System for Controlling the Serum Levels of Cholesterol and Fat
residents in the municipality of Ourinhos in 2002, who sought medical care at the hospital or in basic health care units. They were divided into the following 3 groups: hypercholesterolemic patients; patients without a diagnosis of hypercholesterolemia; and health care professionals (physicians, nutritionists, nurses, nurse’s aides, and technicians). All participants signed a written informed consent. The following individuals were excluded from the study: illiterate individuals or those unable to write, because the scoring system required reading and understanding skills, in addition to taking note of the food score; individuals who could not calculate, because the method required addition and multipli-cation for composing the cholesterol/saturated-fat index; individuals who could not answer the interview and calculate their score due to visual, auditory, or neurological problems.
The methodology of this study was adapted from research
carried out at Washington University16. To assess whether the
instrument in question was understood by the target population, the researcher used the 24-hour recall, which consisted of re-cording the dietary ingestion of the interviewees in the preceding 24 hours. For each type of food item mentioned by the individuals, further information was asked about its type, size of the portion, the amount consumed, and the utensils used. To help the inter-viewees in estimating the amount of food ingested, a kit of house-hold utensils and measuring spoons was shown to the individuals in case of doubt.
After applying the 24-hour recall, the researcher showed the scoring system for controlling serum levels of cholesterol and fat to the interviewees, and asked them to calculate their cholesterol/ saturated-fat index based on the food list. The time required for each participant to calculate the dietary score (the scoring time)
was recorded. Then, the researcher also calculated the choles-terol/saturated-fat index of the 24-hour recall for each participant. The researcher values were considered as reference points.
Understanding of the population about the scoring system was assessed by comparing the reference values with the values ob-tained by the interviewees.
This system comprises a list with 240 food items measured with household utensils, which were scored for cholesterol/satu-rated-fat index (CSI), calculated according to the methodology cited in the study by Connor et al12 with the formula: CSI = (1.01 x g of saturated fat) + (0.05 x mg of cholesterol). A low index means a high capacity to reduce hyperlipidemias. The list has a brochure-like format with 22 pages and is accompanied by ex-planatory material with detailed instructions about how to choose food and how to determine the score of daily cholesterol/saturated-fat index with simplified easy-to-use tables and no food restrictions. In addition, it contains clear and objective messages in regard to the need for maintaining a healthy weight and steps to be followed to obtain a balanced diet.
Statistical analysis was performed with the aid of the Statistical Package for the Social Sciences (SPSS), version 10.0 for Win-dows17. Aiming at comparing the score of the cholesterol/saturated-fat index in the 6 different meals (breakfast, morning snack, lunch, afternoon snack, dinner, and supper) and also the overall score, obtained by the interviewee and by the interviewer, the intraclass correlation coefficient was estimated18. These coefficients were estimated for each study group and in different educational levels. The comparison of the mean scoring time for the cholesterol/ saturated-fat index in the different educational levels was initially performed by calculating the means and standard deviations, and later with analysis of variance 19. For comparing the means of the scoring time for the cholesterol/saturated-fat index according to educational level, the Bonferroni test was used.
Results
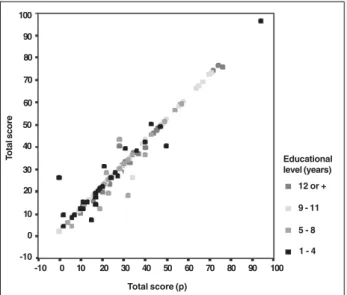
Figures 2 and 3 show the score distribution provided by the individuals and by the researcher, according to the groups studied and educational level, respectively.
Tables I and II compare the score for the cholesterol/saturated-fat index in 6 different meals and also the overall score provided by the interviewee and the interviewer for each group studied in different educational levels.
According to table I, the patients without a diagnosis of hy-percholesterolemia obtained a high correlation, ie, the number of right answers in relation to the score for the cholesterol/saturated-fat index calculated by the interviewees and by the researcher was very high in all meals. The morning snack, afternoon snack, and supper were the meals with the greatest correlation (r=1), although the others were also adequate. The hypercholesterolemic patients also obtained a high correlation. Supper was the meal with the greatest concordance with the reference score (r=1), although the other meals had a high concordance. The health care professionals obtained an intraclass correlation coefficient of 1 in all meals, except for lunch, showing that most participants in this group agreed with the reference score.
Table II shows the correlation coefficient according to edu-Fig. 1 – Example of the scoring system for controlling the serum levels of
cholesterol and fat.
2 points
Food item
3 points
Portion portionCSI per
Popcorn 01 teacup 2
Light fresh cheese 01 large slice 2
Parmesan cheese 01 soupspoon 2
Fried snacks 01 medium-sized unit 2
Sausage 01 thin slice 2
Creamy soups 01 ladle 2
Dried tomato 01 soupspoon 2
Food Portion CSI perportion
Meatball (bovine) 01 unit 3
Oven-cooked codfish 01 saucer 3
Sautéed minced meat 01 soupspoon 3
Milk custard 01 soupspoon 3
Arabian meat snack 01 unit 3
Quail egg 01 unit 3
Mozzarella cheese 01 small slice 3
Light cheese spread 01 soupspoon 3
Sardine 01 unit 3
Vegetable soup with meat 01 ladle 3
Sashimi 01 portion 3
Milk-containing ice cream 01 scoop 3
Arquivos Brasileiros de Cardiologia - Volume 82, Nº 5, Maio 2004
461
Concordance of the Scoring System for Controlling the Serum Levels of Cholesterol and Fat
cational levels. The individuals who studied up to 4 years had adequate correlation coefficients in all meals. The breakfast showed the lowest concordance. In regard to individuals whose educational level was up to 8 years, their breakfast was also the meal with the lowest correlation. When the correlation between the score for the cholesterol/saturated-fat index and individuals whose edu-cational level was up to 11 years, a strong correlation was observed in all meals. The coefficient obtained for the morning snack, af-ternoon snack, dinner, and supper was r=1, which shows a perfect correlation. The analyses revealed that individuals whose educa-tional level exceeded 11 years also had a very high correlation, mainly for breakfast, afternoon snack, and supper as the meals with the highest level of correct answers (r=1). The morning snack was the meal with the lowest correlation (r=0.8537).
Table III shows the scoring time for the cholesterol/saturated-fat index, considering the educational level of the individuals. The result of the analysis of variance revealed that the mean scoring times for the cholesterol/saturated-fat index are not statistically equal in several educational levels (P=0.003).
The multiple comparisons of the means showed that individuals
with up to 4 years of education had a scoring time for the choles-terol/saturated-fat index similar to those with up to 8 years of education (P < 0.99). In regard to the other educational levels, the scoring time for the cholesterol/saturated-fat index was longer for individuals with up to 4 years of education than for individuals with 11 years or more (P < 0.05). However, the scoring time for the cholesterol/saturated-fat index for individuals with up to 8 years of education and for those with up to 11 years or more did not differ statistically (P = 0.06).
Discussion
In the present study, the concordance of the scoring system for controlling the serum levels of cholesterol and fat was assessed by comparing the score for the cholesterol/saturated-fat index of the 24-hour recall obtained by the interviewee and that obtained by the interviewer. The intraclass correlation coefficient was cal-culated for statistical analysis 18. Although the distribution of the variables studied is not normal, the statistical technique used was adequate for fulfilling the objectives of the study.
Differences were observed in the values of correlation between the meals (breakfast, morning snack, lunch, afternoon snack, dinner, and supper) for each group studied (high cholesterol, low choles-Total score (p)
T
otal score
9 - 11
5 - 8
1 - 4 Educational level (years) 100
90
80
70
60
50
40
30
20
10
0
-10
-10 0 10 20 30 40 50 60 70 80 90 100
Fig. 3 – Score distribution of the individuals and researcher (p) according to educational level.
12 or + Total score (p)
T
otal score
Health care professionals
High cholesterol
Low cholesterol Group 100
90
80
70
60
50
40
30
20
10
0
-10
-10 0 10 20 30 40 50 60 70 80 90 100
Fig. 2 – Score distribution of the individuals and researcher (p) according to the groups studied.
Table I - Estimates of the intraclass correlation coefficient in the groups studied according to the type of meal
Correlation coefficient
Type of meal Low cholesterol High cholesterol Health care professional
Breakfast 0.9676 0.8171 1
Morning snack 1 0.7595 1
Lunch 0.9980 0.9592 0.9915
Afternoon snack 1 0.9582 1
Dinner 0.9945 0.9660 1
Supper 1 1 1
Total 0.9935 0.9295 1
Table II - Estimates of intraclass correlation coefficient according to the type of meal and educational level (years of study)
Correlation coefficient
Type of meal 1 - 4 5 - 8 9 - 11 12 or +
Breakfast 0.6644 0.6809 0.9993 1
Morning snack 1 1 1 0.8537
Lunch 0.9673 0.9724 0.9946 0.9864
Afternoon snack 0.9622 1 1 1
Dinner 0.9608 0.9972 1 0.9999
Super 1 1 1 1
Total 0.9502 0.9449 0.9972 0.9960
Table III - Scoring time for the cholesterol/saturated-fat index according to educational level (years of study)
Educational level Scoring time (minutes)
(years studied) N* Mean Minimum Maximum Standard deviation
1 – 4 29 5.86 3.00 10.00 2.42
5 – 8 26 5.77 2.00 10.00 2.70
9 – 11 54 4.52 2.00 10.00 1.78
12 ou + 44 4.27 2.00 10.00 1.70
Arquivos Brasileiros de Cardiologia - Volume 82, Nº 5, Maio 2004
462
Concordance of the Scoring System for Controlling the Serum Levels of Cholesterol and Fat
terol, and health care professionals) in the different educational levels (tab. I and II). The health care professionals had greater correlation coefficients than the individuals in the other 2 groups. The hypercholesterolemic individuals also had lower correlation coefficients in some meals and in the overall score as compared with individuals without a diagnosis of hypercholesterolemia.
Individuals who studied up to 4 years had lower correlation coefficients as compared with those in other groups. Individuals who studied up to 8 years had lower correlations than those who studied 11 years or more, and, in these 2 groups the correlation coefficients were similar.
In regard to the different meals, some obtained a higher score than others did. Breakfast was the meal with the lowest correlation coefficient in the population studied, which may be explained by the presence of foods, such as butter, margarine, jam, cheese, and ham. In the scoring system, these food items are expressed in units of household utensil measurements, such as 1 soupspoon or a knife tip, and some mathematical operations have to be performed to find the cholesterol/saturated-fat index of the food item ingested.
In regard to lunch and dinner, the correlation coefficients were greater than that for breakfast, because most individuals ingest only 1 portion of some protein food items, such as 1 piece of beef or 1 egg, and these were the amounts of food expressed in hou-sehold measurements in the scoring system, which facilitated
scoring the cholesterol/saturated fat index. We also observed that in these meals many individuals ingested vegetables and fruits, which, according to what is written in the scoring system, have a cholesterol/saturated fat index = 0, which also facilitated scoring. In regard to morning and afternoon snacks and supper, the very high correlation coefficients are due to the fact that most of the population does not usually have these meals, and, when they do, few are the food items ingested, such as 1 serving of yogurt and a glass of milk, which facilitates the scoring of the cholesterol/saturated-fat index.
The mean scoring time of the individuals was approximately 5 minutes. The statistical analyses revealed that the higher the educational level of the individuals, the shorter the scoring time for the cholesterol/saturated-fat index. Mitchell et al16 found a mean of 10 minutes (range = 3 to 25 minutes). These data, in addition to the high correlation coefficients found in this study, indicate that the scoring system is a fast instrument of dietary orientation easily understood by the population.
Acknowledgments
We thank Drs Sonia Tucunduva Philippi and Betsabeth Slater Villar, Silvia M. F. Cozzolino, and biologist Geni Rodrigues Sampaio for their support.
1. Lotufo PA, Lolio CA. Tendências de evolução da mortalidade por doenças cardio-vasculares: o caso do Estado de São Paulo. In: Monteiro, CA. Velhos e novos ma-les da saúde do Brasil – A evolução do país e de suas doenças. São Paulo: HUCITEC NUPENS/USP 1995; 279-287.
2. Lotufo PA. Mortalidade por doenças do coração no Brasil. Comparação com outros países. Arq Bras Cardiol 1998; 70: 321 – 5.
3. Laurenti R, Buchalla CM. Os mitos a respeito das doenças cardiovasculares. Arq Bras Cardiol 2001; 76: 99-104.
4. Ministério da Saúde. Secretaria nacional de ações básicas de saúde. Divisão na-cional de epidemiologia. Doenças cardiovasculares no Brasil – Sistema único de saúde – SUS. Brasília: Centro de Documentação do Ministério da Saúde; 1993. 5. Ministério da saúde. Estatísticas de mortalidade. [on line]. Disponível em URL
<www.saúde.gov.br> [27 janeiro 2003].
6. Cervato AM, Mazzilli RN, Martins IS, Marucci MF. Dieta habitual e fatores de risco para doenças cardiovasculares. Rev. Saúde Pública 1997; 31: 227-35. 7. Macambira R, Poli DM, Canosa HG, et al. Aterosclerose – fatores de risco. JBM
2001; 81: 64-8.
8. Organización Mundial de la Salud. Factores de riesgo de enfermidades cardiovas-culares: nuevas esferas de investigación. Ginebra; 1994. (OMS – Serie de Informes Técnicos, 841).
9. Kannel WB. Una perspectiva sobre los factores de riesgo de las enfermidades car-diovasculares. In: Org Pan de la Salud (publicación científica, 155). El desafio de la epidemiologia – Problemas y lecturas selecionadas. Washington; 1988.
10. Fisberg RM, Stella RH, Morimoto JM, Pasquali LS, Philippi ST, Latorre MRDO. Perfil lipídico de estudantes de nutrição e a sua associação com fatores de risco para doenças cardiovasculares. Arq Bras Cardiol 2001; 72: 137 – 42. 11. Zilversmit DB. Cholesterol index in foods. J Am Diet Assoc 1979; 74: 562-5. 12. Connor SL, Gustafson JR, Artaud-Wild SM, et al.The cholesterol/saturated-fat
index: an indication of hipercolesterolemic and atherogenic potential of food. Lancet 1986; (May): 1229-32.
13. Connor SL, Gustafson JR, Artaud-Wild SM, et al. The cholesterol/saturated-fat index for coronary prevention: Background, use, and a comprehensive table of foods. J Am Diet Assoc 1989; 89: 807-16.
14. Torres EAFS. Teor de lipídeos em alimentos e sua importância na nutrição. São Paulo; 2000. Tese de Livre Docência - Faculdade de Saúde Pública da USP. 15. Peña M e Molina V. Guias alimentarias y promoción de la salud en américa latina.
Organización Panamericana de la Salud –INCAP, 1998.
16. Mitchell DT, Korslund MK, Brewer BK, Novanscone MA. Development and valida-tion of the cholesterol-saturated fat index (CSI) Scorecard: a dietary self-monito-ring tool. J Am Diet Assoc 1996; 96: 132-6.
17. SPSS for windows, release 10.0.1, Standard Version, 1999.
18. Fleiss JL. The design of clinical experiments. New York: John Wiley & Sons; 1986. 19. Neter J, Kutner MH, Nachtsheim CJ, Wasserman W. Applied linear statistical