SPATIAL AND TEMPORAL ORGANIZATION OF AQUATIC
INSECTS ASSEMBLAGES IN THE LONGITUDINAL
GRADIENT OF A TROPICAL RIVER
BAPTISTA, D. F.,1 DORVILLÉ, L. F. M.,2,3 BUSS, D. F.1,2 and NESSIAMIAN, J. L.2
1Laboratório de Avaliação e Promoção da Saúde Ambiental, Departamento de Biologia, IOC, Fiocruz, Av. Brasil,
4.365, CEP 21045-900, Manguinhos, Rio de Janeiro, Brazil
2Laboratório de Entomologia, Departamento de Zoologia, CCS, UFRJ, C.P. 68.044, CEP 21944-970,
Ilha do Fundão, Rio de Janeiro, Brazil
3Colégio de Aplicação e Faculdade de Formação de Professores, UERJ
Correspondence to: Darcílio F. Baptista, Laboratório de Avaliação e Promoção da Saúde Ambiental, Departamento de Biologia, IOC, Fiocruz, Av. Brasil, 4.365, CEP 21045-900, Manguinhos, Rio de Janeiro, Brazil,
e-mail: [email protected]
Received May 2, 2000 – Accepted May 10, 2000 – Distributed May 31, 2001 (With 8 figures)
ABSTRACT
The distribution and abundance of aquatic insects were studied in the longitudinal gradient of the wa-tershed of Macaé River, a coastal Atlantic Forest river in South-eastern Brazil. Sampling stations were selected in the first, second, fourth, fifth, and sixth orders and sampled in April, July, and October 1995. This represented the end of the rainy season, the dry season, and the beginning of another rainy season, respectively. In each month four samples were collected using a Surber sampler from each of the follo-wing substrates: sand, litter deposited in pool areas, litter in riffle areas, and stones. A total of 46,431 specimens of aquatic insects belonging to ten orders were obtained. The data were analyzed by the mul-tivariate methodologies of Correspondence Analysis (CA) and Cluster Analysis (UPGMA) using the similarity index of Morisita, for all three months. Both showed a significant faunal disrupture in the river, which can be divided in two sections: the upper one, from first to fourth orders, and the lower section, including fifth and sixth orders. The same results were obtained with presence-absence matrices, using Jaccard similarity index, showing that the changes are not only due to quantitative differences. A Mantel test was used to compare the assemblage composition temporally and no difference was de-tected between the three months. Moreover, a Canonical Correspondence Analysis (CCA) was applied to the data to check which of the 14 physical and chemical variables significantly explained macro-invertebrate community variation. The most significant variables were conductivity, CPOM, and pH for the upper stations (1st, 2nd and 4th orders), and alkalinity, FPOM, and HCO
3 for the lower stations (5th and 6th orders).
Key words: aquatic insect, longitudinal gradient, tropical river, multivariate analysis.
RESUMO
Organização espacial e temporal de agrupamentos de insetos aquáticos no gradiente longitudinal de um rio tropical
multi-variadas de Análise de Correspondência (Aco) e Análise de Agrupamento (UPGMA), utilizando o índice de similaridade de Morisita, para os três meses. Ambos os testes mostraram uma significativa quebra no padrão de organização da fauna, os quais podem ser divididos em duas seções: trecho superior, da 1a à 4a ordem, e seção inferior, que inclui as 5a e 6a ordens. Os mesmos resultados foram obtidos com as matrizes de presença e ausência, utilizando o índice de similaridade de Jaccard, mostrando que as mudanças não eram apenas devido a diferenças quantitativas. O teste de Mantel, utilizado para comparar a composição da fauna temporalmente, não indicou diferenças entre os três meses amostrais. Além disso, a Análise de Correspondência Canônica (ACC) foi aplicada a fim de verificar como 14 variáveis físico-químicas poderiam explicar a variação da comunidade. As variáveis mais significativas foram condutividade, CPOM e pH, para o trecho superior (1a à 4a ordem), e alcalinidade, FPOM e HCO
3 para o inferior (5a e 6a ordens).
Palavras-chave: insetos aquáticos, gradiente longitudinal, rio tropical, análise multivariada.
INTRODUCTION
A major concern of stream ecologists has been to understand which variables best explain the observed patterns of distribution and abundance of macroinvertebrates (Hynes, 1970). Several fac-tors have been considered as decisive in structuring macroinvertebrate assemblages in streams: subs-trate (Reice, 1980; Rae, 1985), allochthonous mat-ter (Cummins & Klug, 1979), temperature (Vannote & Sweeney, 1980; Ward & Stanford, 1982), flow (Rabeni & Minshall, 1977; Dudgeon, 1993a), dis-turbance (Siegfried & Knight, 1977; Death & Win-terbourn, 1995), and biotic interactions (Kohler, 1992).
Many other studies have tried to explain the macroinvertebrate patterns along the longitudinal section of rivers (Vannote et al., 1980; Winterbourn et al., 1981; Culp & Davies, 1982; Cushing et al.,
1983; Statzner & Higler, 1985; Naiman et al.,
1987; Brussock & Brown, 1991; Palmer et al.,
1994). To explain the observed faunal gradient along the rivers in these studies, two different views have emerged. Vannote et al. (1980) argued that
river communities are adjusted to a continuum gradient of changes in physical conditions to assu-me processing strategies involving minimum energy loss, so that downstream communities are organized to capitalize on upstream processing inefficiencies. Statzner & Higler (1985) and Statzner et al. (1988),
suggested the idea that hydraulic stress, associated with streambed geomorphology, is the main factor structuring lotic communities, and that these factors do not always vary in a predictable way longi-tudinally.
In South America, few studies have focused on altitudinal gradient of rivers (Illies, 1964;
Do-minguez & Ballesteros Valdez, 1992; Jacobsen et al., 1997). Illies (1964), sampled the invertebrate
fauna of the Huallaga River in Peru, but data were qualitative and restricted to the stony microhabitat. Dominguez & Ballesteros Valdez (1992), worked in the Cañas-Horcones River, in Northwestern Ar-gentina, and restricted their study to the Epheme-roptera fauna. Jacobsen et al. (1997) compared the
invertebrate assemblage structure in an altitudinal gradient in Ecuatorian streams, but they worked mainly at family level. Therefore, there are no exten-sive works considering the longitudinal feature of the aquatic biota of streams in this part of the world. The aim of this study is to provide infor-mation about the spatial and temporal composition and structure of the aquatic insect fauna along the longitudinal gradient of a river in South America.
MATERIAL AND METHODS
Study area
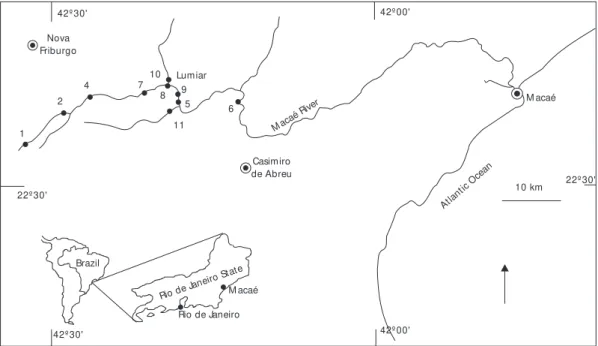
The study area is in the watershed of Macaé River, in the State of Rio de Janeiro, South-eastern Brazil (Fig. 1). This river begins at 1,500 m of elevation in the Ecological Reserve of Macaé de Cima (22o21'-22o28'S and 42o27'-42o35’W), an area covered by the Atlantic Forest, and extends through 110 km before reaching the Atlantic Ocean, as a sixth order river.
the mean monthly discharge values for the Macaé River, obtained from the Departamento Nacional de Energia – Denae (National Department of Energy), from 1951 to 1993 (Fig. 2).
Sampling stations
Ten sampling stations were selected, repre-senting first, second, fourth, fifth and sixth river orders (Fig. 1). Third order sites could not be sampled because of difficult access. The first (1) and second (2) sampling stations were in pristine areas of the Flores River, a tributary of the Macaé River, at 1,100 m and 1,000 m of elevation,
res-pectively. Both were similar, presenting a well preserved forest closely associated with the river. At site 4 (fourth order, 950 m) the river was wider and more heterogeneous than the upstream sections, and presented distinct areas of riffles and pools. In the fifth order (site 5, 655 m) the riparian vege-tation was composed by mixed pasture and forest, while in the sixth order (site 6, 10 m) is formed mainly by pasture land. Each of these stations were sampled three times, in April 1995 (end of the rainy season), July 1995 (dry season) and in October 1995 (beginning of the rainy season). In August 1996, five sites were sampled.
Nova Friburgo
42º 30'
1 2
4 7 10
8 9 5 11
6
22º 30'
Lumiar
Casimiro de Abreu
Mac aé Ri
ver M acaé
M acaé
10 km
Atla ntic
Oce an
22º 30'
42º 30' 42º 00'
42º 00'
Brazil
Rio de Janeiro
State
Rio de Janeiro
Fig. 1 — Map of the Macaé River watershed, showing the sampling stations (1, 2, 4, 5, 6, 7, 8, 9, 10, 11).
D
is
c
h
a
rg
e
(
m
/
s)
3
0 2 4 6 8 10
J F M A M J J A S O N D
M onths
These sites were located at about the same altitude (around 650 m) but differed in the degree of integrity and stream order. Three of these stations were located in the Macaé River, sites 7, 8 and 9. One station was collected in Boa Esperança River (site 10) and one in Bonito River (site 11). Stations 7 (fourth order) and 11 (fifth order) were at well preserved areas, compared to stations 8 (fifth order), 9 (fifth order) and 10 (fourth order), which represented degraded river sites (Fig. 1).
Macroinvertebrate sampling
At each sampling station, three samples were taken from each of the following microhabitats using a Surber sampler (area of 900 cm2 and 120 µm mesh size): sand (A), litter in pools (F), litter in riffles (C) and stones (P), except in the sixth order station (site 4), where stones were absent. The three samples of each substrate were grouped, then it was con-sidered one sample per substrate per site.
Several physical and chemical variables were measured each time a biological sample was taken (Table 1). Besides, hydrologic variables such as
mean water velocity, mean depth, river width, and discharge, were recorded.
As the identification of aquatic insects to species level in South-eastern Brazil is not possible in most cases, specimens were assigned to Opera-tional Taxonomic Units (OTUs) that represented the lowest taxonomic level that could be reached by means of the keys provided by Merritt & Cum-mins (1988), Dominguez et al. (1992),
Trivinho-Strixino & Trivinho-Strixino (1995), Froehlich (1984), and Benedetto (1974), and/or with the aid of ta-xonomists.
Data analysis
In order to test if there was temporal change in the faunal composition, a Mantel test (Zar, 1996) with 1,000 iterations was applied to the presen-ceabsence matrices. The matrices were compared in a pairwise fashion, that is, April x July; April x October; and July x October. The total frequency matrices of all stations (except in the sixth order) were also compared by the same quantitative me-thods described above.
River orders
1st 2nd 4th 5th 6th
Parameters
mean sd mean sd mean sd mean sd mean dv
Total hardness (mg CaCO3.L–1) 4.67 4.62 2.00 1.00 6.00 0.00 13.33 1.15 15.67 2.52
Ca hardness (mg CaCO3. L–1) 1.33 1.53 1.33 1.53 2.67 1.53 5.67 4.04 5.67 2.52
Mg hardness (mg CaCO3. L–1) 3.33 3.21 0.67 0.58 3.33 1.53 7.67 4.04 10.00 2.00
Ca concentration (mg. L–1) 0.53 0.61 0.53 0.61 1.07 0.61 2.27 1.62 2.27 1.01
Mg concentration (mg. L–1) 0.80 0.79 0.13 0.12 0.80 0.36 1.90 1.00 2.40 0.50
Chlorides (mg. L–1) 2.30 0.90 1.70 0.52 1.40 0.00 1.70 0.52 2.93 1.42
pH 6.27 0.64 6.20 0.36 6.43 0.25 6.40 0.36 6.50 0.20
Condutivity (µnho.cm–1) 22.07 15.54 10.00 0.00 28.33 19.42 58.33 38.19 58.33 14.43
Total alkalinity (mg CaCo3.L–1) 2.00 0.00 1.00 0.00 2.33 0.58 10.33 5.13 11.67 2.08
Carbonate alkalinity (mg CaCo3. L–1) 2.00 0.00 1.00 0.00 2.33 0.58 10.33 5.13 11.67 2.08
HCO3 concentration (mg.L–1) 2.40 0.00 1.20 0.00 2.83 0.75 12.57 6.27 14.23 2.55
River width (m) 1.78 0.13 7.60 0.53 14.67 0.58 19.50 3.12 47.67 2.31
Depth (m) 0.14 0.02 0.18 0.03 0.20 0.05 0.36 0.09 0.30 0.09
Velocity (m.s–1) 2.99 0.91 2.25 0.45 2.64 1.02 2.72 1.16 2.50 0.87
Discharge (m3.s–1) 1.04 0.46 3.00 0.14 7.89 3.25 19.14 9.75 35.73 13.37
Water temperature (oC) 14.67 0.58 16.00 1.73 18.67 1.53 19.33 2.08 22.33 4.04
Atmospheric temperature (oC) 17.67 1.53 20.33 1.53 22.00 1.73 23.00 3.00 24.67 4.93
TABLE 1
Absolute numbers of animals per substrate per sample were transformed by log(x+1) and submitted to the multivariate methodology of Cor-respondence Analysis – CA (Dudgeon, 1993b). The eigenvalues considered significant were only those that explained a higher proportion of variance than randomly expected by the broken-stick model (Rohlf, 1992). The scores of the groups of points in the first axis were tested with an ANOVA to detect any significant distinction between them. These matrices were also submitted to the clas-sification method of Cluster Analysis (UPGMA), with the similarity index of Morisita as the as-sociation coefficient.
Binary matrices (considering only presence and absence data) were also submitted to an CA, and a Cluster Analysis (UPGMA) employing the Jaccard similarity index. The obtained patterns were compared with those resulting from the quan-titative data. Again, broken-stick model and ANO-VA were used. A Canonical Correspondence Analysis (CCA; Ter Braak, 1986) was performed to relate the abundance matrices with 14 physical and chemical parameters.
RESULTS
The dry period (July) had the highest abun-dance (26,492 specimens) and richness values (101 taxa) of all periods. When comparing sites, the highest abundance was recorded in the fifth order (14,669 specimens), but the highest richness (95 taxa) was recorded in the fourth order (Table 2). The comparison between the presence-absen-ce matripresence-absen-ces showed the following results: April x July, r = 0.554 (Z = 0.0010); April x October, r = 0.480 (Z = 0.0010); and July x October, r = 0.481 (Z = 0.0010). These values revealed that there was no significant difference in the macroin-vertebrate assemblage composition between the three seasons.
Only the first axis of the CA, based on quan-titative data, was significant, explaining 14.43% of the variation. The CA graphic showed a clear division of the river in two sections, an upper one, from first to fourth orders, and a lower section, comprising fifth and sixth orders (Fig. 3). These results confirm the similarity of samples from the upper section, as well as among those from the fifth and sixth orders, regardless of the type of substrate. The same pattern was obtained for the
three months so only the results for July, the month with greatest abundance and richness, are presented here. The complete list of aquatic invertebrate taxa recorded is presented only for July but represents all groups (Appendix).
The highest absolute contributions to the first axis of the CA were litter in riffle areas (C5, 21.4%) and stones (P5, 11.0%), both from fifth order. For the upper section, on the left in Fig. 3, litter in pool areas was the most important substrate, with an absolute contribution of 8.5% in the first order (F1) and 8.1% in the second order (F2). Sand samples (A) from the five river orders did not have high contributions to the observed pattern, which was also true for the litter in pool areas from the fifth order (F5). The ANOVA detected a significant distinction between the two groups (p = 0.000) (Fig. 3).
The taxa with highest positive contributions to the first axis in the CA were Simuliidae (11.6%),
Leptohyphes pereirae (Ephemeroptera) (8.3%),
Orthocladiinae (7.2%), and Hudsonema
(Trichop-tera) (5.6%). The highest negative contributions to this axis were Triplectides (3.4%), Phylloicus
(3.3%), and Nectopsyche (2.1%), all of them
Tri-choptera (Fig. 4).
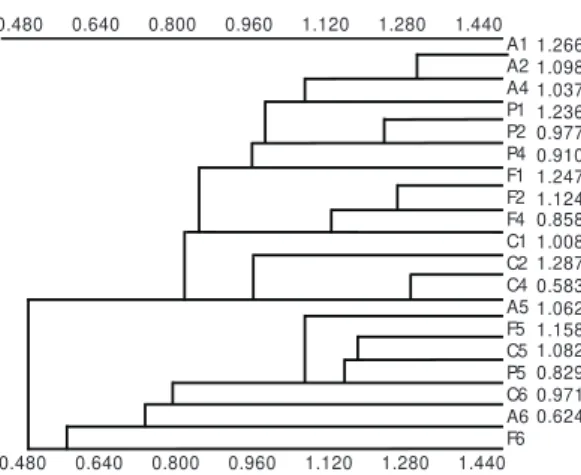
The dendrograms from the Cluster Analysis have separated the samples in the same two sections provided by the CA, for the three seasons.
Since the pattern was the same in all months, only the dendrogram for July is presented here (Fig. 5). Considering only samples taken from first, second, and fourth orders, this analysis is dis-tinguishes between the different type of substrates, regardless of the river order.
The use of the same ordination and classi-fication methods to the presence-absence data resulted in the same pattern exhibited by the quan-titative data.
The CCA has also presented a fauna divided in the two sections already described.
The most important parameters responsible for this division were conductivity, pH, CPOM and dissolved oxygen, associated with the upper section, and alkalinity, HCO3, FPOM, Ca+ and chlorides for the lower section (Fig. 6).
TABLE 2
Number of taxa and abundance of specimens along the orders of Macáe River in July.
1st order 2nd order 4th order 5th order 6th order Specimens Taxa
April 1,730 1,902 2,686 2,650 391 9,359 99
July 1,210 2,570 6,722 14,669 1,321 26,492 100
October 749 988 5,196 2,903 744 10,580 95
Specimens 3,689 5,460 14,604 20,222 2,456 46,431 –
Taxa 90 92 95 60 48 – 117
F2 F1
0 1
F4 C1
A2 A6 A4 C2 A1 P4 C4
P1P2
C6 F6 F5
C5
A5 P5
1.5 0.5 –0.5 –1 –1.5
Fig. 3 — Correspondence Analysis based on the different substrate types (A – sand; F – litter in pool areas; P – stones; C – litter in riffle areas) along the river orders (1, 2, 4, 5 and 6).
0 1
2
Nectopsyche
Triplectides
Tupiperla
Helicopsyche 2 Phylloicus Leptoceridae 1
Chironominae
Simulidae
Chimarra
Leptohyphes pereirae
Orthocladiinea Staphilinidae
Gomphoides Belastomatidae
Hudsonema
1.5 0.5 –0.5 –1 –1.5 –2 –2.5
Fig. 4 — Correspondence Analysis of the taxa in the different substrate types along river orders.
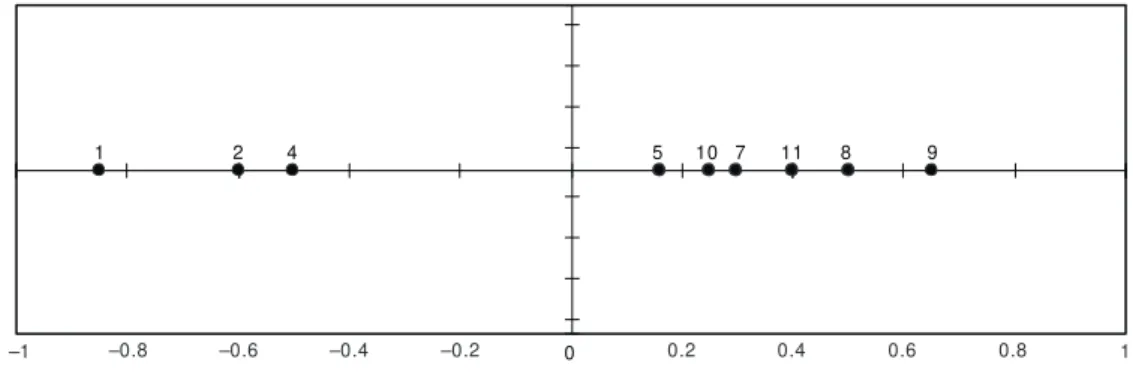
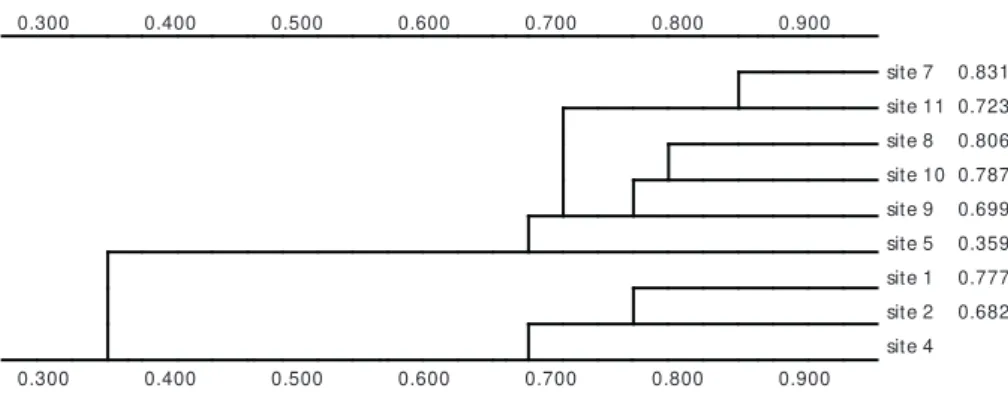
The CA was applied to the total matrices from all stations, the first axis was significant and presented a pattern of two distinct groups of stations, regardless of the degree of anthropogenic impact (Fig. 7). The Cluster Analysis, applied to the same set of data resulted in a similar pattern (Fig. 8).
DISCUSSION
& Pietrangelo, 1993). The great challenge is to distinguish both causes and identify where the rupture takes place along the river gradient.
A1 A2 A4 P1 P2 P4 F1 F2 F4 C1 C2 C4 A5 F5 C5 P5 C6 A6 F6 1.266 1.098 1.037 1.236 0.977 0.910 1.247 1.124 0.858 1.008 1.287 0.583 1.062 1.158 1.082 0.829 0.971 0.624 0.480 0.480 0.640 0.640 0.800 0.800 0.960 0.960 1.120 1.120 1.280 1.280 1.440 1.440
Fig. 5 — Cluster Analysis based on the different substrate type (A – sand; F – litter in pool areas; P – stones; C – lit-ter in riffle areas) using the similarity index of Morisita.
All the analysis performed confirmed the spatial distinction of the aquatic insect assemblages along the longitudinal gradient of Macaé River in two sections, with species replacement along the river profile. This replacement took place mainly at genus or species level. Unlike results presented by Jacobsen et al. (1997) for Ecuatorian rivers,
little reduction was observed both in the number of orders as well as in the number of families, with decreasing altitude. It is likely that difference is due to the high altitude of the stream groups chosen by those authors: 3,500-4,000 m for the first group, and 2,600-3,100 m for the second one. The third group (0-100 m) had a significantly higher number of orders and families of aquatic insects compared to the other two. Our results also show that the distinction between the two sections is a natural phenomenon in the structural organization of the aquatic insect assemblages.
That is dependent on the dominant physical processes in each river site. Moreover, although we recorded temporal changes in the abundance of specimens (with a decrease of specimens in the rainy period), there was neither a temporal repla-cement of the observed taxa nor a significant diffe-rence in richness at each station. This indicates temporal stability in the assemblage composition, as well as a high degree of resistance and recovery from environmental stress, since spate conditions exist in the summer (c.a. 2,000 mm rainfall).
Several works have reported a marked reduc-tion in the abundance of the aquatic fauna during rainfall periods, which agrees with our results. Arunachalam et al. (1991) and Flecker & Feifarek
(1994), working in India and in Andean rivers respectively, have found distinct temporal variations in the abundance of aquatic invertebrate assem-blages between dry and rainy periods, with great reduction in the abundance of invertebrates during periods of increased rainfall.
The upper section of the Macaé River is cha-racterized by substantial litter input from the sur-rounding forest and by many retention mechanisms such as fallen tree trunks and large pools. This section is a high gradient area, which according to Statzner et al. (1988) might be associated to
a higher hydraulic and geomorphological com-plexity. In this section therefore, there would be a prevalence of erosion against deposition pro-cesses. In the lower section this is reversed, the litter is more fragmented and covered by silt and sand, thus less available to colonization by the epibenthic fauna. Supporting this view, in the fifth order, there was a reduction of more than 50% in the number of taxa occupying the litter in pool areas compared to the upper section. In the sixth order, the input of litter in the river was small because of the great reduction in the surrounding forest. In addition, due to the great sedimentation pro-cesses, the retention devices are less frequent, characterizing an upper potamal region. Sheldon & Haick (1981), found that the change along the river gradient is explained by the distinction of erosional and depositional zones, as well as by the degree of leaf fragmentation.
Correspondingly, most taxa which contributed to the formation of the axes in the CAs were from two trophic functional groups: shredders (especially the caddisfly genera Triplectides, Phylloicus, Necto-psyche and Notalina) in the upper section, and
collectors (mainly the Simuliidae and Orthocladiinae, and the mayfly species Leptohyphes pereirae and Lachlania boanovae) in the lower section.
Moreover, results from the CCA, showed a higher amount of CPOM at stations in the upper section and FPOM at the lower one. Similar results were observed by Cushing et al. (1983) in the USA,
–1.2 –0.8
–0.3 –0.2 –0.1
–0.4 0 0.4 0.8 1.2 1.6 0.1 0.2 0.3
A1
A4 J4 J2 A2 3.0
2.5
2.0
1.5
1.0
0.5
0
–0.5
–1.0
–1.5
A6
J6
O5 A5
J5
Ca HCO3
H
D T
O4 O1
O2
pH CPOM EC J1
FPOM M g Cl
Axis 1
A
xi
s
2
0.5
0.4
0.3
0.2
0.1
0
–0.1
–0.2
0
06 V
0
1 2 4 5 10 7 11 8 9
–1 –0.8 –0.6 –0.4 –0.2 0.2 0.4 0.6 0.8 1
Fig. 6 — Canonical Correspondence Analysis based on the total matrices along the river orders (1, 2, 4, 5 and 6) of July
(J), August (A) and October (O); and 14 environmental parameters. EC – conductivity; O – dissolved oxygen; H – total hardness; D – discharge; V – velocity; T – water temperature.
Fig. 7 — Correspondence Analysis based on the total matrices of all stations sampled in the Macaé River watershed. leads to an increase in species that will utilize the
fine organic matter in suspension.
Illies (1969) reported that the lotic entomogical fauna from South America is composed of two ecologically distinct faunas: one group formed by oligostenothermal species (those adapted to low temperatures), and polistenothermal species, (those adapted to warmer conditions).
This point of view was confirmed in our study, since the majority of the Plecoptera and Trichoptera genera were mainly confined to the upper stations. Although the greatest species number for the Ephe-meroptera was found in the fourth order, some
species appeared with relatively high frequencies in the lower river section, such as Leptohyphes pereirae, Hylister plaumanni and Lachlania boa-novae.
The results presented here support some hy-potheses of the River Continuum Concept, proposed by Vannote et al. (1980). Among them was the
Illies (1964) pointed out that the distinction of the aquatic insect community in different rhithral and potamal faunas for rivers of about the same latitude as the Macaé River in the Southern Hemis-phere, would occur at about 800 m. According to Statzner & Higler (1986), the first hydraulic stress transition zone (change from low to high hydraulic stress) along a river also takes place at a similar altitude. Palmer et al. (1994), found a sharp break
along the Buffalo River between 1,120 m (the highest station) and 520 m (the second station). In the Macaé River, this transition occurred at a similar altitude, in the fourth order, which extends from 1,000 to 650 m high. However, Hynes (1971), working in Trinidad, found a major change in the faunal composition at an altitude of only 30 m, reflecting the difficulty in defining a common model for all streams.
The Macaé River is a tropical river with its sources located at relatively low altitude. Altitudinal gradients are not restricted then to high latitudes and/or high mountains (Palmer et al., 1994). This
fact has important consequences regarding faunistic conservation measures. Most of the preserved or legally protected areas of Atlantic Forest are res-tricted to the areas located in the first to second orders of river. Our results demonstrate the urgent need of conserving areas in the middle reach of the river, which present represent the highest taxo-nomic diversity.
Acknowledgments — The authors are grateful to Prof. Dr. Alcimar do Lago Carvalho (Museu Nacional, UFRJ), Prof. MSc. Rosalys Guahyba (UFRJ, Museu Nacional, in memoriam), Prof. MSc. Elidiomar Ribeiro da Silva (Unirio) and Prof. MSc. Nélson Ferreira Jr. (UFRJ), for identifying the specimens of Odonata, Trichoptera, Ephemeroptera and Coleoptera, respectively. The
authors are also extremely grateful to David and Isabel Miller for the useful help provided in the mountains of Macaé de Cima. This study was partially supported by grants provided by Fiocruz, CNPq, Faperj, FUJB and Capes.
REFERENCES
ARUNACHALAM, M., MADHUSOODANAN NAIR, K. C. M., VIJVERBERG, J., KORTMULDER, K. & SURIYANARAYANAN, H., 1991, Substrate selection and seasonal variation in densities of invertebrates in stream pools of a tropical river. Hydrobiologia, 213: 141-148. BENEDETTO, L., 1974, Clave para la determinación de los
Plecoptera sudamericanos. Stud. Neotrop. FaunaEnviron.,
9: 141-170.
BRUSSOCK, P. P. & BROWN, A. V., 1991, Riffle-pool geo-morphology disrupts longitudinal patterns of stream benthos. Hydrobiologia, 220: 109-117.
CULP, J. M. & DAVIES, R. W., 1982, Analysis of longitudi-nal zonation and river continuum concept in the Oldman-South Saskatchewan river system. Can. J. Fish. Aquat. Sci., 39: 1258-1266.
CUMMINS, K. W. & KLUG, M. J., 1979, Feeding ecology of stream invertebrates. Ann. Rev. Ecol. Syst., 10: 147-172. CUSHING, C. E., MCINTIRE, C. D., CUMMINS, K. W., MINSHALL, G. W., PETERSEN, R. C., SEDELL, J. R. & VANNOTE, R. L., 1983, Relationships among chemical, physical, and biological indices along river continua based on multivariate analyses. Arch. Hydrobiol., 98: 317-326.
DEAN, W., 1995, With broadax and firebrand: the destruc-tion of the Brazilian Atlantic Forest. University of
Cali-fornia Press, Berkeley.
DEATH, R. G. & WINTERBOURN, M. J., 1995, Diversity patterns in stream benthic invertebrate communities: the influence of habitat stability. Ecology, 76: 1446-1460.
DOMINGUEZ, E., HUBBARD, M. D. & PETERS, W. L., 1992, Clave para ninfas y adultos de las familias y generos de Ephemeroptera Sudamericanos. Biol. Acuat., 16: 5-39.
0.300
0.300
0.400
0.400
0.500
0.500
0.600
0.600
0.700
0.700
0.800
0.800
0.900
0.900
site 7 0.831 site 11 0.723 site 8 0.806 site 10 0.787 site 9 0.699 site 5 0.359 site 1 0.777 site 2 0.682 site 4
DOMINGUEZ, E. & BALLESTEROS VALDEZ, J. M., 1992, Altitudinal replacement of Ephemeroptera in a subtropical river. Hydrobiologia, 246: 83-88.
DUDGEON, D., 1993a, The effects of spate-induced distur-bance, predation and environmental complexity on macroinvertebrates in a tropical stream. Freshwat. Biol.,
30: 189-197.
DUDGEON, D., 1993b, Ordination made not particularly difficult. Porcupine Spec. Suppl., 1: 1-7.
FLECKER, A. S. & FEIFAREK, B., 1994, Disturbance and the temporal variability of invertebrate assemblages in two Andean streams. Freshwat. Biol., 31: 131-142.
FROEHLICH, C. G., 1984, Brazilian Plecoptera 4. Nymphs of perlid genera from South-eastern Brazil. Ann. Limnol.,
20: 43-48.
HYNES, H. B. N., 1970, The ecology of stream insects. Ann. Rev. Entomol., 15: 25-42.
HYNES, H. B. N., 1971, Zonation of the invertebrate fauna in a West Indian stream. Hydrobiologia,38: 1-8.
ILLIES, J., 1964, The invertebrate fauna of Huallaga, a Peruvian tributary of the Amazon River, from the sources down to Tingo Maria. Verh. Int. Verein. Limnol.,15: 1077-1083.
ILLIES, J., 1969, Biogeography and ecology of Neotropi-cal freshwater insects, especially those from running waters. In:Fittkau et al. (eds.), Biogeography and Ecolo-gy in South America. The Hague, Vol. 2, pp. 685-707. JACOBSEN, D., SCHULTZ, R. & ENCALADA, A., 1997,
Structure and diversity of stream invertebrate assem-blages: the influence of temperature with altitude and latitude. Freshwat. Biol., 38: 247-261.
KOHLER, S. L., 1992, Competition and the structure of a benthic stream community. Ecol. Monog., 62: 165-188. MERRITT, R. W. & CUMMINS, K. W. (eds.), 1988, An in-troduction to the aquatic insects of North America. 2nd ed.
Kendall – Hunt Pub. Co., Dubuque, Iowa, 722p. NAIMAN, R. J., MELILLO, J. M., LOCK, M. A., FORD, T.
E. & REICE, S. R., 1987, Longitudinal patterns of eco-system processes and community structure in a subarctic river continuum. Ecology, 68: 1139-1156.
PALMER, C., PALMER, A., O’ KEEFE, J. & PALMER, R., 1994, Macroinvertebrate community structure and alti-tudinal changes in the upper reaches of a warm temperate Southern African River. Freshwat. Biol., 32: 337-347.
RABENI, C. F. & MINSHALL, G. W., 1977, Factors affect-ing micro-distribution of stream benthic insects. Oikos, 29: 33-43.
RAE, J. G., 1985, A multivariate study of resource parti-tioning in soft bottom lotic Chironomidae. Hydrobiolo-gia, 126: 275-285.
REICE, S. R., 1980, The role of substratum in benthic macroinvertebrate micro-distribution and litter decompo-sition in a woodland stream. Ecology, 6: 580-590.
ROHLF, J. F., 1992, NTSYS-pc. Numerical Taxonomy and Multivariate Analysis System. Exeter Software, New York.
ROSSARO, B. & PIETRANGELO, A., 1993, Macroinver-tebrate distribution in streams: a comparison of Ca ordina-tion with biotic indices. Hydrobiologia, 263: 109-118.
SHELDON, A. L. & HAICK, R. A., 1981, Habitat selection and association of stream insects: a multivariate analysis.
Freshwat. Biol., 11: 395-403.
SIEGFRIED, C. A. & KNIGHT, A. W., 1977, The effects of a washout in a sierra foothill stream. Am. Midl. Nat., 98:
200-207.
STATZNER, R. B. & HIGLER, B., 1985, Questions and comments on the river continuum concept. Can. J. Fish. Aquat. Sci., 42: 1038-1044.
STATZNER, R. B. & HIGLER, B., 1986, Stream hydraulics as a major determinant of benthic invertebrate zonation patterns. Freshwat. Biol., 16: 127-139.
STATZNER, R. B., GORE, J. A. & RESH, V. H., 1988, Hy-draulic stream ecology: observed patterns and potential applications. J. N. Amer. Benthol. Soc., 7: 307-360.
TER BRAAK, C. J. F., 1986, Canonical Correspondence Analysis: a new eigenvector technique for multivariate direct gradient analysis. Ecology,67: 1167-1179. TRIVINHO-STRIXINO, S. & STRIXINO, G., 1995, Larvas
de Chironomidae do Estado de São Paulo: guia de identificação e diagnose dos gêneros. São Carlos,
PPG-ERN, UFSCar, 299p.
VANNOTE, R. L. & SWEENEY, B. W., 1980, Geographic analysis of thermal equilibria: a conceptual model for evaluating the effect of natural and modified thermal regimes on aquatic insect communities. American. Natu-ralist., 115: 667-695.
VANNOTE, R. L., MINSHALL, G. W., CUMMINS, K. W., SEDELL, J. R. & CUSHING, C. E., 1980, The river continuum concept. Can. J. Fish. Aquat. Sci., 37: 130-137.
VERDONSCHOT, P. F. M., 1990, Ecological characteriza-tion of surface water in the province of Overijssel (the Netherlands). Rep. Res. Inst. Nature Management Leer-sum, 255p.
WARD, J. V. & STANFORD, J. A., 1982, Thermal responses in the evolutionary ecology of aquatic insects. Ann. Rev. Entomol., 27: 97-117.
WINTERBOURN, M. J., ROUNICK, J. S. & COEWIE, B., 1981, Are New Zealand stream ecosystems really diffe-rent? New Zealand J. of Marine Fresh. Res.,15:321-328.
ZAR, J. H., 1996, Biostatistical Analysis. Prentice Hall, New