A Co-authorship network analysis of
CNPq’s productivity research fellows in
the probability and statistic area
Filipe Costa de Souza
Doutor em Economia pela Universidade Federal
de Pernambuco. Professor Adjunto do
Departamento de Ciências Contábeis e Atuariais, Universidade Federal de Pernambuco, Recife- PE.
Raabe Marques Amorim
Mestre em Estatística pelo Programa de Pós-Graduação em Estatística da UFPE, Recife-PE.
Leandro Chaves Rêgo
Ph.D em Engenharia Elétrica e de Computação pela Cornell University. Professor Associado do
Departamento de Estatística e Matemática
Aplicada, Universidade Federal do Ceará,
Fortaleza-CE.
http://dx.doi.org/10.1590/1981-5344/2537
In this paper, we analyzed the co-authorship network between all CNPq’s productivity research fellows in the Probability and Statistics area in Brazil. Our aim was to describe and to understand how network measures influence researchers’ productivity. The data was gathered from the CNPq’s Lattes Platform using the software scriptLattes, and a link between two fellows represents the fact that they wrote an article together from 2009 to 2013. The network is disconnected and has only 4.7% of its possible connections. Through a regression analysis, we were able to infer that the centrality positions of an author matters to his/her productivity. As expected, closeness centrality had a negative effect on fellows’ productivity, while the degree centrality had a positive effect.
Keywords: social network analysis; scientific
Uma análise de rede de coautoria dos
bolsistas de produtividade do CNPq na
área de probabilidade e estatística no
Brasil
Neste artigo. Nós analisamos a rede de coautoria entre todos os bolsistas de produtividade do CNPq na área de probabilidade e estatística no Brasil. Nosso objetivo foi descrever e entender como medidas da rede influenciam na produtividade dos pesquisadores. A base de dados foi coletada do Plataforma Lattes do CNPq utilizando o programa scriptLattes, e uma ligação entre dois bolsistas representa o fato deles terem escrito um artigo juntos no período de 2009 à 2013. A rede é desconexa e tem apenas 4,7% das possíveis conexões. Por meio da análise de regressão, fomos capazes de inferir que as posições de centralidade de um autor importam para a produtividade dele ou dela. Como esperado, a centralidade de proximidade teve um efeito negativo na produtividade do bolsista, enquanto a centralidade de grau teve um efeito positivo.
Palavras-chave: análise de redes sociais; desempenho
científico; coautoria; probabilidade e estatística.
Recebido em 10.09.2015 Aceito em 30.09.2016
1 Introduction
Throughout the science history, the statistical reasoning made (and still makes) an important role in knowledge development and spreads itself through all fields of science. The achievement of this level was only possible by means of collective activity. How to forget the famous letters between Pascal and Fermat, that are one of the pillars of the modern probability theory; or the intense academic debate around Fisher’s and Neyman-Pearson’s ideas.
Sociology (KRONEGGER; FERLIGOJ; DOREIAN, 2011), Nanoscience, Pharmacology and Statistics (BORDONS et al., 2015), Electrical Engineering, Information Processing, Polymer Science and Biochemistry (YOSHIKANE and KAGEURA, 2004) and Medical (YOUSEFI-NOORAIE et al., 2008) juts to cite a few. A survey on co-authorship networks could be found on Glänzel and Schubert (2004) and Kumar (2015).
SNA is also important for those interested in research performance, because there are evidences that nodes position in a co-authorship network plays an important role in author productivity (BORDONS et al., 2015). Moreover, scientists, research centers and universities are frequently evaluated by their performance. More productive scientists have higher chance of getting promotions, funding to their projects, of attracting sponsors etc. Therefore, the academic community keeps this issue constantly in mind.
The National Council for the Development of Science and Technology (CNPq) is the main Brazilian funding agency devoted to researcher support. This paper deals with co-authorship network among CNPq’s Research Productivity Fellows in the area of Probability and Statistic in Brazil. Moreover, we also investigate how network measures influence researchers’ productivity. Our interest in this particular group of scientists came from two main reasons: (i) firstly, to our knowledge, there are few and recent social network studies about the probability and statistic community, and none about Brazilians researchers in this area (BORDONS
et al., 2015; DE STEFANO et al., 2013 and SAID; WEGMAN; SHARABATI, 2010); (ii) secondly, CNPq’s fellows are a select group of high quality scientists and their leadership guide and promote the advance of science in Brazil. Therefore, to study how this elite group interacts could allow a better understanding on how statistical knowledge is constructed and diffused in Brazil.
To achieve our goals, the remainder of the paper is organized as follows: in Section 2 and 3, we make a brief explanation about the Lattes Platform and the CNPq’s Research Productivity Fellows, respectively. In Section 4, we present the literature review, exploring related works about co-authorship networks and research performance, especially regarding to the probability and statistic area. In Section 5, we discuss about the data selection and methodological aspects of the study. Section 6 is devoted to the co-authorship network analysis. In Section 7, we study, by means of a regression model, how network measures influence authors’ productivity. In Section 8, we present the conclusions of the paper.
2 The Lattes Platform
In a Lattes CV, the researcher can express his or her educational background, researches interest, professional/academic experience, grants and awards, publications, projects and patents (i.e., scientific, technologic and artistic and cultural productions in general), academic advising, events participation and/or organization, participation in examination committees etc. Moreover, each Lattes CV is associated to an exclusive code (the ID Lattes) that prevents problems in researcher identification such as homonymous names etc. The CNPq’s experience with the Lattes Platform is considered an example of good practices in academic life registration, as stated by Lane (2010).
In 2009, Mena-Chalco and Cesar Jr. (2009) developed an open-source software to extract academic information from Lattes Platform. This program has modules of redundancy treatment, network graph generation, researchers map generation based on geographical information, and publications reports.
Due to the large amount of information available, the technological support and the reliability and the standardization of the records, the Lattes Platform has been used as data source for many academic studies in the field of Bibliometrics and Social Networks in Brazil, such as: Mena-Chalco and Cesar Jr. (2009), Arruda et al. (2009), Oliveira et al. (2012), Souza and Ferreira (2013), Wainer and Vieira (2013), Alves, Yanasse and Soma (2014), Mena-Chalco et al. (2014), Digiampietri et al. (2014) and Tuesta et al. (2015).
3 The CNPq’s Productivity Research Fellows
The CNPq has a particular modality of grant called productivity fellowship, which is divided in five levels, named 1A, 1B, 1C, 1D e 2, being 1A the highest one and the 2 the lowest one. The scholarships have 60 months of duration for the level 1A, 48 months for 1B to 1D, and 36 months for the level 2. The number of scholarships is almost fixed for each scientific field and for each level. Therefore, in a given field, for a researcher to ascend a fellowship level or to become a new fellow, it is likely that another fellow either descended a level or lost his or hers scholarship. Wainer and Vieira (2013) studied what influences the decisions of CNPq’s grant commissions to increase, to maintain or to decrease the researchers’ scholarship level in 55 scientific areas established by CNPq itself.
Moreover, to renovate the scholarship or demand a new one, the researcher needs to send a proposal to be evaluated by the CNPq. Together with the proposal, s/he should also submit her/his Lattes CV, which is evaluated quantitative and qualitatively, especially regarding the past 5 years. It is worth noting that to apply for a grant, the researcher must have received his/her Ph.D. degree at least three years ago.
information science area. Alves, Yanasse and Soma (2014) devoted their studied to the Chemistry area. Arruda et al. (2009) analyzed the profile of academic professors in 44 computer science graduate courses in Brazil. The authors sought to investigate faculty characteristics such as research interest, CNPq’s productivity grants, publication, and the distribution of these characteristics according to Brazilian’s regions and gender. Oliveira
et al. (2012) analyzed if the CNPq’s fellows rank in medicine is consistent with researchers’ productivity.
4 Related works
For over six decades, scientists have been analyzing changes in publications trends. In the early 1950’s, Alexander (1953) already indicates a shift in the research paradigm from the individual researcher to research groups, especially for experimental fields that demand multidisciplinary knowledge and made use of big laboratories. Following this line, Melin and Persson (2000) affirm that collaboration among scientists and research centers are becoming almost a prerequisite for modern science. Moreover, Laurence (2003) also highlights that scientists are awarded by the police of how many and, therefore, they tend to focus on the number of paper they can produce. Laurence (2003) states that authors are slicing their articles as thin as salami to fit themselves in this
publish or perish world, and that two papers worth twice as much as one, even when the second is destined to correct the first.
This paradigm shifting may put some philosophical and ethical questions in perspective: What could be considered as research collaboration? (KATZ; MARTIN, 1997); how to define co-authorship? (CARNEIRO; CANGUSSÚ; FERNANDES, 2007) etc. However, it also leads our eyes for the search of the understanding on how co-authorship influences productivity and/or academic and scientific achievements? To try to answer this question, scientists work in academic performance studies, which are largely beneficiated from SNA.
Yousefi-Nooraie et al. (2008) used co-authorship networks of three Iranian Medical academic research centers to study its scientific productivity (articles written in English). As a result, they found that centers with denser, more decentralized networks and that are more open to outside connections had better scientific outcomes.
Abbasi, Altmann and Hossain (2011) studied how network measures influence citation performance (g-index) in the Information Systems area. As a result, authors found that the g-index was positively correlated with the normalized degree centrality, efficiency, and average link strength, and negatively correlated with the normalized eigenvector centrality. Cimenler, Reeves and Skvoretz (2014), on the other hand, found that the
eigenvector centrality had a positive impact on scientist’s performance (h-index).
obtain more money is to collaborate with different physicists over the years. This characteristic was more important than to have a lot of connections or even work at a large University.
Bales et al. (2014) studied how co-authorship is associated with publication in high (or low) impact journals (based on journal impact rank). The authors inferred that the professional position of the co-authors in a partnership was related with the impact rank of the publication. For example, the partnership between two professors or a professor and a research scientist are associated with publications in high-impact journals, while the partnership between two post-doctorate students was associated with low-impact journals.
Concerning the probability and statistic field, some works are highlighted: De Stefano, Giordano and Vitale (2011) studied the co-authorship network in four fields (Physics, Engineering, Arts & Humanities and Economics & Statistics) based on academic working at the Italian university of Salerno. De Stefano et al. (2013) studied the co-authorship network among Italians statisticians based on three different publications data sources. As a result, they detected the small-world structure of the network and for some statistic subfields they also found evidences that the authors seem to behave as if they are guided by a scale-free distribution. Furthermore, the general idea of positive association between statisticians’ performance (h-index) and their central positions in the network was confirmed.
Bordons et al. (2015) studied three co-authorship networks (Nanoscience, Pharmacology and Statistics) in Spain during 2006 to 2008, to analyze the trends in each field and if network measures influence the co-authors performance (g-index). The authors found that the network of the Statistic field was less dense and less connected than the others. Moreover, the benefits (in terms of g-index) from the author position in the network were smaller in the Statistic field too.
Said, Wegman and Sharabati (2010) studied preferential attachment in co-authorship networks. To do so, the article had two stages: firstly, authors focused on statisticians working in prominent American Universities and secondly, they turned attention to the biopharmaceutical subfield. The data was collected from Current Index to Statistics. However, even studying a co-authorship network (half-part of our interest), this article was not devoted to scientific performance analysis (the other half). So, to our knowledge, there is no paper studying the probability and statistic co-authorship network in Brazil, especially regarding to scientific performance issues.
The reader interested in a survey on co-authorship networks and the correlation between centrality measures and academic productivity will benefits from the reading of Kumar (2015).
5 Data and Methods
the area of Probability and Statistic in Brazil?; How the scholarship level influences some author-metrics? and Which and how network measures influence the scientific productivity (number of papers) of these fellows? To answer those questions, we describe our analysis in three steps: the data; the co-authorship network analysis; and the statistical procedures.
The Data
The data selection had three steps: researchers identification, data collection and errors checking. First, the list of all CNPq’s Productivity Research Fellows in the Probability and Statistic Area was gathered from the CNPq’s official website1 in February of 2014, and considered only the researchers with active grant. This list contains the name of 68 fellows.
After that, the list of all publications in academic journals (from 2009 to 2013), of those 68 researchers, were extracted from theirs Lattes CV using the scriptLattes. This five years range was adopted because in 2013 the CNPq updated all its fellowship levels. Moreover, the decision to give, to withdraw, to increase, to decrease or to maintain the scholarship level is mostly based on a researcher’s academic performance in the past five years, especially the productivity (articles published) (WAINER; VIEIRA, 2013).
To avoid the double count of a publication or missing cases in the network construction, the scriptLattes has a redundancy treatment module. In this module, all papers from a given year and with the same type (paper published in academic journals or paper accepted but not published yet, for example) are compared pairwise. This module counts as a single paper if two publications have 92% (or more) of similarity in their titles (MENA-CHALCO; CESAR JR., 2009). This percentage can be adjusted if desired. When adjusting such rate, one must be careful since if the similarity rate is too high, then typos may lead the same paper to be counted more than one time. On the other hand, if the similarity rate is too low, it may not distinct two different papers (that chances only by a distribution name, for example).
However, this redundancy treatment module has the follow limitation. In a paper written by two or more co-authors, if, by mistake of one of them, they indicate in their own Lattes CV different publications date or different types of publication, then the module counts the same paper as if it were two different ones.
To overcame these limitations, a small change in the scriptLattes code was made to allow the software to compare all papers (despite of year or type) to find double counting. Moreover, a manual count was also made do cheek other possible errors.
1
The Network Analysis
In possession of the data, we used the software Gephi to draw the graph and to calculate some metrics based on the network topology. Initially, we considered the co-authorship network as an undirected weighted graph, where the weight of a link represents the number of papers that two fellows authored. Formally, an undirected weighted co-authorship network, G, is a pair G = (N, m), where N = {1, …, n} is a finite set of nodes (authors) and m is a matrix, in which mij represents the weighted relation (number of papers written together) between authors i and j, with mij = mji (JACKSON, 2008).
Based on the graph topology, we are able to calculate some global-level and node-global-level metrics for the network (DE STEFANO; GIORDANO; VITALE, 2011). However, De Stefano et al. (2013) highlight that there is a trend to calculate the measures based on the non-weighted version of the graph. So, to transform a weighted graph to a non-weighted one, we shall simply to set all values in m that are greater than zero to one. As De Stefano et al. (2013), we will follow this approach in the metrics calculation, with the exception of the utility (SANTOS, 2014), since this is a new metric that was recently proposed in the literature.
The following metrics2 were used in this study:
Total number of links: a link indicates that two authors are co-authors. Therefore, the total number of links indicates the total number of co-authorship relations existing in the network.
Degree of a node (or Degree Centrality): is the number of ties involving that node, i.e., indicates the number of co-author of a given author.
Average degree: is the sum of the degree of each node in the network divided by the number of nodes.
Density: indicates how close the graph is to be complete, i.e., is the total number of links divided by the maximum possible number of links in that graph.
Diameter: is the maximum geodesic distance between any two nodes in the network. If the network is disconnected, then, the diameter of the network will be the biggest one among the diameters of each network component.
Eccentricity of a node: is the larger distance from that note to any other node in the network. If the network is disconnected, the eccentricity is calculated based on the component that the node is inserted in.
Size of component: is the total number of nodes in a given component.
Betweenness Centrality: is the number of shortest paths that contain a given node.
Closeness Centrality: is the average distance between a given node and all others nodes in its component.
2
Eigenvector Centrality: measures the relative importance of a node, given the importance of the nodes that it is connected with.
Cluster coefficient: is the proportion of the co-authors of a given author who also have a direct link between them (LATAPY, 2008). The average cluster coefficient of a network is the mean value of the cluster coefficient of its nodes. Together with the mean shortest path length, it may indicate a small-world effect.
Utility: In the study of co-authorship networks, Santos (2014) proposed a metric to evaluate the benefit or utility for a given author to be in a particular position in a network. The idea is that an author has a finite amount of time to dedicate to scientific collaborations and, therefore, each author receives an utility from a link with his co-authors that is equal to the proportion of papers that such co-author has with him plus a synergy term that is given by the product of the effort each co-author puts in the collaboration. Formally, co-author i’s utility Ui(G) in a graph G is given by
,
where nij is the link strength between authors i and j and .
The statistical procedures
To understand if the scholarship level influences the author-metrics we will use the Kruskall-Wallis test, where the author-metrics will be the dependent variables and the scholarship level will be the grouping variable.
To explore how changes in the co-authorship network measures contribute to explain changes in the CNPq’s fellows performance we used a Multiple Linear Regression Model. Initially, seven local-level measures were selected to be the predictor variables: Degree Centrality (DC); Betweennes Centrality (BC); Closeness Centrality (CC); Eigenvector Centrality (EG); Eccentricity (EC); Cluster Coefficient (CL) and Utility (UT). The total number of articles (AT) published from 2009 to 2013 was select as the response variable. Therefore, we adjusted the following
model: , where t =
1, …, 68 and ’s are i.i.d. ~ N(0,σ2).
6 The Co-authorship Network
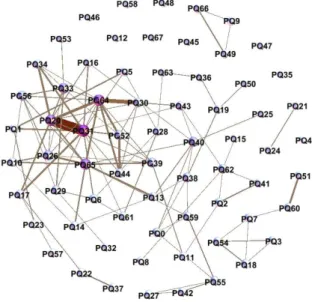
a link between two nodes is proportional to the number of articles written in co-authorship between them.
Figure 1 - The co-authorship network
Source: prepared by the authors.
As one can see, the network is a disconnected graph with 13 components. The giant component contains 48 nodes (70.59%) and the second largest component has only 6 nodes (8.82%). Moreover, the graph has 9 isolated components (13.24%). The node’s degrees range from 0 to 13, with an average of 3.15. The best scale-free distribution that fits the nodes’ degrees of the network has exponent α=3.16.
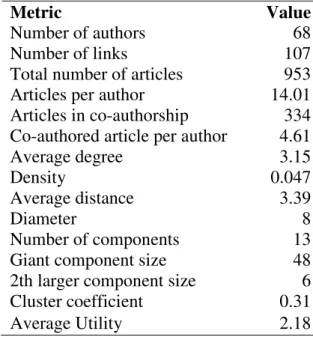
Table 1 - Summary statistic for the co-authorship network
Metric Value
Number of authors 68
Number of links 107
Total number of articles 953 Articles per author 14.01 Articles in co-authorship 334 Co-authored article per author 4.61
Average degree 3.15
Density 0.047
Average distance 3.39
Diameter 8
Number of components 13 Giant component size 48 2th larger component size 6 Cluster coefficient 0.31
Average Utility 2.18
Source: prepared by the authors.
Table 2 presents the Top 10 fellows with respect to two productivity measures (AT and AC), four central position network measures (DC, BC,
CC and EG) and the network metrics CL and UT. In each column, the fellow label, the corresponding metric value and his/her scholarship level are shown. Four researchers (PQ31, PQ20, PQ64 and PQ65) appear in almost all Top 10 list presented in Table 2, and therefore, they deserved to be highlighted. The PQ31 occupies the first position in six lists and, therefore, he can be considered the most influential fellow in the network, and the one who benefits most from the collaborations. He has the impressive mark of 132 articles published in this five-year period (an average of 26.4 papers per year or 2.2 papers per month). Moreover, it can also be seen that fellows with the highest CL generally form small groups that work in a specific subfield, especially in the probability area, and sometimes they held an advisor-advisee relationship where a level 1 fellow advised a level 2, such as PQ66-PQ09 (that work with percolation models) and PQ42-PQ27 (that work with stochastic process applied to bioinformatics), for example.
Table 2 - Top 10 fellows with respect to AT, AC, DC, BC, CC, EG, CL and
UT
AT AC DC CC
PQ31 132 (1A) PQ31 82 (1A) PQ31 13 (1A) PQ31 2.36 (1A)
PQ20 86 (1D) PQ20 78 (1D) PQ64 11 (2) PQ20 2.43 (1D) PQ30 72 (1B) PQ64 50 (2) PQ20 10 (1D) PQ64 2.47 (2) PQ43 70 (1B) PQ65 39 (2) PQ65 10 (1D) PQ65 2.47 (1D)
PQ64 50 (2) PQ12 38 (1B) PQ33 8 (1B) PQ43 2.53 (1B)
PQ65 48 (1D) PQ30 26 (1B) PQ26 7 (2) PQ40 2.62 (1B) PQ17 47 (1D) PQ52 20 (2) PQ40 7 (1B) PQ16 2.66 (2) PQ39 46 (1A) PQ33 15 (1B) PQ39 6 (1A) PQ39 2.77 (1A) PQ12 38 (1B) PQ01 14 (2) PQ52 6 (2) PQ26 2.79 (2) PQ52 34 (2) PQ17 14 (1D) PQ56 6 (2) PQ52 2.85 (2)
BC EG CL UT
PQ31 360.02 (1A) PQ64 1.00 (2) PQ66 1.00 (1B) PQ31 5.41 (1A)
PQ65 250.00 (1D) PQ20 0.88 (1D) PQ49 1.00 (1A) PQ65 4.73 (1D) PQ43 223.42 (1B) PQ31 0.78 (1D) PQ42 1.00 (1A) PQ62 3.97 (1D) PQ40 212398 (1B) PQ65 0.73 (1D) PQ41 1.00 (2) PQ20 3.90 (1D) PQ62 152.66 (1D) PQ26 0.69 (2) PQ27 1.00 (2) PQ64 3.60 (2)
PQ20 149.17 (1D) PQ33 0.68 (1B) PQ9 1.00 (2) PQ55 3.60 (1C) PQ38 115.11 (2) PQ39 0.58 (1A) PQ3 1.00 (2) PQ19 3.54 (1B) PQ59 106.93 (2 PQ52 0.57 (2) PQ44 0.83 (1C) PQ54 3.41 (2)
PQ64 89.49 (2) PQ56 0.55 (2) PQ34 0.83 (2) PQ40 3.40 (1B) PQ19 82.86 (1B) PQ32 0.49 (2) * PQ60 3.27 (1B)
* Five researchers obtained CL=0.67, were they PQ10 (2), PQ14 (2), PQ18 (1A), PQ54 (2) and PQ61(1B).
Source: prepared by the authors.
Finally, to analyze if the scholarship level influences the author-metrics we used the Kruskall-Wallis test and, as said, the network author-metrics are the dependent variables and the scholarship level is the grouping variable. On the data, there are 37 (54.41%) fellows with scholarship level 2, 9 fellows with scholarship level 1D, 13 fellows with scholarship level 1C, 4 fellows with scholarship level 1B and 5 fellows with scholarship level 1A. Once some scholarship levels have only few observations, we decided to group all fellows in level 1 (1A, 1B, 1C and 1D).
Figure 2 shows the Box-plots to each case under study, and one can see that the only statistically significant difference (at the 5% level) between level 1 and level 2 fellows was with respect to AT. As expected, level 1 researchers had a median productivity higher than those on level 2.
between these groups. In the next section, we analyze how the network metrics influence AT.
Level 2 Level 1
Scholarship level -2 0 2 4 6 8 10 12 14 D C
Level 2 Level 1
Scholarship level -20 0 20 40 60 80 100 120 140 A T
(a) DC: KW-H(1;68) = 0,173; p = 0,6774 (b) AT: KW-H(1;68) = 8,9253; p = 0,0028
Level 2 Level 1
S cholarship level -1 0 1 2 3 4 5 6 C C
Level 2 Level 1
Scholarship level -1 0 1 2 3 4 5 6 C C
(c) EC: KW-H(1;68) = 1,4952; p = 0,2214 (d) CC: KW-H(1;68) = 2,5195; p = 0,1124
Level 2 Level 1
Scholarship level -1 0 1 2 3 4 5 6 7 8 9 E C
Level 2 Level 1
Scholarship level -0,2 0,0 0,2 0,4 0,6 0,8 1,0 1,2 E G
Level 2 Level 1 Scholarship level
-0,2 0,0 0,2 0,4 0,6 0,8 1,0 1,2
C
L
Level 2 Level 1
Scholarship level 0,5
1,0 1,5 2,0 2,5 3,0 3,5 4,0 4,5 5,0 5,5 6,0
U
T
(g) CL: KW-H(1;68) = 0,9406; p = 0,3321 (h) UT: KW-H(1;68) = 1,798; p = 0,1800
Figure 2 - Box-plot
Source: prepared by the authors.
7 Modeling Research Productivity
To study how changes in local-level measures contribute to explain changes in the co-authors performance we used a Multiple Linear Regression Model. Seven measures were selected to be the predictor variables, while the total number of papers published from 2009 to 2013 was select as the response variable. To avoid multicolinearity, we used the Spearman’s rank correlation to exclude some high correlated ( , and p-value < 0.05) variables from the model. The results are exposed in Table 3. Therefore, three variables were excluded from the model: Eccentricity (EC), Eigenvector Centrality (EG) and Betweenness Centrality (BC). After excluding these high correlated variables, using a QQPlot shown in Graphic 1, it was verified that the assumption of normality of residuals was violated.
Table 3 - Spearman’s rank correlation
DC AT EC CC BC EG CL UT
DC 1 0.56* 0.22 0.11 0.85* 0.90* 0.54* 0.61*
AT 1 -0.06 -0.21 0.56* 0.47* 0.13 0.44*
EC 1 0.93* 0.20 0.37* 0.02 0.18
CC 1 0.11 0.25* 0.02 0.14
BC 1 0.77* 0.17 0.56*
EG 1 0.43 0.39*
CL 1 0.28*
UT 1
*p-value<0.05
Graphic 1 - QQPlot
Source: prepared by the authors.
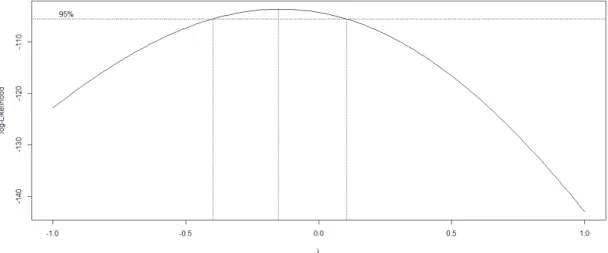
For that reason, a Box-Cox test was used to transform the response variable. The Box-Cox transformation of a variable Y is defined as:
,
where is the power parameter to be estimated, and as , . The log-likelihood of the power parameter is shown in Graphic 2. Since the zero is in the 95% confidence interval for , the natural logarithm transformation is appropriated.
Graphic 2 - Log-likelihood of the power parameter in the Box-Cox transformation
As a result, a logarithm transformation was made, resulting in a
log-linear model: , with t = 1, …, 68. In
order to keep the model as simple as possible, we proceeded with a variable selection via backward stepwise based on the lowest Akaike Information Criterion (AIC) (AKAIKE, 1974), and we also removed the observation PQ31, since it was an influential point according to the Bonferroni test (WEISBERG, 2005). Consequently, the best model found had the DC and CC as predictor variables: , with t = 1, …, 67.
The report of the results is made in Table 4. The R squared was 0.494, i.e., 49.4% in the change in logAT was explained by changes in only two centrality measures. Moreover, a one-unit increase on DC implies an expected increase in AT of approximately 23%, and a one-unit increase on CC produce an expected decrease in AT of approximately 11%. Thus, as expected, one can conclude that to maintain partnership with many fellows and to have short paths to them is a good strategy to improve researcher productivity.
Table 4 - Model summary
Estimation Standard error p-value
Intercept 2.218 0.159 0.000*
DC 0.203 0.026 0.000*
CC -0.122 0.05 0.019*
*p-value<0.05
Source: prepared by the authors.
8 Conclusions
In this article, we investigated three main questions: What is the profile of the community of CNPq’s Research Productivity Fellows in the area of Probability and Statistic in Brazil? How the scholarship level influences the author-metrics? and which and how network measures influence the scientific productivity (number of papers) of these fellows?
By the Kruskall-Wallis test, it was shown that the only statistically significant difference (at the 5% level) between level 1 and level 2 fellows was with respect to AT. Where, as expected, level 1 researchers had a median productivity higher than those on level 2.
Moreover, through a regression analysis, we were able to infer that the centrality position of an author matters to his/her productivity. The closeness centrality had a negative effect of about 11% on the fellows’ productivity while the degree centrality had a positive effect of about 23%.
For a future work, we intend to expand the list of researchers evaluated considering all researchers in Brazil (CNPQ’s Fellows or not) who claim to work in the area of probability and statistics, and analyze if these trends remain.
References
ABBASI, A.; ALTMANN, J.; HOSSAIN, L. Identifying the effects of co-authorship networks on the performance of scholars: a correlation and regression analysis of performance measures and social network analysis measures. Journal of Informetrics, v. 5, n. 4, p. 594-607, 2011.
AKAIKE, H. A new look at the statistical model identification. IEEE Transactions on Automatic Control, v. 19, n. 6, p. 716–723, 1974.
ALEXANDER, R. S. Trends in authorship. Circulation Research, v. 1, n. 4, p. 281-283, 1953.
ALVES, A. D.; YANASSE, H. H.; SOMA, N. Y. Profile of CNPq productivity research fellows in the chemistry area based on the lattes platform.
Química Nova, v. 37, n. 2, p. 377-383, 2014.
ARRUDA, D. et al. Brazilian computer science research: gender and regional distributions. Scientometrics, v. 79, n. 3, p. 655-669, 2009. BALES, M. E. et al. Associating co-authorship patterns with publications in high-impact journals. Journal of Biomedical Informatics, v. 52, p. 311-318, 2014.
BELLOTTI, E. Getting funded. multi-level network of physicists in Italy.
Social Networks, v. 34, n. 2, p. 215-229, 2012.
BORDONS, M. et al. The relationship between the research performance of scientists and their position in co-authorship networks in three fields.
Journal of Informetrics, v. 9, n. 1, p. 135-144, 2015.
CARNEIRO, M. A. A.; CANGUSSÚ, S. D.; FERNANDES, G. W. Ethical abuses in the authorship of scientific papers. Revista Brasileira de Entomologia, v. 51, n. 1, p. 1-5, 2007.
DE STEFANO, D. et al. The use of different data sources in the analysis of co-authorship networks and scientific performance. Social Networks, v. 35, n. 3, p. 370-381, 2013.
DE STEFANO, D.; GIORDANO, G.; VITALE, M. P. Issues in the analysis of co-authorship networks. Quality & Quantity, v. 45, n. 5, p. 1091-1107, 2011.
DIGIAMPIETRI, L. A. et al. BraX-Ray: an X-Ray of the brazilian computer science graduate programs. Plos One, v. 9, n. 4, p. e94541, 2014.
GLÄNZEL, W.; SCHUBERT, A. Analyzing scientific networks through co-authorship. In: MOED, H. F. et al. Handbook of quantitative science and technology research. Dordrecht: Kluwer Academic Publisher, 2004. p. 257-276.
JACKSON, M. O. Social and economic networks. Princeton: Princeton University Press, 2008.
KATZ, J. S.; MARTIN. B. R. What is research collaboration? Research Policy, v. 26, p. 1-18, 1997.
KRONEGGER, L.; FERLIGOJ, A.; DOREIAN, P. On the dynamics of national scientific systems. Quality & Quantity, v. 45, n. 5, p. 989-1015, 2011. KUMAR, S. Co-authorship networks: a review of the literature. Aslib Journal of Information Management, v. 67, n. 1, p. 55-73, 2015.
LANE, L. Let’s make science metrics more scientific. Nature, v. 464, p. 488-489, 2010.
LATAPY, M. Main-memory triangle computations for very large (sparse (pawer-law) graphs. Theoretical Computer Science, v. 407, n. 1-3, p. 458-473, 2008.
LAWRENCE, P. A. The politics of publication. Nature, v. 422, p. 259-261, 2003.
MELIN, G.; PERSSON, O. Studying research collaboration using co-authorships. Scientometrics, v. 36, n. 3, p. 363-377, 1996.
MENA-CHALCO, J. P. et al. Brazilian bibliometric coauthorship networks.
Journal of the Association for Information Science and Technology, v. 65, n. 7, p. 1424-1445, 2014.
MENA-CHALCO, J. P.; CESAR-JR, R. M. ScriptLattes: an open-source knowledge extraction system from the Lattes platform. Journal of the Brazilian Computer Society, v. 15, n. 4, p. 31-39, 2009.
NEWMAN, M. E. J. The structure of scientific collaboration networks. PNAS, v. 98, n. 2, p. 404-409, 2001.
OLIVEIRA, E. A. et al. Comparison of Brazilian researchers in clinical medicine: are criteria for ranking well-adjusted? Scientometrics, v. 90, n. 2, p. 429–443, 2012.
SAID, Y. H.; WEGMAN, E. J.; SHARABATI, W. K. Author-coauthor social networks and emerging scientific subfield. In: PALUMBO, F., LAURO, N. C., GREENACRE, M. J. Data Analysis and Classification. Springer: Berlin,
2010. p. 257-258.
SANTOS, A. M. Aplicações de modelos grafos na análise de conflitos e de redes sociais. Tese (Estatística) – Universidade Federal de Pernambuco, 2014.
SOUZA, C. G.; FERREIRA, M. L. A. Researchers profile, co-authorship pattern and knowledge organization in information science in Brazil.
Scientometrics, v. 95, n. 2, p. 673-687, 2013.
TUESTA, E. F. et al. Analysis of an advisor-advisee relationship: an exploratory study of the area of exact and earth sciences in Brazil. Plos One, v. 10, n. 5, p. e0129065, 2015.
WAINER, J.; VIEIRA, P. Correlations between bibliometrics and peer evaluation for all disciplines: the evaluation of Brazilian scientists.
Scientometrics, v. 96, n. 2, p. 395-410, 2013.
WEISBERG, S. Applied linear regression. 3. ed. Hoboken: Jonh Wiley & Sons, 2005.
YOSHIKANE, F.; KAGEURA, K. Comparative analysis of coauthorship networks of different domains: The growth and change of networks.
Scientometrics, v. 60, n. 3, p. 433-444, 2004.