AEDESAEGYPTI LARVAL HABITATS IN SURINAM'~*
Milton E. Tinker, Ph. D.3
Roof gutters can provide a good refuge for Aedes aegypti
larvae. This article indicates that such gutters are the dominant
A. aegypti habitat in Paramaribo, Surinam, where active
eradication efforts have been carried out. In Albina, a town where these efforts had been discontinued, relatively larger numbers of ground-level infestations have been found.
Introduction
Aedes aegypti is one of the most widespread mosquito species on earth. Being present or having been present in all tropical and sub- tropical countries, it has developed diverse habitats in different parts of its range. In Africa, where it probably originated, the larvae commonly inhabit tree holes in swampy areas (Surtees, 1960); but in most of the world they are found primarily in man-made containers and only secondarily in natural containers. The containers most frequently used vary from place to place, depending on the types avail- able. Major categories of artificial containers
used by A. aegVpti have ranged from tires and
metal containers in Tanzania (Rao, et al., 1969) to ant traps and large earthenware jars in Malaya (MacDonald, 1965) to old tires in the United States (Tinker, 1964). Because of this adaptability, the mosquito’s habitat must be
studied in the particular areas where it is to be controlled or eradicated in order to determine what containers play an important role in its propagation.
Surinam, where large numbers of A. aegypti
larvae have been reported in roof gutters and catch basins, provides a case in point. These habitats have not been encountered often in other countries, and they have therefore been
1 Also appearing in Spanish in the Boletin de la
Oficina Sanitaria Panamericana.
2Based on research performed with the assistance
and cooperation of the Ministry of Health, Govem- ment of Surinam.
3Previously a member of the Jamaica Insecticide Testing Unit of the Pan American Health Organtia- tion, the author recently transferred to the Unit for Research on the Epidemiology of Malaria in Problem Areas in El Salvador.
called “atypical” sites. However, they are more
properly termed uncommon, rather than
atypical, because they do possess the “typical”
features required by A. aegypti. Thus extensive
roof gutter infestations have also been found in other countries, such as Guyana, where large numbers of roof gutters exist (DeCaires, 1947). The present study investigates the pattern of
distribution of A. aegypti larvae in a number of
typical areas of Surinam. The data presented here will show the importance of the various types of habitats involved.
Surinam has an active A. aegypti eradication
campaign which employs the standard perifocal technique (PAHO, 1957). Every possible larval habitat on all premises is treated with fenthion and Abate on a two-month treatment cycle. In addition, due to heavy infestations special crews inspect and treat roof gutters. Because this latter work is time-consuming it involves a treatment cycle of about a year.
Because of the heavy infestations of A. aegVpti in roof gutters after applications of insecticide, it has often been felt that the treatment of ground-level habitats was forcing
A. aegypti into the roof gutters. An alternate
hypothesis is that large numbers of A. aegypti
have survived the applications because the gut- ters are very difficult to treat. These hypotheses can be tested by comparing mosquito habitats in treated and untreated areas-to determine whether the species prefers the roof gutter habitat or whether it is being driven there.
Procedures
The work reported here was based on a comprehensive survey made in February 13 7?
294 PAHO BULLETIN * Vol. VIII, No. 4, I974
of all possible larval habitats in five areas of Surinam.
Selection Criteria
In choosing these five areas, the following factors were considered: (1) climate, (2) size of the human community, (3) socioeconomic con- ditions, (4) past treatment history, and (5) pa’,r A. aegypti infestation record.
CZirruzte. There is little climatic variation in Surinam. Because of this, climate was not used as a criterion in choosing survey areas. It should be noted, however, that the two localities surveyed had similar rainfall patterns (89.4 inches per year in Paramaribo and 97.5 inches in Albina) and that the surveys were done during the rainy season. During the 18 days of the investigation it rained some on all but three days.
Community size. A. aegypti infestations are generally larger and more complex in larger human communities. Thus a study that aspires to be complete should survey several commu- nities of different size. Our particular investiga-
tion used the following size categories in
selecting the communities to be surveyed:
1) Rural communities-no organized settle-
ment ;
2) Villages-less than 2,000 people, less than 500 houses;
3) Towns-2,000-10,000 people, 500-2,500
houses;
4) Cities-over 10,000 people, over 2,500
houses.
For lack of time and because lower infesta- tion rates have generally been found in rural areas and villages of Surinam, it was decided that the survey would cover four areas in the city of Paramaribo and one in the town of Albina.
Socioeconomic conditions. Infestations of A. aegypti usually correlate strongly with socio- economic conditions (Tinker, 1964). The high- est infestations are generally found at the lower socioeconomic levels and the lowest infesta- tions at the upper socioeconomic levels. The
five socioeconomic land-use categories listed below were considered in choosing the areas to be surveyed:
1) Lower-level residential: Small homes,
often crowded and in poor condition, whose residents are usually members of the laboring class.
2) Middle-level residential: Medium-sized
homes, generally in good condition, whose residents are usually members of the middle class.
3) Upper-level residential: Large homes, all in good condition.
4) Business areas: Shops and light industry.
5) Industrial areas: Large factories and
warehouses, often with sizeable lots used for storage.
While one of these categories usually pre- dominates, there are often mixtures, especially in the lower residential and business areas. In towns and villages no one category is large enough to be sampled separately except for the lower residential area.
Treatment histoly. Treatment would logical- ly be expected to change the pattern of
infestation. Such change depends on the
amount and type of treatment. Therefore, the following patterns of past treatment were con- sidered in choosing the areas to be studied: (1) No treatment; (2) Recent treatment (for less than a year); (3) Lapsed treatment (for more than one treatment cycle); and (4) Long-term treatment (for more than a year). The pattern of infestation in categories (1) and (3) should be similar, especially after a long lapse. In Surinam all towns have been treated for more than a year, but the treatment in some places has lapsed. Albina was picked as an example of the latter to provide a basis for comparison with Paramaribo, which has received long-term treatment.
Tinker . A. AEGYPTJ LARVAL HABITATS IN SURINAM 295
has been relatively unsuccessful. The four cat- egories of infestation used in choosing study areas were adopted from the Manual of Upera- ticms for an Aedes aegypti Eradication Service
(PAHO, 1957). These are: (1) high (over 15 per cent of the houses infested); (2) moderate (2-15 per cent of the houses infested); (3) slight (infestation, but less than 2 per cent of the houses infested); (4) uninfested.
Because of the short time available, it was felt that study areas should be picked where recent surveys had shown moderate or high levels of infestation, so that a statistically significant number of infestations would be found. This eliminated most towns and upper- level residential areas, because they were either uninfested or had only slight infestations.
Based on these considerations, four areas were picked in Paramaribo and one in Albina. Those in Paramaribo are areas where persistent infestations have been undergoing long-term treatment. They can be categorized as follows:
Area l-Lower-level residential, near city
center;
Area 2-Lower-level residential, at edge of
city ;
Area 3-Middle-level residential;
Area 4-Old lower-level residential area bor- dering business districts.
Portions of areas 2 and 4 contain middle- class residences. The Albina area, where treat- ment had lapsed, was typical of town areas in that it contained a mixture of businesses,
lower-class residences, and middle-class res- idences.
Sampling Technique
All premises were thoroughly inspected both inside and out. A census was made of all potential A. aegypti habitats, including roof gutters: all were classified, counted, examined, and all infestations were noted. A sample of larvae was collected from each infestation site and identified microscopically. In all cases the
preliminary identification of larvae as A.
aegypti was confirmed.
A standard list was used to classify potential habitats. This list included the following entries: cisterns or tanks, drums and barrels, clay containers, water plants, small containers, roof gutters, tires, other containers, street catch basins, and tree holes.
Results and Discussion
Infestation Levels
In each area the level of infestation was determined (see Table 1). In Paramaribo, area 1 had a moderate level of infestation while areas 2, 3, and 4 had high levels. The Albina area was very heavily infested.
Containers
A particular type of container can play an
TABLE l-Houses infested with A. aegypti lmae, showing proportion with gutter and ground infestations.
survey HOUSES area inspected
Houses infested with A. aepvpn’* % infested houses with gutter vs. gmund infestation sites* Total In gutter on gmund Gutter and ground
In On Gutter
No. % NO. % NO. % NO. % gutter ground and ground
Area 1 Area 2 Area 3 Am4
Paramtibo (subtotal) Albina
Total
95 8 8.4 4 4.2 4 4.2 0 0.0 50.0 50.0 0.0
104 21 20.2 18 17.3 4 3.9 1 1.0 85.7 19.0 4.8
118 20 17.0 10 8.5 14 11.9 4 3.4 50.0 70.0 20.0
84 22 26.2 15 17.9 11 13.1 4 4.8 68.2 50.0 18.2
401 71 17.7 47 11.7 33 8.2 9 2.2 66.2 46.5 12.7
114 45 39.5 15 13.2 32 28.1 2 1.8 33.3 71.1 4.4
515 116 22.5 62 12.0 65 12.6 11 2.1 53.4 56.0 9.5
TABLE 2-Numbers of containers found, listed by type.
survey area
AWL1 Area2 Area 3 Area 4
Small containers Miscellaneous containers Roof gutters
Water BUT.& Catch Clay Cisterns Tree No. % of total No. % of total No. % of total phts and drums Tires basins containers or tanks holes Total
E
197 7.3 112 4.2
2
13 z;
6 2
0 i
2,688
75:o
169 6.4 171 6.5 9 2 2,637
386 ::; z 7.0 108
E
77.7 164 10.4 46 10
z Yci :; : l?i 3,991
2,366
Pa~m~arlbo (subtotal) ‘2::;: 78.4 80.1 916 126 7.0 3.8 810 201 6.9 6.1 218 52 1E 195 50 13-l 2 34 16 4” 17 0 11.682 3,274
Total 11,886 79.5 1,042 7.0 1,011 6.8 270 253 245 136 50 46 17 14,956
TABLE 3-Numbers of containers found with water.
survey ama
Small containers Mlhcellaneous containers Roof gutters
No. with % with No. with % with No. with % with Water Barrels Catch clay Cisterns Tree water water water water water water plants and drums Tires basins containen or tanks holes Total
Area 1 Area 2 Area 3 Area 4
430 18.0 z 27.4 9 8.0 18
:tIt 37.3 57.5 1:; 2; .z
2: 7 ii i 0 Y %
12:9 “ii 54.3 68 27:5 41 : 90 18 ii 0 : A ‘,@I;
Pa~myribo (subtotal) 1,453 485 15.7 18.5 “ci 46.7 42.9 304 102 50.7 31.5 173 46 2 45 32 120 2 4 7 3: i 2.568 El8
Total 1,943 16.3 482 46.3 406 40.2 219 117 77 122 11 37 2 3,416
TABLE ANumbers of containers infested with A. aegypti.
survey atea
Small containers Roof gutters Water plants
%hlfuted %hlf&d R inksted
MlSCd-
of of of lanmus Barrels cisterns
inE;ed
of mntiers No. of containers No. of containers con- and Catch clay TtW
total with water tnfestd total with water infested total with water tallers drums Tires basins containen t& holes Total
Area1 : 0.04 11.1 4.5 55.6 i 11.5 33.3 0
Area2 0.1 10.3 14.0 82.8 0.0 0.0 x x 0 0 8 8 0 2;
Area3 12
Area4 6 3 % . 18 :% . 5:: : 1::; 26” 0 i : : 0 1 : A : 0 ii
Paramaribo (subtotal) E
0.2
5:: E
7.4 9.0
Albina 1.1 10.9 it: 14’ id 16.3 : 1: ; A
0 100
1 ; A 86
Tinker . A. AEGYPTI LARVAL HABITATS IN SURINAM 297
important role in A. aegypti propagation if a high percentage of the infested containers are of that type. This can come about if many containers are of the type in question, or if a large proportion of that particular type are infested. In our survey the first case was illustrated by small containers, the second by drums in Albina and by roof gutters in both Albina and Paramaribo.
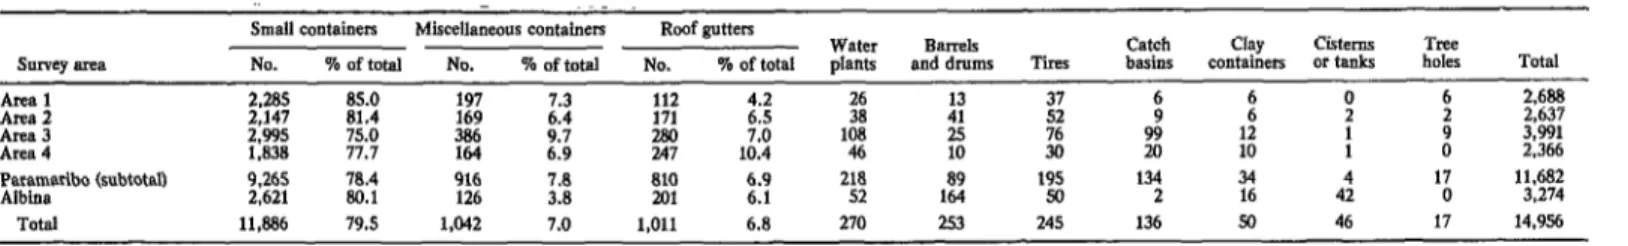
The distribution of the different types of containers was typical (see Table 2). Most of the containers (79 per cent) were classified as small containers (these were mostly tin cans). Still, the number of such containers was not great when compared with other countries, the overall average per premises being 23 small
containers. In Jamaica the average per pre-
mises is 120. While we found them to produce many infestations, they were not a good habitat. Only a small proportion (16.3 per cent) contained water (Table 3), and only 0.4 per cent were actually infested; but because there were so many they accounted for a significant proportion (28 per cent) of all infestations, as shown in Table 4.
Water-plant containers and tires. Fewer water-plant containers and tires were found than might have been expected, these types respectively accounting for only 1.8 and 1.6 per cent of all containers. On the other hand, both types provided good habitats and both har- bored a significant proportion of the infesta- tions. Overall, 8.5 per cent of the water plants were infested and these accounted for 12.4 per cent of the total number of infestations. The respective figures for tires were 2.0 and 2.7 per cent (see Table 4).
The water plants’ role appears less important when it is considered that 12 of the 14 infested water plants in Albina were found on the premises of one house. Without these premises the water plants’ share of the total infestation observed in Paramaribo and Albina would drop from 12.4 to 5.9 per cent. Though this is still an important figure, growing plants in water has not been as widespread in Surinam as in the islands of the Caribbean. For example, in
untreated parts of Jamaica water plants have been found to account for 30 per cent of the infestations.
Drums and Tanks. Water stored in drums and tanks provided an important habitat in Albina but not in Paramaribo. This was true even though the proportion of Albina surveyed does have a piped water supply. In Paramaribo the number of drums was low, making up only 0.8 per cent of all the containers; in contrast, they were relatively common in Albina, where they represented 5 .O per cent.
The same observations were true of tanks. They made up 0.3 per cent of the containers in Paramaribo and 1.3 per cent in Albina, and this difference showed up even more sharply in the infestations found. Only one drum or tank infestation was observed in Paramaribo, this being in an ornamental tank. On the other hand, two infested tanks and 13 infested drums were found in Albina, these constituting 2.3 per cent and 15.1 per cent of the infestations there. The differences presumably stem from Parama- ribo’s ban on water storage and its active A. aegypti eradication campaign.
Catch basins. Also known locally as “rain gullies,” these are considered an atypical habitat for A. aegypti, but they do meet the general requirements of a container with hard sides and a fluctuating water level.
A catch basin is the structure which receives rainwater from the street and passes it into the storm sewer. Within it is a small settling basin which contains water all the time, and which has the purpose of removing debris from the water so as to prevent the sewer from clogging up. This is an ideal habitat for C&X fatigans and occasionally A. aegypti.
298 PAHO BULLETIN . Vol. VIII, No. 4, 19 74
uegypti. On the other hand, 26 of them (19 per cent) were infested with C. futigans. In the two areas with a significant number of catch basins (areas 3 and 4) they were a C. fatigans habitat of considerable importance. The two areas had the largest numbers of C. futiguns infestations, and the catch basins alone accounted for 76.9 and 66.7 per cent of these (see Table 5).
Roof gutters. The results of our study show that roof gutters are the dominant habitat of A. uegypti in Surinam. In Paramaribo, this one category of container was responsible for 60.0 per cent of the infestations observed and for 66.2 per cent of the infested premises (see Tables 1 and 4). It was thus more important than all the other categories of containers combined.
This major role resulted partly from the large number of roof gutters in use and partly from the high proportion of gutters infested. They were the third most common type of containers, after small containers and other containers; and they had the highest infestation rate (7.4 per cent) of any category, the next highest categories being water plants (4.1 per cent) and tires (1.5 per cent).
The same was true in Albina, where roof gutters were the site of infestation on 33 per cent of the infested premises, were the second most common category of container (6.1 per cent of the total), and had the second highest rate of infestation (10.9 per cent). The Albina survey showed water-plant containers to have the highest rate of infestation (26.9 per cent), but this was due to the high rate at a single premises where 12 of 20 water plants were
infested. In the rest of the 113 premises surveyed, only two of 32 (6.5 per cent) were infested. Other containers with high infestation rates in Albina were drums (7.9 per cent), tanks (4.8 per cent), and tires (4.0 per cent).
One of the most important factors behind this pattern was the high proportion of build- ings with roof gutters in both Paramaribo and Albina (see Table 6). On the average 66.1 per cent of the buildings had them in Paramaribo and 62.3 per cent in Albina. Many of these gutters contained water (56.2 per cent in Paramaribo, 67.6 per cent in Albina), and nearly a third of those containing water were infested (31.5 per cent in Paramaribo and 31.3 per cent in Albina). In areas 1 and 2 the percentage of wet gutters infested was especial- ly high (57.1 per cent in area 1 and 50.0 per cent in area 2).
Two sets of data indicate that roof gutter infestations are often the source of infestations in containers on the ground. These are (1) the distribution of infestations with pupae (pupal foci) and (2) the spatial relationship of gutter and ground infestations.
When infested water contains pupae, this is generally recognized as a sign that the focus of infestation is well established and is providing a source for infestation of surrounding areas. This is generally true, though in the case of con-
tainers with highly intermittent water it is
possible for one brood to emerge before the eggs for the next brood are hatched. Thus some
established sources of infestation will not
contain pupae if they are inspected too soon after the eggs hatch.
TABLE S-Catch basins and Culexjiatigans infestations.
survey area
Area1 Area 2 Am3 Area 4
Paramaribo (subtotal) Alblna
Total
AU containers Catch basins
Percentage of c. jatigans No. No. with No. with No. No. with No. with infestations found inspected A. aegypti c. fieigam inspated A. aegypti c. fatigm In catch basins
2,688 9 2 6 0 0 0.0
2,637 29 2 9 0 0 0.0
3.991 30 26 99 0 20 76.9
2,366 32 9 20 1 6 66.7
11,682 100 39 134 1 26 66.7
3,274 a6 6 2 0 0 0.0
14,956 186 45 136 1 26 57.8
c
+
Tinker , A. AEGYPTI LARVAL HABITATS IN SURINAM 299
t
4
1
TABLE 64. aegypti mof gutter infestations.
survey area
Total No.
Houses inspected Houses with
rwf gutten
With roof With water With A. aegvpti- Houses with water gutters in gutters infested paterr % with in mof gutters.
water in % with % infested with NO. % NC.. 56 NO. % gutters A. aegypti A. aegypti
Area 1 9s 42 44.2 7 7.2 4 4.2 16.7 9.5 57.1
Area 2 104 63 60.6 36 34.6 18 17.3 57.1 28.6 SO.0
Ares 3 118 90 76.3 67 56.8 10 a.5 74.4 11.1 14.9
Area4 &I 70 83.3 39 46.4 15 17.9 55.7 21.7 38.5
Paramaribo kubtotal) 401 265 66.1 149 37.2 47 11.7 56.2 17.7 31.5
Albina 114 71 62.3 48 42.1 1s 13.2 67.6 21.1 31.3
In both Paramaribo and AIbina, a higher proportion of the infestations with pupae were found in the gutters than on the ground (see Table 7). In Paramaribo 52.2 per cent of the gutter infestations were classed as pupal foci, as opposed to only 25.0 per cent of those on the ground; and in Albina, 72.7 per cent of the gutter infestations were pupal foci, while only
12.1 per cent of the ground infestations were of this type. Stated another way, 52.1 per cent of the premises with roof gutter infestations in Paramaribo had pupal foci, but this was true of only 30 per cent of those with ground infesta- tions. Likewise, in Albina pupal foci were found on 60.0 per cent of the premises with roof gutter infestations but on only 15.6 per cent of those with infestations at ground level. These findings indicate that roof gutters are a frequent source of further infestation in both Paramaribo and Albina.
To further examine the relation between ground and gutter infestations, all locations
were marked on a map and were classified in terms of their proximity to each other (see Table 8). Most of these classifications were confnmed in the field. Based on these data, each house surveyed was placed in one of the following categories:
1) With independent gutter infestation; 2) With independent ground infestation; 3) With one or more gutter infestations located less than 50 m from a ground infesta- tion;
4) With one or more ground infestations located less than 50 m from a gutter infesta- tion;
5) With both gutter and ground infestations.
In Paramaribo 39.5 per cent of the infested premises surveyed had infestations of the inter- related types (categories 3, 4, and 5) as shown in Table 8. Of the remaining independent infestations, 40.9 per cent were in roof gutters and 19.7 per cent were on the ground. This
TABLE 74. aegypti pupae in gutter and gmnnd-level infestations.
No. of ihated contim No. of premises with infested % infested % blfeshd cootaiaers plI&S
GUtt.55 Other GUttfXS other mntablers with pupae with pupae
Lanrac Larvae w= Larvae other ItI otber
Larvae and Larvae and Iamae and Larvae and con- In con-
Survey area ody pupae Total Only pupae Total OdY pupae Total only popae Total Gutters tniners @ters trainers
Area1 2 3 5 3 1 4 1 3 4 3 1 4 60.0 25.0 75.0 25.0 :
Area2 13 11 24 4 1 5 10 8 18 3 1 4 45.8 20.0 44.4 25.0
Area 3 6 7 13 12 5 17 S 5 10 9 5 14 53.8 29.4 50.0 35.7
Area 4 8 11 19 11 3 14 7 9 16 8 3 11 57.9 21.4 56.2 27.3
Paramnribo 29 32 61 30 10 40 23 25 48 23 10 33 52.5 25.0 52.1 30.3
Albim 6 16 22 51 7 58 6 9 15 27 5 32 72.7 12.1 60.0 15.6
300 PAHO BULLETIN . Vol. VIII, No. 4, 1974
TABLE 8-RelationshIps of gutter and ground A. aegypti hfestatio~.
Number of houses infested Percentage of houses infested
Site of infestation Site of infestation
Number Gutter Ground Gutter Ground
of Glitter @fear Gutter (Near Gmund GUttM (Near Glitter (Near Ground houses Total &de.- ground in- and guner in- (Inde- Unde- ground in- and gutter in- (Inde- Sutvey area inspected Infested pendent) festntion) ground festation) pendent) pendent) festation) ground festation) pendent)
Ares 1 Area 2 Area 3 Area4
Paramaribo (subtotsl) Albina
95 8 4 0 0 0 4 53.0 0.0 0.0 0.0 50.0
104 21 14 3 1 2 1 66.7 14.3 4.8 9.5 4.8
118 20 4 2 4 6 4 20.0 10.0 20.0 30.0 20.0
84 22 7 4 4 2 5 31.8 18.2 18.2 9.1 22.7
401 71 29 9 9 0 14 40.9 12.7 12.7 14.1 19.7
114 45 6 7 2 9 21 13.3 15.6 4.4 20.0 46.7
pattern was most striking in area 2, where 66.7 per cent were independent roof gutter infesta- tions; and it was also evident in area 4, where 31.3 per cent of all infestations were of this type. These findings tend to indicate that in areas 2 and 4 the infestations were spreading from the roof gutters to the ground.
However, different patterns were found in areas 1 and 3. In area 1 the two types of infestation were completely independent and there was no evidence of any movement from one type to the other. In area 3 all categories were about the same size, a finding that could
indicate movement in both directions.
A different pattern was also found in Albina. Here 46.7 per cent of the infested premises had independent ground infestations, while only 13.3 per cent had independent gutter infesta- tions. This indicates that the infestation might have been spreading from the ground to the roof gutters.
A comparison of the infestations in Albina and Paramaribo is very useful in showing the
importance of roof gutters. After almost a year’s lapse in treatment, and with a very high rate of infestation, the situation in Albina can be considered typical of an untreated A. aegypti population. When the data are ex- amined, a striking similarity is found between some of the Albina figures and the average figures for Paramaribo. As shown in Tables 1,4, and 6, the percentage of houses with roof gutters (66.1 vs. 62.3) is similar, as is the percentage with wet roof gutters that are infested (3 1.5 vs. 3 1.3), the percentage of roof gutters with water that are infested (7.4 vs. IO), and the percentage of houses with roof gutter infestation (11.7 vs. 13.2). Because of this great similarity, it must be concluded that the roof gutter infestation in Paramaribo is typical for Surinam, and that the main difference in the two localities is that the level of ground infestation has been reduced in Paramaribo. There is no evidence of A. aegypti being driven to the roof gutters by treatment in Paramaribo.
SUMMARY
In 1972 a study was made of Aedes aegypti In Albina stored water was a major source of
habitats in Surinam. This was based on a infestations. but not in Paramaribo. This was
comprehensive survey of all potential habitats probably due to Paramaribo’s ban on water
in four areas of the capital, Paramaribo, and in storage and its A. aegypti eradication program.
part of the town of Albina. It was found that roof gutters constituted a
A. aegypti larvae were found in storm sewer major habitat of A. aegypti in all areas sur-
catch basins, but not in large numbers, although veyed. In fact, the proportion of houses with
Culex fcftigans infestations were very common infested roof gutters in the treated areas of
there. Paramaribo and in Albina, where treatment bad
*
b
c
c
Tinker . A. AEGYPTI LARVAL HABITATS IN SURINAM 301
Y
lapsed, were very similar. The main differences foci of A. aegypti. There is no evidence that A.
in infestation patterns were those due to higher aegypti are being driven to the roof gutters by
levels of ground infestation in Albina. insecticide treatments. Rather, the number of
Evidence provided by the presence of pupae ground infestations appears to have been
at some sites and by the spatial relationship of reduced in treated areas, leaving the gutter
gutter and ground infestations indicates that infestations relatively unaffected.
roof gutters are harboring numerous reservoir
REFERENCES (I) De Canes, P. F. Aedes aegypti control iu absence
of piped potable water supply. Am J 7?op Med
21: 733-743, 1947.
(2) MacDonald, W. W. Aedes aegypti in Malaya: II. Larval and adult biology. ARR Trap Med Parasitol 50: 339~414,1959.
(3) Pan American Health Organization. “Manual of Operations for an Aedes aegypti Eradication Service, Part Two: Manuals of Instruction” (Mimeographed). Washington, D.C., 1957. (4) Rao, T. R., M. Trpis, J. D. Gillett, and C.
Teesdale. Breeding Habitats and Seasonal IRci-
dences of Aedes aegypti in Dar-Es-Salaam, Tanzania, as Assessed by the Single-larvae Sur- vey Method. World Health Organization, Docu- ment WHO/VRC/69.153, Geneva, 1969. (5) Surtees, G. The breeding behavior of the type
form of Aedes (Stegomyia) aegypti (L.) in south-eastern Nigeria in relation to insecticidal control. BullEnt Res 50: 681-686,196O.
(6) Tinker, Milton E. Larval habitat of Aedes aegypti
(L.) ln the United States. Mosquito News 24: 426-432,1964.