Blood lactate and oxygen consumption in soccer players:
comparison between diferent positions on the ield
Paulo Roberto Santos-SilvaI, André PedrinelliI, Júlia Maria D´Andrea GreveI
DOI: 10.5935/MedicalExpress.2017.01.02
I Universidade de São Paulo, Faculdade de Medicina, Departamento de Ortopedia e Traumatologia, Laboratório do Estudo do Movimento, São Paulo, Brazil.
OBJECTIVE: We hypothesize that in players with better aerobic itness, lactate production was not inhibited after high-intensity exercise, regardless of the footballer’s position on the ield.
METHOD: Sixty professional male soccer players performed cardiopulmonary exercise tests on an ergometric treadmill; respiratory gas exchanges were monitored throughout and blood lactate levels at peak efort was measured, using a portable device. The heart rate response was determined by computerized EKG. Training sessions took place over an average of ten hours per week, and the players had 6.8 years of experience in competitive soccer; they were tested a third of way into the season. The positions tested were (centerback, fullback, midielder and striker).
RESULTS: The following results (mean ± std. dev.) were obtained: (1) peak oxygen consumption of 58.8 ± 4.5 ml.kg-1.min.-1; (2), blood peak lactate of 12.3 ± 1.6 mmol.L-1; (3) maximum heart rate of 193 ± 3.3 beats. min-1; (4);
oxygen consumption at the second ventilatory threshold of 49.6 ± 5.0 mL. kg-1.min-1; (5); running speed at the
second ventilatory threshold of 13.3 ± 0.8 km.h-1; (6) percentage of oxygen consumption in the second ventilatory
threshold of 84 ± 6%. There was no correlation between maximum aerobic level vs. peak lactate concentration (r = -0,031; p = 0.812), nor between submaximal aerobiclevel vs. peak lactate concentration(r = -0.146; p = 0.335) in the positions tested.
CONCLUSION: Better or worse aerobic proiles according to game positions in soccer players do not inluence peak lactate levels following high-intensity exercise, and conirms the study hypothesis.
KEYWORDS: training, aerobic and anaerobic exercise, ventilatory threshold, heart rate, cardiopulmonary exercise test.
Santos-Silva PR, Pedrinelli A, Greve JMDA. Blood lactate and oxygen consumption in soccer players: comparison between diferent positions on the ield. MedicalExpress (São Paulo, online). 2007 Feb;4(1):M170102
Received for Publication on October 24, 2016; First review on November 28, 2016; Accepted for publication on December 29, 2016; Online on January 20, 2017
E-mail: [email protected]
■
INTRODUCTIONSoccer is a multi-activity sport played at a relatively high mean work intensity interspersed with short periods of very-high- intensity sprint and jump performance, soccer should therefore be regarded as a sport with both aerobic and anaerobic demands. The match duration in combination with the load on the aerobic metabolic pathway indicates that the main energy contribution comes from aerobic processes. It
is estimated that aerobic metabolism accounts for 90% of the energy required during a soccer match, and is therefore a pre-requisite for this sport. Typical for soccer is also the continuous variation in work intensity related to action on the soccer field, involving standing, walking, jogging, running, high-speed running, and sprinting.1-4
It is widely accepted that during a high-intensity stimulus, resynthesis of ATP occurs primarily via the anaerobic pathways.5 However, when this type of exercise
the participation of anaerobic glycolysis and consequently, the production of lactate during the intermittent effort throughout the game, are present.7 It may be noted that a
more pronounced level of systemic oxidative stress has been reported after aerobic as compared to anaerobic training sessions in young soccer palyers.8
Soccer today is more compacted and more intense, and the tactical determinations require a more dynamic and sustainable physiological profile when it comes to the physical capacities required by the sport for the metabolic compensations of required during the game.9
However, in relation to the higher levels of aerobic fitness required in some positions, ithas been noted that these athletes were less efficient in increasing their lactate levels at peak effort, because aerobic metabolism reduces lactate production10 due to an increase in the quantity of
monocarboxylate transporters (MCT) of isoform 1,11 which
carry out the process of lactate influx12 and also because of
an increasethe mitochondrial density and volume.13 This, in
turn, leads to an increase in the rate of reduction of blood lactate at peak effort.14
In view of this, it is assumed that athletes of intermittent sports who have greater aerobic fitness have a higher capacity to maintain this performance in intense effort, even in the presence of high levels of blood lactate.15
The hypothesis of the present study is to determine whether maximum and sub-maximal aerobic capacity of professional soccer plays in different positions on the field affect the production of lactate after intense exercise.
■
MATERIALS AND METHODSStudy Design and population
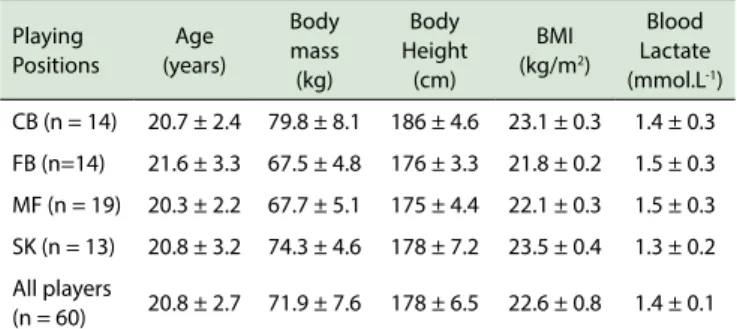
The study design was cross-sectional. Sixty male professional soccer players took part in the study (center-backs = 14, full(center-backs = 14, midfielders = 19, and strikers = 13]. The players played for various first division Brazilian teams. Table 1 shows the anthropometric and metabolic characteristics all the players at rest. All were of a high competitive level, spent an average of 10 ± 1.5 hours a week in training, had six years of experience as professional footballers, and played an average of one or two games per week. All the players were in good health (defined as being free of diabetes, heart disease, musculoskeletal dysfunction, and cancer). The tests were performed in a physiology laboratory, during the morning, starting at 8 a.m., or during the afternoons, at 1 p.m. During the tests, the temperature in the laboratory varied between 18°C and 22°C and relative humidity between 50% and 70%. The athletes ate a light meal one hour before the tests, and were dressed in appropriate sports clothes and shoes for the test.
Table 1 - Baseline characteristics of the soccer players according to
playing position and in general
Playing Positions
Age (years)
Body mass (kg)
Body Height
(cm)
BMI (kg/m2)
Blood Lactate (mmol.L-1)
CB (n = 14) 20.7 ± 2.4 79.8 ± 8.1 186 ± 4.6 23.1 ± 0.3 1.4 ± 0.3
FB (n=14) 21.6 ± 3.3 67.5 ± 4.8 176 ± 3.3 21.8 ± 0.2 1.5 ± 0.3
MF (n = 19) 20.3 ± 2.2 67.7 ± 5.1 175 ± 4.4 22.1 ± 0.3 1.5 ± 0.3
SK (n = 13) 20.8 ± 3.2 74.3 ± 4.6 178 ± 7.2 23.5 ± 0.4 1.3 ± 0.2
All players
(n = 60) 20.8 ± 2.7 71.9 ± 7.6 178 ± 6.5 22.6 ± 0.8 1.4 ± 0.1 Legend: CB, centerbacks; FB, Fullback; MF, Midielder; SK, Striker.
Ethical considerations
Prior to their participation in the study, all participants were given a verbal explanation of the aim of the research, and the procedures to be carried out; an informed consent form was signed by all the athletes. The study was carried out in strict accordance with the ethical guidelines of the Declaration of Helsinki, and was approved by the Ethics Committee (CAPPESQ case #1251/2007) of the Hospital das Clínicas of the School of Medicine of Universidade de São Paulo, São Paulo, Brazil.
Determining the maximum oxygen consumption
(peak VO2)
Oxygen consumption was measured by means of a respiration gas exchange system using a computerized metabolic analyzer (CPX/D, MedGraphics, St. Paul, MN, USA). The oxygen and carbon dioxide analyzers were calibrated before and immediately after each test, by means of a known gaseous mixture (O2 = 11.9% and 20.9%), (CO2 = 5.09%) and balanced with nitrogen. The pneumotachograph was calibrated with a 3-liter syringe (Hans Rudolph®, USA). The ventilatory variables were
analyzed every 30sec after the end of the test. The peak VO2 was defined as the maximum VO2 measured at the end of the exercise, when the athlete was no longer able to maintain the speed imposed by the ergometric treadmill with a fixed tilt maintained of 3% (ATL Inbramed®, Porto Alegre, Brazil), through a continuous
progressive protocol, until exhaustion. In this protocol, the players rested for two minutes and warmed up for four minutes, at speeds of 4, 5, 6 and 7 km.h-1 (one minute
at each speed). They then started the test, running at 8km.h-1 and increasing the speed by 1 km.h-1 every two
minutes until voluntary fatigue.16 During the test, verbal
encouragement was given, to increase the players’ levels of motivation.17 The subjective perception of effort by the
Determining the second ventilatory threshold (VT2)
This was determined through ventilatory gaseous exchange at the point where the ventilatory equivalent of carbon dioxide (VE/VCO2) reached its lowest value before starting to increase, and when the end-tidal carbon dioxide pressure (PETCO2)reached its maximum value before decreasing.19
Determining the maximum peak lactate
One minute after interrupting the test, a drop of blood was taken from the fingertip, and a portable lactate meter (Accusport Lactate Meter, Boehringer Mannheim®,
Germany) which requires between 10 and 25 μL of blood was used to measure the lactate level in the blood. Blood collections to determine peak lactate are generally carried out at one-minute intervals.20 The equipment was calibrated
regularly, at the beginning of each day and after every 10 samples with standards of known concentration (1.7-3.1 to 4.5-7.0 mmol.L-1).21
Determining the maximum heart rate (HRmax)
The HRmax was obtained at peak effort through computerized 12-lead ECG (Marquette® Exercise Testing
System, Max Personal, USA) using the Tanaka equation [208 - (0.7 * age)].22 Blood pressure was measured using a
mercury-column sphygmomanometer (Tycos, USA) prior to the start of the test, during progressive exercise, every two minutes, and in the recovery phase until the sixth minute.
Statistical Analysis
Data (expressed as mean ± standard deviation - SD) for each of the evaluated anthropometric and physiological variables were grouped for each game position. The normality of distribution of the data was verified by the Kolgomorov-Smirnov test. Levene’s test was used to examine the equality of variances between the groups. If the data showed normal distribution between the groups, they were compared using one-way analysis of variance (ANOVA), followed by Tukey’s post-hoc test. When the data fell outside the normal range, the Kruskal-Wallis non-parametric test was used, followed by the Mann-Whitney test. To verify the relationship between VO2VT2,peak VO2 and peak lactate in all the players, and also by position, Pearson’s correlation was used. The level of significance was established as p < 0.05 for all the statistical analyzes. When differences between specific positions were detected, the Tukey post hoc test was used to determine which game positions were expressing these differences. All the statistical analyzes were performed using SPSS 11.5 for Windows (SPSS Inc., Chicago) A probability value < 0.05 was adopted as the limit of significance.
■
RESULTSThere were no statistically significant differences according to playing positions in relation to age, body mass, height, body mass index, and blood lactate level at rest (Table 1).
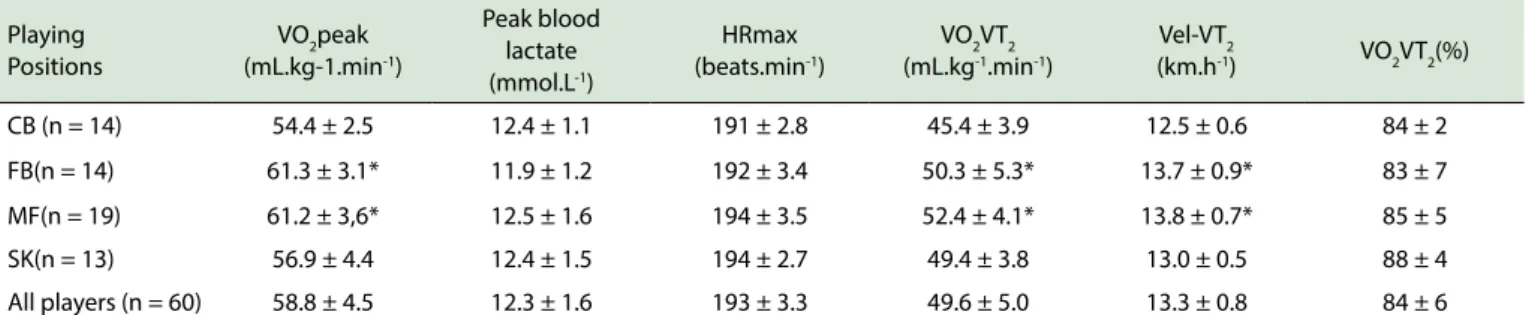
There were no statistically significant differences between game positions for the peak lactate and the maximum heart rate obtained in the test (Table 2). There was a significant difference in peak VO2 between the
positions. It was significantly lower (p < 0.05) for the positions of center-back and striker in relation to the fullbacks and midfielders (Table 2). The peak VO2 between
fullbacks and midfielders showed no differences (Table 2). There were also no significant differences in blood peak lactate between the positions. However, the oxygen consumption in the second ventilatory threshold (VO2VT2) and running speed (km.h-1) in VT
2 (Vel-VT2) between the
positions showed significant differences (Table 2). In the positions of centerbacks and striker, the VO2VT2 and the Vel-VT2 values were significantly lower (p < 0.05) compared to the fullbacks and midfielders (Table 2). The relative percentage of VO2VT2 showed no differences between the positions (Table 2).
No significant correlations (p > 0.05) were observed between VO2VT2, peak VO2, peak VO2, and the upward increase in blood peak lactate, indicating that higher aerobic capacity is not related to lactate concentration after high-intensity exercise (Table 3).
■
DISCUSSIONThe present study addressed aerobic and anaerobic performance factors simultaneously in relation to team play position among elite soccer players. In players with better aerobic fitness through higher VO2 in the second ventilatory
Table 2 - Peak oxygen consumption (VO2peak), peak blood lactate, maximal heart rate (HRmax), oxygen consumption at second ventilatory threshold (VO2VT2), velocity at second ventilatory threshold (Vel-VT2), and percentage of VO2max at second ventilatory threshold (VO2VT2), among the soccer players according to playing positions and in general.
Playing Positions
VO2peak (mL.kg-1.min-1)
Peak blood lactate (mmol.L-1)
HRmax (beats.min-1)
VO2VT2 (mL.kg-1.min-1)
Vel-VT2
(km.h-1) VO2VT2(%)
CB (n = 14) 54.4 ± 2.5 12.4 ± 1.1 191 ± 2.8 45.4 ± 3.9 12.5 ± 0.6 84 ± 2 FB(n = 14) 61.3 ± 3.1* 11.9 ± 1.2 192 ± 3.4 50.3 ± 5.3* 13.7 ± 0.9* 83 ± 7 MF(n = 19) 61.2 ± 3,6* 12.5 ± 1.6 194 ± 3.5 52.4 ± 4.1* 13.8 ± 0.7* 85 ± 5 SK(n = 13) 56.9 ± 4.4 12.4 ± 1.5 194 ± 2.7 49.4 ± 3.8 13.0 ± 0.5 88 ± 4 All players (n = 60) 58.8 ± 4.5 12.3 ± 1.6 193 ± 3.3 49.6 ± 5.0 13.3 ± 0.8 84 ± 6
* p < 0.05.Legend: (VO2max: FB > CB and SK) and MF > CB and SK), (VO2VT2: FB > CB and MF > CB). (Vel-VT2: FB > CB and SK) and MF > CB and SK). Abbreviations: CB, Centerback; FB, Fullback; MF, Midielder; SK, Striker.
Table 3 - Pearson correlation between the second ventilatory
threshold, maximal peak oxygen uptake and maximal peak blood lactate value among the soccer players according to playing positions and in general.
Playing positions
Submaximal intensity
VO2VT2 vs. Peak blood lactate
Maximal intensity
VO2 peak vs. Peak blood lactate CB (n = 14) r = -0.274 p = 0.365 r = -0.185 p = 0.409 FB(n = 14) r = 0.001 p = 0.995 r = -0.129 p = 0.532 MF (n = 19) r = -0.171 p = 0.485 r = -0.133 p = 0.510 SK(n = 13) r = -0.013 p = 0.964 r = 0.079 p = 0.746 All players
(n = 60) r = -0.146 p = 0.270 r = -0.031 p = 0.812
Legend: VO2VT2 = oxygen consumption at second ventilatory threshold; VO2 peak = maximal oxygen uptake. CB, Centerback; FB, Fullback; MF, Midielder; SK, Striker.
Despite the players’ different positions on the field, the group was very homogeneous in relation to aerobic capacity, as reflected in the low standard deviation of the aerobic indicators Vel-VT2 (0.4 km.h-1), VO
2VT2 (1.4 mL .Kg
-1min-1) and %VO
2VT2 (4%).
The highest rate of VO2VT2 between positions was 13.8 and 13.7 km.h-1, which was found for midfielders
and fullbackers, respectively. Our results are very close to those found by some studies on soccer players in these two positions.23,24 The greater running speed found at VT
2
in the players with higher aerobic performance appears to be a response that is related to the type of movement and the distance covered by these players (fullbacks and midfielders); these values are smaller in defenders and strikers; however, fullbacks and midfielders exhibit, much lower values than those observed in long-distance runners. This is probably due to the low emphasis given to specific aerobic training.25
The anaerobic contribution to the global energy demand is emphasized when the frequency of rapid stimuli occurs due to accelerated anaerobic glycolysis.26,27 This
Therefore the blood lactate concentrations observed in soccer may be the result of a cumulative effect of numerous stimuli performed at high intensity.29
In the present study, the players who showed higher oxygen consumption capacity in the submaximal condition (VO2VT2) and in aerobic power at peak effort (peak VO2) also presented higher lactate production capacity. This suggests that in today’s soccer, maintaining endurance and speed requires high levels of this blood metabolite, to keep pace with the intense physical demands of the game.29 These
results confirm the fundamental connection and synergy between the aerobic and anaerobic metabolisms in all the game positions, since there was no difference between them in lactate response at peak effort. This response has important practical implications for footballer training, and demonstrates that physical coaches need to determine the effectiveness of the anaerobic lactic metabolism in all the positions evaluated.
To the best of our knowledge, this is the first study showing the importance of the aerobic and anaerobic metabolisms with respect to field positions in the specific conditions imposed by the way soccer is played in Brazil. Good aerobic capacity plays a role in accelerating recovery between intermittent stimuli, while good anaerobic capacity is responsible for compensating for high intensity demands during the game.30
The specific training for soccer players consists of sessions that focus on endurance, anaerobic exercises, agility, strength, coordination, and sprinting speed. This training format requires training for endurance and muscle speed in the athletes’ movements. Therefore, it is not unexpected that lactate levels in the muscle fibers of these players would increase. Reports in the literature have shown that athletes who perform exercises with these characteristics have a higher capacity for lactate transport.31
In the present study, the response of the HRmax above 95% for age and the blood lactate above 12.3 mmol.L-1
came from various clubs, and that there was no control over the independent variable (training). The results of this study should therefore be analyzed with caution, and it is suggested that additional, more controlled, longitudinal studies should be carried out, with a higher number of players from each position. This could rule out the possibility of bias presented by a cross-sectional study.
■
CONCLUSIONBetter or poorer aerobic performance in the positions of this group of soccer players was not sufficient to decrease the peak lactate concentration after high-intensity exercise. Based on our results which show an absence of positional differences in both peak VO2 and lactate, it is recommended that coaching staff implement regular training programs to monitor current players´ physical development, given that aerobic and anaerobic fitness are claimed to be two of the most important physiological factors behind soccer performance. Therefore, the results were in line with the study hypothesis.
■
CONFLICT OF INTERESTThe authors state that they have no conflicts of interest regarding the publication of this article.
■
ACKNOWLEDGEMENTSWe would like to thank the athletes of the Brazilian teams for participating in the study.
■
AUTHOR PARTICIPATIONSantos-Silva PR: had the overall responsibility for the study and was responsible for the following items: Conception and design, statistical analysis, data collection and interpretation, writing of the manuscript and approved the final version of the manuscript. Pedrinelli A, Greve JMDA: were responsible for the following items: review, and written approval of the final version of the manuscript.
LACTATO SANGUÍNEO E CONSUMO DE OXIGÊNIO EM JOGADORES DE FUTEBOL: COMPARAÇÃO ENTRE POSIÇÕES NA EQUIPE
OBJETIVO: Nossa hipótese era que em jogadores
com melhor condicionamento aeróbio, a produção de lactato não seria inibida após o exercício de alta intensidade, independentemente da posição do jogador no campo.
MÉTODOS: Sessenta jogadores de futebol
profissional masculino foram submetidos a testes de exercício cardiopulmonar em um analisador metabólico troca gasosa respiratória em esteira ergométrica, com medição dos níveis de lactato no sangue no pico do esforço, usando um dispositivo portátil. A resposta da frequência cardíaca foi determinada por eletrocardiograma computadorizado. As sessões de treinamento duraram uma média de dez horas por semana, e os jogadores participantes tinham 6,8 anos de experiência no futebol competitivo. Os jogadores foram testados a um terço para o final da temporada. As posições testadas foram (defesa-central, defesa lateral, meio-campista e atacante).
RESULTADOS: Os resultados obtidos foram:
consumo de oxigênio pico de 58,8 ± 4,5 mL.Kg-1min-1,
pico de lactato no sangue 12,3 ± 1,6 mmol.L-1; frequência
cardíaca máxima de 193 ± 3,3 batimentos.min-1; consumo
de oxigênio no segundo limiar ventilatório de 49,6 ± 5,0 mL.Kg-1min-1; velocidade de corrida no segundo limiar
ventilatório de 13,3 ± 0,8 km.h-1 e porcentual do consumo
de oxigênio no segundo limiar ventilatório de 84 ± 6%. Não houve correlação entre o nível de aeróbio máximo (r = -0,031; p = 0,812) e o nível de aeróbio submáximo (r = -0,146; p = 0,335) nas posições testadas e na concentração pico de lactato.
CONCLUSÃO: Melhor ou pior perfil aeróbio nas
posições de jogo em jogadores de futebol não influenciam os níveis de lactato de pico durante a realização de exercício de alta intensidade, e confirmam a hipótese do estudo.
PALAVRAS-CHAVE: Treinamento, Exercício aeróbio
e anaeróbio, Segundo limiar ventilatório, freqüência cardíaca, teste de esforço cardiopulmonar.
■
REFERENCES1. Reilly T, Bangsbo J, Franks A. Anthropometric and physiological predispositions for elite soccer. J Sports Sci. 2000;18(9):669-83. DOI: 10.1080/02640410050120050
2. Bangsbo J, Norregaard L, Thorso F. Activity profile of competition soccer. Can J Sports Sci. 1991;16(2):110-16.
3. Di Salvo V, Baron R, Tschan H, Calderon Montero FJ, Bachl N, Pigozzi F. Performance characteristics according to playing position in elite soccer. Int J Sports Med. 2007;28(3):222-7. DOI: 10.1055/s-2006-924294 4. Stolen T, Chamari K, Castagna C, Wisløff U. Physiology of soccer: an
update. Sports Med. 2005;35(6):501-36. DOI:10.2165/00007256-200535060-00004
5. Balsom PD, Ekblom B, Sjödin B. Enhanced oxygen availability during high intensity intermittent exercise decreases anaerobic metabolite concentrations in blood. Acta Physiol Scand. 1994;150(4):455-6. DOI: 10.1111/j.1748-1716.1994.tb09711.x
6. Tabata I, Irisawa K, Kouzaki M, Nishimura K, Ogita F, Miyachi M. Metabolic profile of high intensity intermittent exercises. Med Sci Sports Exerc. 1997;29(3):390-5. DOI: 10.1097/00005768-199703000-00015
8. Liberali R, Wilhelm Filho D, Petroski EL. Aerobic and anaerobic training sessions promote antioxidant changes in young male soccer players. MedicalExpress (São Paulo, online). 2016;3(1)M160107. DOI: 10.5935/MedicalExpress.2016.01.07
9. Callister R, Shealy MJ Fleck SJ, Dudley GA. Performance adaptations to sprint, endurance and both modes of training. J Strength Conditioning Res. 1988;2(3):46-51.
10. Bergman BC, Wolfel EE, Butterfield GE, Lopaschuk GD, Casazza GA, Horning MA et al. Active muscle and whole body lactate kinetics after endurance training in men. J Appl Physiol. 1999;87(5):1684-96. 11. Dubouchaud H, Butterfield GE, Wolfel EE, Bergman BC, Brooks GA.
Endurance training, expression, and physiology of LDH, MCT1, and MCT4 in human skeletal muscle. Am J Physiol Endocrinol Metab. 2000;278(4):E571-9.
12. Bonen A, McCullagh KJA, Putman CT, Hultman E, Jones NL, Heigenhauser GJF. Short-term training increases human muscle MCT1 and femoral venous lactate in relation to muscle lactate. Am J Physiol. 1998;274(1):E102-7.
13. Thomas C, Sirvent P, Perrey S, Raynaud E, Mercier J. Relationships between maximal muscle oxidative capacity and blood lactate removal after supramaximal exercise and fatigue indexes in humans. J Appl Physiol. 2004;97(6):2132-8. DOI: 10.1152/japplphysiol.00387.2004 14. Bonen A. The expression of lactate transporters (MCT1 and MCT4) in
heart and muscle. Eur J Appl Physiol. 2001;86(1):6-11. DOI: 10.1007/ s004210100516
15. Tabata I, Irisawa K, Kouzaki M, Nishimura K, Ogita F, Miyachi M. Metabolic profile of high-intensity intermittent exercises. Med Sci Sports Exerc. 1997;229(3):390-5. DOI: 10.1097/00005768-199703000-00015
16. Teixeira AAA, Silva PRS, Inarra LA. Descriptive study of the importance of functional evaluation as a previous procedure for physiological control of physical training in soccer players carried out in a pre-season period. Revista Bras Med Esporte. 1999;5(5):187-93. DOI: 10.1590/ S1517-86921999000500006.
17. Andreacci JL, LeMura LM, Cohen SL, Urbansky EA, Chelland SA, von Duvillard SP. The effect of frequency of encouragement on performance during maximal exercise testing. J Sports Sci. 2002;20(4):345-52. DOI: 10.1080/026404102753576125
18. Borg GAV. Psychophysical bases of perceived exertion. Med Sci Sports Exerc. 1982;14(5):377-81. DOI: 10.1249/00005768-198205000-00012 19. Skinner JS, McLellan TH. The transition from aerobic to anaerobic
metabolism. Res Q Exerc Sport. 1980;51(1):234-48. DOI: 10.1080/02701367.2013.802495
20. Thomas C, Perry S, Lambert K, Hugon G, Mornet D, Mercier J. Monocarboxylate transportes, blood lactate removal after supramximal exercise, and fatigue indexes in humans. J Appl Physiol. 2005; 98(3);804-9. DOI: 10.1152/japplphysiol.01057.2004
21. Tanner RK, Fuller KL, Ross ML. Evaluation of three portable blood lactate analysers: Lactate Pro, Lactate Scout and Lactate Plus. Eur J Appl Physiol. 2010;109(3):551-9. DOI: 10.1007/s00421-010-1379-9 22. Tanaka H, Monahan KD, Seals DR. Age - Predicted maximal heart
revisited. J Am Coll Cardiol. 2001;37(1):153-6. DOI: 10.1016/S0735-1097(00)01054-8
23. Tonnessen E, Hem E, Leirstein S, Haugen T, Seiler S. Maximal aerobic power characteristics of male professional soccer players. 1989-2012. Int J Sports Physiol Perform. 2013;8(3):323-9.
24. Balikian P, Lourenção A, Ribeiro LFP, Festuccia WTL, Neivas CM. Maximal oxygen uptake and anaerobic threshold in professional soccer players: comparison between different positions. Rev Bras Med Esporte. 2002; 8(2):32-6. DOI: 10.1590/S1517-86922002000200002.
25. Silva ASR, Santos FNC, Santhiago V, Gobatto CA. Comparison between invasive and non-invasive methods for the determination of the aerobic capacity of professional soccer players. Rev Bras Med Esporte. 2005;11(4):233-7. DOI: 10.1590/S1517-86922005000400003 26. Taoutaou, Granier P, Mercier B, Mercier J, Ahmaidi S, Prefaut C. Lactate
kinetics during passive and partially active recovery in endurance and sprint athletes. Eur J Appl Physiol Occup Physiol. 1996; 73(5):465-70. DOI: 10.1007/BF00334425
27. Bangsbo J, Iaia FM, Krustrup P. Metabolic response and fatigue in soccer. Int J of Sports Physiol and Perform. 2007;2(2):111-27.
28. Reilly T. The Science of Training - Soccer. A scientific approach to developing strength, speed and endurance. London: Routledge, 2007. 29. Krustrup P, Mohr M, Steensberg A, Bencke J. Muscle and blood metabolites during a soccer game: implications for sprint performance. Med Sci Sports Exerc. 2006;38(6):1165-74. DOI: 10.1249/01. mss.0000222845.89262.cd
30. Gharbi Z, Dardouri W, Haj-Sassi R, Chamari K, Souissi N. Aerobic and anaerobic determinants of repeated sprint ability in team sports athletes. Biol Sport. 2015;32(3):207-12. DOI: 10.5604/20831862.1150302 31. Bangsbo J, Mohr M, Krustrup P. Physical and metabolic demands
of training and match-play in the elite soccer player. J Sports Sci. 2006;24(7):665-74. DOI: 10.1080/02640410500482529