http://dx.doi.org/10.1590/1519-6984.07912 Original Article
Increased lactate threshold after five weeks of
treadmill aerobic training in rats
Brito Vieira, WH.
a*, Halsberghe, MJE.
b, Schwantes, MLB.
b, Perez, SEA.
c, Baldissera, V.
c,
Prestes, J.
d, Farias, DL.
dand Parizotto, NA.
eaDepartment of Physical Therapy, Federal University of Rio Grande do Norte – UFRN, Campus Universitário Lagoa Nova,
CEP 59072-970, Av. Senador Salgado Filho, 3000, Natal, RN, Brazil
bLaboratory of Molecular Evolution, Department de Genetics and Evolution, Federal University of São Carlos – UFSCar,
Rodovia Washington Luís, Km 235, CP 676, CEP 13565-905, São Carlos, SP, Brazil
cLaboratory of Exercise Physiology, Department of Physiological Science, Federal University of São Carlos – UFSCar,
Rodovia Washington Luís, Km 235, CP 676, CEP 13565-905, São Carlos, SP, Brazil
dGraduation Programme on Physical Education, Catholic University of Brasilia – UCB, Campus I, Qs 07 Lote 01 EPCT,
Águas Claras, Taguatinga, CEP 71966-700, Brasília, DF, Brazil
eLaboratory of Electrothermophototherapy, Department of Physical Therapy, Federal University of São Carlos – UFSCar,
Rodovia Washington Luís, Km 235, CP 676, CEP 13565-905, São Carlos, SP, Brazil
*e-mail: [email protected]
Received: May 17, 2012 – Accepted: March 4, 2013 – Distributed: May 31, 2014
(With 4 figures)
Abstract
The aim of the present study was to analyse the lactate threshold (LT) changes in rats submitted to an aerobic treadmill-training programme. Twenty-five Wistar rats were divided into two groups: a sedentary control group (CG), and a trained group (TG) submitted to an aerobic training during 5 weeks. All the animals were submitted to an incremental treadmill exercise test in order to determine LT. There was an increase in the maximum running speed in the TG (from 32.25 ± 1.27 to 47.75 ± 3.13 m.min–1 – p = 0.001), and running speed at LT (from 26.21 ± 1.15 to 35.30 ± 2.24 m.min–1
– p = 0.004), a part from the reduction in blood lactate at LT. LT can be determined in rats, and aerobic training induced positive oxidative physiological adaptations in the animals.
Keywords: anaerobic threshold, running speed, blood lactate, exercise.
Aumento do limiar de lactato após cinco semanas de
treinamento aeróbio em esteira em ratos
Resumo
O objetivo do presente estudo foi analisar as mudanças no limiar de lactato (LL) em ratos submetidos a um programa de treinamento aeróbio em esteira. Vinte e cinco ratos Wistar foram divididos em dois grupos: um grupo controle sedentário (CG), e um grupo treinado (GT) submetido a um treinamento aeróbio durante 5 semanas. Todos os animais foram submetidos a um teste de exercício incremental em esteira, a fim de determinar o LL. Houve um aumento na velocidade máxima de corrida no GT (de 32,25 ± 1,27 para 47,75 ± 3,13 m.min–1 - p = 0,001), e velocidade de corrida no LL (de
26,21 ± 1,15 para 35,30 ± 2,24 m.min–1 - p = 0,004), além da redução na concentração de lactato no LL. O LL pode
ser determinado em ratos e o treinamento aeróbio induziu a adaptações fisiológicas oxidativas positivas nos animais. Palavras-chave: limiar anaeróbio, velocidade de execução, lactato sanguíneo, exercício.
1. Introduction
The maximal oxygen consumption (VO2max) and anaerobic threshold (AT) are parameters that have been widely considered as hallmarks of aerobic fitness for athletes (Svedahl and MacIntosh, 2003), physically active individuals (Simões et al., 2003) and, to a minor scale, for special populations (Belli et al., 2007; Motta et al., 2010; Sales et al., 2011). AT can be used in specific aerobic evaluations and is considered a gold standard parameter
for exercise prescription, including cardiovascular risks groups (Belli et al., 2007; Farsidfar et al., 2008).
and Van Schuylenbergh et al. (2004) found AT to be highly correlated and not different from the lactate threshold (LT).
In human subjects blood lactate concentration increases exponentially with exercise intensity. The inflexion point on the curve of blood lactate vs workload is known as LT (the point in which blood lactate systematically rises during an exercise of progressive effort). Even so, anaerobiosis as a cause of the accelerated lactate production has been questioned (Pilis et al., 1993; Powers and Howley, 2000; Voltarelli et al., 2002; Wilmore and Costill, 2001).
Historically, the rise of blood lactate levels has been considered an indication of the supplemental anaerobic metabolism in contracting muscles, as a result of larger oxygen demand by the muscle cells and, consequently, lower oxygen availability (Brooks, 2000; Powers and Howley 2000; Spriet, et al., 2000; Wasserman 1984). However, other factors may be involved in the determination of lactate accumulation in blood, especially the greater recruitment of fast twitch fibers and the reduction in that rate of lactate removal.
LT occurs within the range of submaximal exercise intensities, normally between 50 and 80% of the maximum load and at a blood lactate concentration approximately to 4 mmol.l–1. However, it has been showed that lactate
levels may present a large individual variation (Pilis et al., 1993). In untrained individuals, LT occurs at around 50-60% of the maximum load, while in trained ones it occurs at higher workloads (65-80% of the VO2max) (Powers and Howley, 2000).
Thus, evidence suggests that the accumulation of lactate in blood is reduced in submaximal exercise after a period of endurance training, both in animal and human studies. The explanations for this benefit have been attributed to increased oxidative capacity, reduction of lactate production and a rise in lactate removal rate (Brooks, 2000; Gladden, 2000a; McDermott and Bonen, 1993; Spriet et al., 2000). The improvement in lactate removal may be associated with: 1) a rise in the use of lactate by other tissues, such as the liver, heart, skeletal muscle and kidneys; 2) a rise in gliconeogenesis in skeletal muscle cells and hepatocytes; 3) the use of lactate by oxidative fibers; and 4) increased lactate transport through the sarcolemma (Gladden 2000a, 2000b; McDermott and Bonen 1993).
Holloszy and Coyle (1984) suggest that the main metabolic consequence of aerobic training is a reduction in the rate of muscular glycogen usage and, therefore, a smaller production of lactate during submaximal exercise. Other authors suggest that a low level of blood lactate after endurance training reflects a high mitochondrial density, greater lactate use by skeletal muscle and optimisation of the oxidative pathway and, consequently, of oxygen offer for ATP production (Gladden 2000a; Spriet et al., 2000; Wasserman 1984).
Despite some attempts (Brooks, 2000; Pilis et al., 1993), the physiologic basis of LT has not been fully explained. Nevertheless, LT has important practical implications, such as performance prediction in sports and the controlling of training intensity. However, the
estimation of LT by serum lactate is invasive, and therefore is not always routinely used in humans. In this sense, considering the obvious limitations in the investigations with human subjects, an animal model would be important for a deeper insight into the physiological mechanisms underlying LT. Surprisingly, according our knowledge, the LT has not been widely explored in animal models (Cunha et al., 2008, 2009). So, the systematic verification of LT in animal models may contribute to the investigation of the physiological mechanisms that alter blood lactate levels during progressive exercise and to the ecological validation of training protocols in experimental studies.
In this manner, the purpose of this study was to analyse lactate threshold changes during a multistage treadmill exercise test in rats submitted to an aerobic treadmill-training programmeme.
2. Methods
2.1. Animals
Thirty male Wistar rats (Rattus novergicus var. albinus, Rodentia, Mammalia) from the Central Biotery were used, with 45 days and a mean body mass of 115 ± 12 g. The animals were housed in collective polypropylene cages, and were fed ‘‘ad libitum’’ with water and a balanced diet (Purina, Descalvado, São Paulo, Brazil). During the experiment period, they were kept in a room with controlled temperature ranging from 22°-27°C and with a defined photoperiod of 12 hours of light and 12 hours of darkness. During the serum lactate dosage, five rats did not present an LT curve in one of the estimations and were discarded from the study.
2.2. Experimental proceedings
The animals were divided into two groups: The (CG) (n = 9) remained at rest without physical exercise training and TG (n = 16) was submitted to an aerobic treadmill training protocol that was performed daily (Sunday to Thursday) during 5 weeks. Both groups were submitted to an incremental exercise test (IET). CG performed two evaluations: before and after the training period (test-retest), while TG performed the tests on the day following the last day of weekly training (Friday), totalizing 5 measures, in which blood samples were collected to verify the LT of the animals. In the last day of the week (Saturday), animals were not submitted to any kind of procedure (rest). The TG underwent five evaluations in order to determine the time of an eventual physiological adaptation to training.
2.3. Instrumentation
The aerobic training and IET were performed in a three-part ergometric treadmill for small-sized animals, each part with 7 individual lanes that allowed the animals to train isolated. The treadmill was activated by a 24-Volt CW motor, which allowed the control and selection of a pre-determined velocity in m.min–1. In order to measure
2.4. Pre-training (adaptation and conditioning)
Both CG and TG groups were submitted to a period of adaptation to the treadmill equipment. Next, they were conditioned to walk/run during 6 consecutive days, initially at a very low speed (6 m.min–1) with 0% inclination during
5 minutes, until they reached 10 minutes of exercise at a speed of 17.5 m.min–1 on the 6th day. The sessions took
place at the early dusk period in which rats, with natural nocturnal habits are more active (between 07:00-08:00 p.m.). The training room was also kept at a dim environment allowing a better adaptation of the animals to the treadmill and a overall training performance.
2.5. Training protocol
The training protocol consisted of a variable speed progression until a predetermined goal for the last day of the training week was reached, as shown in Table 1. These step by step increments targeted a better adaptation of the animals to the training routine, therefore favoring a predominance of aerobic training zone, as recommended by Moraska et al. (2000). Occasionally, a stimulus of the “to shove” kind was applied in the animals’ tails during a training session to encourage continuous running if the pace of the animal slowed below treadmill rate.
2.6. Incremental test
The IET for the evaluation of LT followed a protocol with increasing crescent speeds on an ergometric treadmill. Before the beginning of the IET a first blood sample (baseline) was taken. Afterwards, the animals were submitted to 3-minute physical effort stages, followed by 2-minute intervals for blood sampling. The initial speed was 13m.min–1, followed by increments of 4m.min–1 in
each 3-minute stage, with constant inclination of 10%, until exhaustion, according to procedures suggested by Langfort et al. (1996) and Pilis et al. (1993). LT was visually identified by the blood lactate concentration versus workload curve, considering the workload corresponding to the inflection point of blood lactate concentration within a range of 2-4mM (Cunha et al., 2008, 2009) (Figure 1).
2.7. Blood collection and lactate analysis
After sterilisation procedures with alcohol, the distal portion of the animal’s tail was sectioned with a little prick and 25 ml of blood were collected after each 3 minutes stage over the incremental test in heparinised micro capillary tubes. The samples were deposited in Eppendorf tubes
containing 50 ml of sodium fluoride 1%. Blood lactate concentrations were measured by the electroenzimatic method using a blood lactate analyser (Yellow Springs Instruments-USA 1500-STAT). The material collected was maintained in ice during the whole proceedings, but shortly after was stored in a freezer for later lactate analysis. After sampling, the wound from the snip was heparinised in order to prevent blood coagulation and to avoid new snips at each sampling procedure, which could stress the animal.
2.8. Statistical analysis
The results are presented by means and standard error of mean (SEM). First, Shapiro-Wilks’ test was used to verify the normality of the variables. With the data distribution certified, test-retest measures (body weight, maximum speed, lactate threshold and blood lactate) was used to establish comparisons between groups with the independent samples T-test or Mann-Whitney test`s according to data normality; Repeated-measures ANOVA was used to analyse differences between the evaluations of the TG, followed of a post-hoc Bonferroni`s test. The statistic level of significance was set at 5% (p ≤ 0.05).
3. Results
3.1. Animals’ characterization
Animals from the TG completed the aerobic treadmill training protocol. In the beginning of the study, the animals presented a mean body weight of 114.61 ± 12 g. After five weeks of training, the mean body weight was 276.58 ± 27
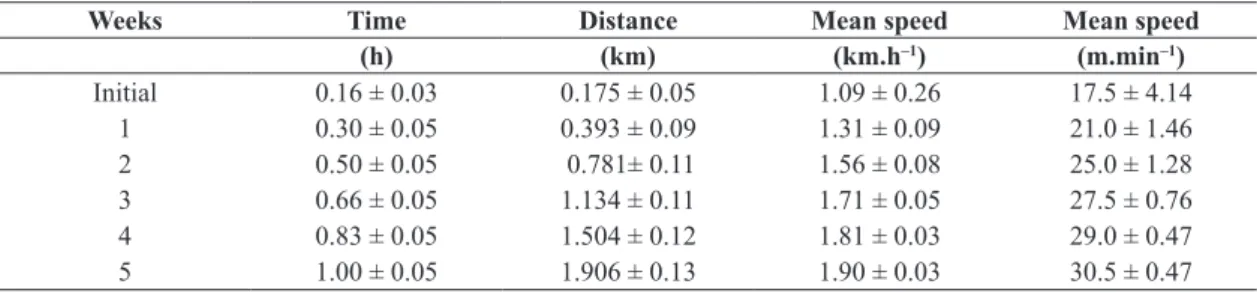
Table 1. Weekly goals of the variables taking from the rats during the physical training sections. Values express as mean and
(±) standard deviation (n=16).
Weeks Time Distance Mean speed Mean speed
(h) (km) (km.h–1) (m.min–1)
Initial 0.16 ± 0.03 0.175 ± 0.05 1.09 ± 0.26 17.5 ± 4.14
1 0.30 ± 0.05 0.393 ± 0.09 1.31 ± 0.09 21.0 ± 1.46
2 0.50 ± 0.05 0.781± 0.11 1.56 ± 0.08 25.0 ± 1.28
3 0.66 ± 0.05 1.134 ± 0.11 1.71 ± 0.05 27.5 ± 0.76
4 0.83 ± 0.05 1.504 ± 0.12 1.81 ± 0.03 29.0 ± 0.47
5 1.00 ± 0.05 1.906 ± 0.13 1.90 ± 0.03 30.5 ± 0.47
Figure 1. Blood lactate (mmol/l) in relation to the treadmill
g, exhibiting a gain of 58.56% (p < 0.01). There was no statistically significant difference between groups.
3.2. Maximum speed
The maximum speed achieved by the animals of the CG changed from 28.56 ± 1.04 to 30.33 ± 0.54 m.min–1
– p = 0.2481, comparing test-retest respectively. The animals of the TG showed in the first evaluation, which occurred at the end of the first week, a value of 32.25
± 1.27 m.min–1. During the third, fourth and fifth evaluations,
the animals showed a statistically significant increase in maximum velocity (44.25 ± 2.31; 46.00 ± 2.97 and 47.75
± 3.13 m.min–1 – p = 0.0001, respectively), as illustrated
in Figure 2. Furthermore, after the training period TG exhibited a higher increase in maximal speed as compared with CG (p = 0.0001).
3.3. Lactate Threshold (LT)
There was no statistically significant change in the running speed at LT achieved by the CG changed from 20.50 ± 0.92 to 20.15 ± 1. m.min–1 – p = 0.8498). The animals
of the TG exhibited a statistically significant rise after the training period (from 26.21 ± 1.15 to 35.30 ± 2.24 m.min–1
– p = 0.0001), as illustrated in Figure 3. TG presented a significant higher increase in the running speed at LT compared with CG (p = 0.0001).
3.4. Blood lactate
As illustrated in Figure 4, the mean values of blood lactate at LT of CG changed from 2.1 ± 0.18 to 2.55 ± 0.45 mmol/l – p = 0.7834. The animals of TG showed lower values after the training period (from 2.22 ± 0.53 to 1.23 ± 0.14 mmol/l – p = 0.0001). There was statistical difference after the training period between the experimental groups (p = 0.0001).
We found a moderate (r = 0.51) and high correlation (0.94) between the maximal running speed and the running speed at LT after the training period in CG and TG, respectively.
4. Discussion
This study demonstrates that the physiological adaptations relative to the LT determination in rats under aerobic treadmill training and submitted to incremental efforts occur in a manner similar to those described for humans, as found by Pilis et al. (1993). This similarity allows professionals involved especially in sports to have a more accurate determination of the effort intensity where an accumulation of blood lactate initiates, facilitating optimised aerobic performance evaluation and prescription of a determined physical training for experimental studies, healthy individuals and/or athletes.
The body weight gain observed after the adaptation and training periods in the TG was evident considering the duration of the experiment and the fact that the animals were fed constantly with no restriction. Another possible related factor consists in the muscular mass gain, since the animals were submitted to incremental intensity efforts
during the tests to determine LT, disregarding the actual progressive character of the rise in running intensity, as suggested by Moraska et al. (2000).
LT occurred at approximately 70-80% of the maximum speed. According to Powers and Howley (2000), LT occurs in a higher percentage in trained subjects than in sedentary, occurring at 65-80% of the maximum load, different from the values observed in the study of Pilis et al. (1993), with sedentary animals.
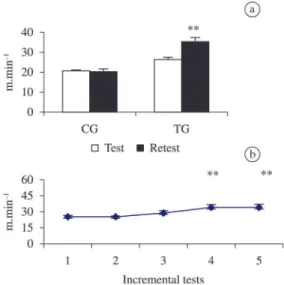
Figure 2. Maximum running speed of test-retest data
between the two groups studied (a) and during the five evaluations of the incremental test of TG (b). Values are mean and standard error of mean (SEM). (** statistical significance p < 0.01 compared to moment test and CG).
Figure 3. Running speed at LT of test-retest data between
At the end of the five weeks of training, there was a enhance in the exercise capacity at a higher speed (Figure 2), a deviation of the LT to a higher effort level (Figure 3) and a reduction of the blood lactate at LT (Figure 4) in the trained animals. These findings may be associated to physiological and muscular adaptations translated by the rise in oxidative capacity such as: the greater mitochondrial content in skeletal muscle, heart and liver, and a greater gliconeogenesis capacity, as suggested by other studies (Brooks, 2000; Gladden, 2000a; Hatta 1990; Spriet et al., 2000).
Holloszy and Coyle (1984) suggest that one of the consequent adaptations to aerobic exercise consists of a smaller production of serum lactate. McDermott and Bonen (1993) suggest that after a period of endurance training a greater lactate removal also occurs as a result of a greater efficiency of the sarcolemma in the transport of this metabolite for its oxidation in the skeletal muscle. This mechanism can at least in part explain the lower lactate values in TG. For example, Pilis et al. (1993) observed that during an incremental treadmill run test, LT occurred when the blood lactate concentration was approximately 4.0 mmol/L. This suggests that the level of physical activity (trained or sedentary) may affect the values of blood lactate at LT.
In addition, Voltarelli et al. (2002) suggests the hypothesis that the value of blood lactate concentration at the LT may be protocol dependent. However, the concept of LT assumes that an exercise carried out at the intensity below at the threshold can be performed for a long time without accumulation of lactate in blood, whilst during exercise exceeding the threshold blood lactate concentration progressively increases as the effort continues. This concept was observed in the present study on the experimental model, with values of LT occurring around 2 a 4 mmol/l,
immediately before the individual maximum speed was reached. According to Cunha et al. (2008, 2009) this this is a validated to method to determine LT in rats. The adaptations found in the present study were also observed in other experimental models. Ferraz et al. (2008) analysed the effects of an aerobic training on lactate and glucose blood levels in equines and found reduced blood lactate after training. The above mentioned authors also concluded that LT is predictor of aerobic capacity, and found a association of the lactate inflection point with glucose dynamics during a IET. Similarly, Trilk et al. (2002) revealed that a conditioning programme based on LT improved physical fitness after six weeks in equines.
These adaptive responses were also found in humans (Caputo et al., 2002; Amann et al., 2006).
5. Conclusion
The findings of this study revealed that:
- After the training period, there was a rise in the maximum speed, a deviation of the LT to a higher effort level and a slight reduction of the serum lactate concentration in TG;
- Animal models become important as a way to contribute for the elucidation of the LT physiological mechanisms and, consequently, optimise the evaluations and prescription of a physical training programmeme.
References
AMANN, M., SUBUDHI, AW. and FOSTER, C., 2006. Predictive validity of ventilatory and lactate thresholds for cycling time trial performance. Scandinavian Journal of Medicine & Science in Sports, vol. 16, no. 1, p. 27-34. http://dx.doi.org/10.1111/j.1600-0838.2004.00424.x. PMid:16430678
BELLI, T., ACKERMANN, MA., RIBEIRO, LF., LANGEANI, R., GALDINO DA SILVA, R. and BALDISSERA, V., 2007. Lactate and ventilatory thresholds in type 2 diabetic women. Diabetes Research and Clinical Practice, vol. 76, no. 1, p. 18-23. http://dx.doi.org/10.1016/j.diabres.2006.07.028. PMid:16959365 BROOKS, GA., 2000. Intra- and extra-cellular lactate shuttles. Medicine and Science in Sports and Exercise, vol. 32, no. 4, p. 790-799. http://dx.doi.org/10.1097/00005768-200004000-00011. PMid:10776898
CAPUTO, F., MACHADO, RS., LUCAS, RD. and DENADAI, BS., 2002. Efeitos de oito semanas de treinamento de natação no limiar anaeróbio determinado na piscina e no ergômetro de braço. Revista Brasileira de Medicina do Esporte. vol. 8, no. 1, p. 7-12. http://dx.doi.org/10.1590/S1517-86922002000100002
CUnHA, RR., DE CARVALHO CUnHA, VN., SEGUNDO,
PR., MOREIRA, SR., KOKUBUN, E., CAMPBELL,
CSG., JACÓ DE OLIVEIRA, R. and SIMõES, HG., 2009.
Determination of the lactate threshold and maximal blood lactate steady state intensity in aged rats.Cell Biochemistry and Function, vol. 27, no. 6, p. 351-357. http://dx.doi. org/10.1002/cbf.1580. PMid:19585487
Figure 4. Blood lactate at LT of test-retest data between the
CUnHA, VNC., CUnHA, RR., SEGUNDO, PR., MOREIRA, SR. and SIMõES, HG., 2008. Swimming Training at Anaerobic Threshold Intensity Improves the Functional Fitness of Older Rats. Brazilian Journal of Sports Medicine, vol. 14, no. 6, p. 533-538. http://dx.doi.org/10.1590/S1517-86922008000600012 DENADAI, BS., FIGUEIRA, TR., FAVARO, OR. and GONçALVES, M. 2004. Effect of the aerobic capacity on the validity of the anaerobic threshold for determination of the maximal lactate steady state in cycling. Brazilian Journal of Medical and Biological Research, vol. 37, no. 10, p. 1551-1556. http://dx.doi.org/10.1590/ S0100-879X2004001000015. PMid:15448877
FARSIDFAR, F., KASIKCIOGLU, E., OFLAz, H., KASIKCIOGLU, D., MERIC, M. and UMMAN, S., 2008. Effects of different intensities of acute exercise on flow-mediated dilatation in patients with coronary heart disease. International Journal of Cardiology, vol. 124, no. 3, p. 372-374. http://dx.doi.org/10.1016/j. ijcard.2006.11.243. PMid:17368830
FERRAz, GC., D’ANGELIS, FHF., TEIXEIRA-NETO, AR., FREITAS, EVV., LACERDA-NETO, JC. and QUEIROz-NETO, A., 2008. Arquivo Brasileiro de Medicina Veterinária e Zootecnia, vol. 60, p. 256-259. http://dx.doi.org/10.1590/S0102-09352008000100035.
GLADDEN, LB., 2000a. Muscle as a consumer of lactate. Medicine and Science in Sports and Exercise, vol. 32, no. 4, p. 764-771. http://dx.doi.org/10.1097/00005768-200004000-00008. PMid:10776895
-, 2000b. The role of skeletal muscle in lactate exchange during exercise: introduction. Medicine and Science in Sports and Exercise, vol. 32, no. 4, p. 753-755. http://dx.doi.org/10.1097/00005768-200004000-00006. PMid:10776893
HATTA, H., 1990. Oxidative removal of lactate after strenuous exercise. Annals of Physiological Anthropology, vol. 9, no. 2, p. 213-218. http://dx.doi.org/10.2114/ahs1983.9.213. PMid:2400462
HOLLOSzy, JO. and COYLE, EF., 1984. Adaptations of skeletal muscle to endurance exercise and their metabolic consequences. Journal of Applied Physiology, vol. 56, no. 4, p. 831-838. PMid:6373687.
LANGFORT, J., zARzECzNY, R., PILIS, W.,
KACIUBA-UśCIłkO, H., NAzAR, K. and PORTA, S., 1996. Effect of sustained hyperadrenalinemia on exercise performance and lactate threshold in rats. Comparative Biochemistry and Physiology, vol. 114, no. 1, p. 51-55. http://dx.doi.org/10.1016/0300-9629(95)02087-X. PMid:8925426
MCDERMOTT, JC. and BONEN, A., 1993. Endurance training increases skeletal muscle lactate transport. Acta Physiologica Scandinavica, vol. 147, no. 3, p. 323-327. http://dx.doi. org/10.1111/j.1748-1716.1993.tb09505.x. PMid:8475758 MORASKA, A., DEAK, T., SPENCER, RL., ROTH, D. and
FLESHnER, M., 2000. Treadmill running produces both positive and negative physiological adaptations in Sprague-Dawley rats. American Journal of Physiology - Regulatory, Integrative and Comparative Physiology, vol. 279, no. 4, p. R1321-R1329. PMid:11004000.
MOTTA, DF., LIMA, LC., ARSA, G., RUSSO, PS., SALES, MM., MOREIRA, SR., MORAIS, PK., ALMEIDA, WS., ARAUJO, RC., MORAES, MR., PESQUERO, JL., SIMõES, HG. and CAMPBELL, CSG., 2010. Effect of type 2 diabetes on plasma
kallikrein activity after physical exercise and its relationship to post-exercise hypotension. Diabetes & Metabolism, vol. 36, no. 5, p. 363-368. http://dx.doi.org/10.1016/j.diabet.2010.03.008. PMid:20579916
PILIS, W., zARzECzNY, R., LANGFORT, J., kACIUBA-UśCIz. XL, LKO, H ., NAzAR, K. and WOJTYNA, J., 1993. Anaerobic threshold in rats. Comparative Biochemistry and Physiology, vol. 106, no. 2, p. 285-289.
http://dx.doi.org/10.1016/0300-9629(93)90513-4. PMid:7902799
POWERS, SK. and HOWLEy, ET., 2000. Text book of Exercise Physiology: Theory and Application to Fitness and Performance. 6th ed. São Paulo: Manole Company. Chapter 20.
SIMõES, HG., CAMPBELL, CSG., kUSHnICk, MR., NAKAMURA, A., KATSANOS, CS., BALDISSERA, V. and MOFFATT, RJ., 2003. Blood glucose threshold and the metabolic responses to incremental exercise tests with and without prior lactic acidosis induction. European Journal of Applied Physiology, vol. 89, no. 6, p. 603-611. http://dx.doi.org/10.1007/s00421-003-0851-1. PMid:12759761
SALES, MM., CAMPBELL, CSG., MORAIS, PK., ERNESTO, C., SOARES-CALDEIRA, LF., RUSSO, P., MOTTA, DF., MOREIRA, SR., NAKAMURA, FY. and SIMõES, HG., 2011. Noninvasive method to estimate anaerobic threshold in individuals with type 2 diabetes. Diabetology & Metabolic Syndrome, vol. 3, no. 1, p. 1-8. http://dx.doi.org/10.1186/1758-5996-3-1. PMid:21226946 SPRIET, LL., HOWLETT, RA. and HEIGEnHAUSER, GJF., 2000. An enzymatic approach to lactate production in human skeletal muscle during exercise. Medicine and Science in Sports and Exercise, vol. 32, no. 4, p. 756-763. http://dx.doi.org/10.1097/00005768-200004000-00007. PMid:10776894
SVEDAHL, K. and MACInTOSH, BR., 2003. Anaerobic threshold: the concept and methods of measurement. Canadian Journal of Applied Physiology, vol. 28, no. 2, p. 299-323. http:// dx.doi.org/10.1139/h03-023. PMid:12825337
TRILK, JL., LINDNER, AJ., GREENE, HM., ALBERGHInA, D. and WICKLER, SJ., 2002. A lactate-guided conditioning programme to improve endurance performance. Equine Veterinary Journal supplement, vol. 34, no. 34, p. 122-125. PMid:12405671.
VAn SCHUyLEnBERGH, R., VANDEN EYNDE, B. and
HESPEL, P., 2004. Correlations between lactate and ventilatory thresholds and the maximal lactate steady state in elite cyclists. International Journal of Sports Medicine, vol. 25, no. 6, p. 403-408. http://dx.doi.org/10.1055/s-2004-819942. PMid:15346226 VOLTARELLI, FA., GOBATTO, CA. and MELLO, MAR., 2002. Determination of anaerobic threshold in rats using the lactate minimum test. Brazilian Journal of Medical and Biological Research, vol. 35, no. 11, p. 1389-1394. http://dx.doi.org/10.1590/ S0100-879X2002001100018. PMid:12426640