RESEARCH ARTICLE
Short Index of Job Satisfaction: Validity
evidence from Portugal and Brazil
Jorge Sinval1,2, João Maroˆ coID1
*
1 William James Center for Research, ISPA—Instituto Universita´ rio, Lisbon, Portugal, 2 Business Research Unit (BRU-IUL), Instituto Universita´rio de Lisboa (ISCTE-IUL), Lisbon, Portugal
*jpmaroco@ispa.pt
Abstract
Job satisfaction is an important construct that is known to be associated with workers’ per-formance and wellbeing. As such, to properly measure it, one must use adapted measures that show adequate validity evidence for the desired context. Such measures should prefer-ably be short to allow the parsimonious use of various measures/constructs in the same data collection. The aim of this paper is to adapt the Portuguese version for Brazil and Portu-gal of the Short Index of Job Satisfaction (SIJS). The SIJS is a psychometric instrument that measures job satisfaction through five items. A cross-sectional study was conducted with two multi-occupational workers samples, one from Brazil (n = 599) and one other from Por-tugal (n = 572). The SIJS presented good validity evidence based on its internal structure, namely dimensionality, reliability, and measurement invariance across countries and sexes. It also revealed to be positively correlated with work engagement, and quality of work life (convergent evidence). It also has shown to be negatively associated with burnout (discrimi-nant evidence). The SIJS showed promising validity evidence. The SIJS can be useful to be used together with other instruments, due to its small number of items, producing data with good psychometric properties.
Introduction
Job satisfaction has a long history of proliferating organizational research [1] being one of the most–if not the most–studied variables in business science [2]. It was brought into the lime-light in the 30s [3,4] being the most studied variable in the organizational behavior context [5,6]. It has various definitions. The most cited is the one provided by Locke [7], which consid-ered job satisfaction as a positive emotional state that results from the worker’s job associated experiences. Researchers can be interested in an overall measure of job satisfaction or particu-lar job satisfaction facets, being the first usually preferred [8]. Overall job satisfaction can be seen as a formative construct, aggregating satisfaction with specific facets of the job [9]. Such approach appears as a solution to measure the overarching degree of satisfaction with various job attributes, coming with various different flavors [8].
Due to its complexity–influenced by various factors–this construct is frequently used in work and organizational studies together with other dimensions. The factors that influence job
a1111111111 a1111111111 a1111111111 a1111111111 a1111111111 OPEN ACCESS
Citation: Sinval J, Maroˆco J (2020) Short Index of Job Satisfaction: Validity evidence from Portugal and Brazil. PLoS ONE 15(4): e0231474.https://doi. org/10.1371/journal.pone.0231474
Editor: Sergio A. Useche, Universitat de Valencia, SPAIN
Received: October 8, 2019 Accepted: March 24, 2020 Published: April 14, 2020
Peer Review History: PLOS recognizes the benefits of transparency in the peer review process; therefore, we enable the publication of all of the content of peer review and author responses alongside final, published articles. The editorial history of this article is available here:
https://doi.org/10.1371/journal.pone.0231474
Copyright:© 2020 Sinval, Maroˆco. This is an open access article distributed under the terms of the
Creative Commons Attribution License, which permits unrestricted use, distribution, and reproduction in any medium, provided the original author and source are credited.
Data Availability Statement: All relevant data are within the manuscript and its Supporting Information files.
Funding: JS and JM secured funding from the Portuguese Science Foundation (Grant number: UID/PSI/04810/2019)https://www.fct.pt/. This
satisfaction can be considered both at the individual (mainly one’s values, but also personality and mental health) and the organizational level (work, payment, promotions, peers/colleagues, supervisor, top leadership and benefits/policies) [7]. As such, a higher quality of work-life bal-ance is expected to produce higher job satisfaction [10–12] while more job satisfaction is posi-tively related to greater organizational commitment [13]. In the opposite direction, more stress in the workplace [14] and more surface acting [15] are related to less job satisfaction. It has been observed that workers have their job satisfaction levels decreasing parallel to the increasing tenure in a specific organization, while for people getting older–and transitioning of the organization–their satisfaction increases [16]. Lack of job satisfaction can lead to turn-over [17–19], negative mood [20], reduced health and life happiness [7]. It can be related to several withdrawal behaviors [6] as absenteeism, presenteeism, and performance [21–24]. The relation with performance has long been considered the “holy grail” of satisfaction research [25] However, such relation is not unidirectional, lower performance can also lead to less job satisfaction [7]. It also has relations with several other job behaviors [26].
Despite existing many different psychometric instruments to measure the job satisfaction construct, some criticism has been made about the way this construct has been measured [27], since few of those instruments have shown satisfactory validity evidence [14]. Some of the most widespread measures are: the Index of Job Satisfaction [28] which also has a short version of five items (Short Index of Job Satisfaction [SIJS]) [29]; the Measure of Job Satisfaction (MJS) [30]; the Job in General Scale (JIG) [31] which is part of the Job Descriptive Index (JDI) [32]; the Andrew and Withey Job Satisfaction Questionnaire [33]; the Job Satisfaction Survey (JSS) [34]; the Minnesota Satisfaction Questionnaire [35]; the Michigan Organizational Assessment Questionnaire Job Satisfaction Subscale (MOAQ-JSS) [36]; and the Generic Job Satisfaction Scale (GJSS) [37]. Some of those measures are lengthy like the MJS (38 items) [30], the JIG with 18 items [31], the JSS with 36 items, or the MSQ with 100 items in the long-form, and with 20 items in the short form [35]. Other measures are shorter, like the SIJS (comprising five items), the MOAQ-JSS with three items, the Andrew and Withey Job Satisfaction with five items, or the GJSS with ten items. Van Saane et al. [14] reviewed several measures of job satis-faction and concluded that only seven of 29 reviewed measures fulfilled the authors’ minimum criteria of an adequate instrument (i.e. internal consistency and validity evidence). In such a wide variety of measures, some are specific for a specific job (e.g. MJS was developed for nurses) while others can be used with multiple occupations (e.g. SIJS, JIG, JSS).
Some instruments measure job satisfaction as a unidimensional global measure, while oth-ers assume it a multidimensional construct. Examples of former are the SIJS, the JIG, the MOAQ-JSS or the Andrew and Withey Job Satisfaction Questionnaire. While the latter has as examples the MSQ, the GJSS, the JSS, or the MJS. Global measures are more parsimonious than multidimensional constructs. It is expected that the latter explains more variance, how-ever, it might be difficult to sort out if the broader measure assures that it is measuring the con-struct, or if it is also measuring elements of its causal network [38]. If one aims to measure specific job satisfaction areas, the multidimensional instruments will be more useful, since they measure job satisfaction facets. Although, the global scales are useful to have a general measure of job satisfaction [31].
There are also single-item measures, which some authors find useful in specific situations [27,39] and which can be more cost-effective than multi-item measures [40]. Despite single-item measures’ usefulness and correlation with scale measures–from a psychometric perspec-tive, multiple-item measures are preferable [41,42]. Single-item measures do not allow to obtain internal consistency estimates, using them to measure psychological constructs can be seen as a fatal error [43]. As such, short measures that approach job satisfaction from a general perspective–as the SIJS–without entering in the peculiarities and the specifics of certain work was also produced with the support of
Infraestrutura Nacional de Computac¸ão Distribuı´da (INCD); funded by Fundac¸ão para a Ciência e a Tecnologia (FCT) and Fundo Europeu de Desenvolvimento Regional (FEDER) under the project 22153-01/SAICT/2016).
Competing interests: The authors have declared that no competing interests exist.
occupations might be preferable to single-item measures. These short multi-item measures maintain the overall perspective of the measure with the advantage of obtaining the latent mea-sure through the necessary multiple items. It is preferable to select a short meamea-sure that has demonstrated validity evidence in the desired population of the study, then to adapt or select some items of a longer instrument [44]. One of these short measures is the SIJS which has some advantages over other measures. It is freely available, has shown good psychometric properties and has been used in different cultures [45–48].
No studies adapting the SIJS to Portugal or Brazil were found, as such, the aim of this study is: i) adapt the SIJS in its Portuguese version for Brazil and Portugal and assess its validity evi-dence; and, ii) compare the job satisfaction levels between sexes and countries. Following the guidelines of theStandards for Educational and Psychological Testing [49] two of the possible five sources of validity evidence for psychological instruments will be analyzed. The first is based on the internal structure which refers to the reliability of the scores, dimensionality and measurement invariance. The second source of validity is based on relation to other variables. Regarding the validity evidence based on the internal structure, three hypotheses were defined. Previous studies suggest that the SIJS is a single-factor measure suitable to obtain a general job satisfaction measure, presenting satisfactory validity evidence [46,50,51]. Hypothesis 1 states that the SIJS maintains its original dimensionality (five items, one factor) supported by facto-rial validity evidence.
Various studies showed that the SIJS presents good reliability, namely, internal consistency estimates [52–55]. Hypothesis 2 assumes that the SIJS presents adequate evidence validity in terms of reliability of the scores.
No study was found testing measurement invariance of the SIJS between sexes or countries. Nevertheless, there is evidence that other psychological instruments used in the organizational context achieved measurement invariance among countries (i.e. Brazil and Portugal) and among sexes in the two countries [56,57]. Brazil and Portugal share more than the same lan-guage, they exchange culture and they share human capital. As such, it will be likely that the SIJS has measurement invariance between countries and sexes. Thus, Hypothesis 3 states that SIJS will hold measurement invariance (at least scalar invariance) among Brazil and Portugal, and sexes within each of the countries.
The second source of validity evidence, based on the relationships with other variables, will be checked using quality of work-life, burnout, and work engagement measures. Lack of Job satisfaction is expected to be a predictor of burnout [58–60]. On the other hand, work engage-ment has shown to predict job satisfaction [61–63] and by the quality of work-life [12]. Never-theless, this source of evidence is intended to assure that job satisfaction is distinguished from associated concepts [64]. Altogether, Hypothesis 4 states that the SIJS shows adequate validity evidence based on the relation to other variables—more specifically—nomological evidence [65]. As such, it hypothesized that the SIJS will present discriminant evidence with burnout (Hypothesis 4.1), and convergent evidence with work engagement (Hypothesis 4.2) and qual-ity of work-life (Hypothesis 4.3).
Previous research studied differences among sexes for job satisfaction among countries and sexes. The meaning attached to work seems to not differ significantly among countries [6]. However, Bozionelos and Kostopoulos [66] indicated that different countries might have dif-ferences in their job satisfaction levels. Such difdif-ferences have been observed between several countries [67–69]. Pichler and Wallace [70] found that differences mainly result from compo-sition and individual-level factors of each countries’ workforce, instead of inherent cultural and historic characteristics. While, on the other hand, Hauff, Richter, and Tressin [71] indi-cated that some job characteristics vary significantly between countries, being partially moder-ated by cultural dimensions. It seems that culture might be a moderator between job
satisfaction and job characteristics [72,73]. Given that Portugal and Brazil are two countries that share language and cultural features, it is expected that job satisfaction differences between countries are small or non-existent.
In terms of sex comparisons, the theoretical arguments behind potential workplace beliefs and attitudes among women and men are related to the work-life conflict [74]. Women are historically more affected by this conflict, and consequently, they might present a lower job satisfaction than men, particularly in some life events like the first marriage or the birth of the first child [75]. Nevertheless, women can present higher job satisfaction levels despite their poor quality of work conditions, something that Hakim [76] coined as the “grateful slaves” paradox. Albeit, past research suggests that men and women are increasingly similar in terms of job and life satisfaction [77]. Altogether, Hypothesis 5 states that different job satisfaction latent mean levels are observed, among different countries (Hypothesis 5.1) and different sexes (Hypothesis 5.2).
Method
Sampling and data collection
For this study, two samples of multi-occupational workers were collected (N = 1,171;S1and
S2Datasets). One sample is composed of Brazilian workers (n = 599) working in Brazil, and
one other sample is composed of Portuguese workers (n = 572) working in Portugal. The
sam-ple from Portugal had an average age of 35.83 (SD = 9.76) with 37.16% being males, 83.07%
had graduation or higher academic level, the occupational group with most participants was professionals (53.63%). The sample from Brazil had an average age of 35.11 (SD = 10.13), with
32.77% of males, 74.39% had graduation or higher academic level, professionals were most represented occupational group (36.12%).
The socioeconomic status according to the 2014 version of the Brazilian Criteria [78] was obtained, consisting of a socioeconomic classification of the households ranging from A1 (best socioeconomic level) to E (worst socioeconomic level) (Table 1). Additional variables regard-ing the characterization of the samples are available inTable 1.
A non-probabilistic convenience sample was collected within a cross-sectional survey through an online tool software [80]. The inclusion criteria were being workers with a contract or formal ties with their employers, literate, and with access to a device where the survey could be fulfilled.
Constructs and measures
Short Index of Job Satisfaction (SIJS). The Index of Job Satisfaction is a self-report
psy-chometric instrument created by Brayfield and Rothe [28]. The original version was composed of 18 items, although a shorter version with five items (SIJS) has also been proposed [29,81]. Subjects are asked to respond to each item by checking a five-point scale (1 –“Strongly Dis-agree”, 2 –“DisDis-agree”, 3 –“Undecided”, 4 –“Agree”, 5 –“Strongly Agree”) two of those items are reversed (Table 2). Regarding the validity evidence based on the internal structure in terms of reliability, this shorter five items version presented a good internal consistency evidence (α = .89) [29]. Similar evidence was found in another study (α = .82 to .83) [82].The ITC Guide-lines for Translating and Adapting Tests were used to adapt the SIJS to Portuguese in a single
version (using the Portuguese Language Orthographic Agreement of 1990) that could be used both for Portugal and Brazil with the same items [83]. The pilot data on the SIJS adapted ver-sion to the Portuguese language used 15 workers from Brazil and 15 workers from Portugal.
Quality of Working Life Scale (QWLS). The Quality of Work Life (i.e. second-order
16 items that are answered with a seven-point scale (Likert-type; from 1- “Very Untrue” to 7 –“Very True”).
This measure comprises a second-order factor–Quality of Work Life–and seven first-order
factors (i.e. seven major needs) which are: (1) economic and family needs;(2) health and safety needs; (3) aesthetic needs; (4) actualization needs; (5) esteem needs; (6) knowledge needs; and (7) social needs [12]. This measure tries to assess the workers’ perception of how the job requirements, work environment, support programs, and supervisor behavior meet their needs. In its Portuguese version for Portugal and Brazil, it has shown good psychometric prop-erties (measurement invariance across Portugal and Brazil, and genders) [84]. It also revealed good second-order internal consistency values both for Brazil (ωL2= .96;ωL1= .90;ωpartial L1=
.94) and Portugal (ωL2= .95;ωL1= .88;ωpartial L1= .93).
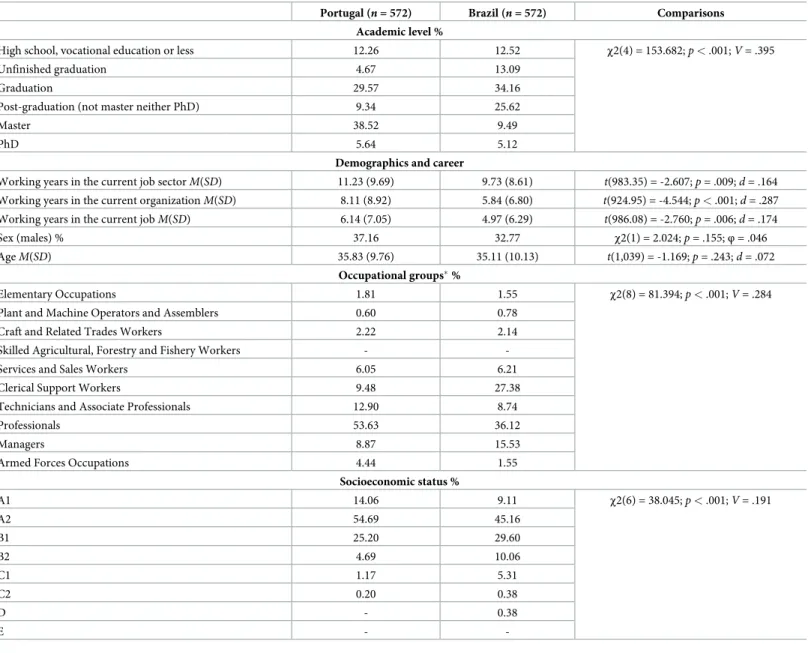
Table 1. Demographics, career, academic level and occupational group statistics across countries.
Portugal (n = 572) Brazil (n = 572) Comparisons Academic level %
High school, vocational education or less 12.26 12.52 χ2(4) = 153.682; p < .001; V = .395
Unfinished graduation 4.67 13.09
Graduation 29.57 34.16
Post-graduation (not master neither PhD) 9.34 25.62
Master 38.52 9.49
PhD 5.64 5.12
Demographics and career
Working years in the current job sectorM(SD) 11.23 (9.69) 9.73 (8.61) t(983.35) = -2.607; p = .009; d = .164
Working years in the current organizationM(SD) 8.11 (8.92) 5.84 (6.80) t(924.95) = -4.544; p < .001; d = .287
Working years in the current jobM(SD) 6.14 (7.05) 4.97 (6.29) t(986.08) = -2.760; p = .006; d = .174
Sex (males) % 37.16 32.77 χ2(1) = 2.024; p = .155; φ = .046
AgeM(SD) 35.83 (9.76) 35.11 (10.13) t(1,039) = -1.169; p = .243; d = .072
Occupational groups�%
Elementary Occupations 1.81 1.55 χ2(8) = 81.394; p < .001; V = .284
Plant and Machine Operators and Assemblers 0.60 0.78
Craft and Related Trades Workers 2.22 2.14
Skilled Agricultural, Forestry and Fishery Workers -
-Services and Sales Workers 6.05 6.21
Clerical Support Workers 9.48 27.38
Technicians and Associate Professionals 12.90 8.74
Professionals 53.63 36.12
Managers 8.87 15.53
Armed Forces Occupations 4.44 1.55
Socioeconomic status % A1 14.06 9.11 χ2(6) = 38.045; p < .001; V = .191 A2 54.69 45.16 B1 25.20 29.60 B2 4.69 10.06 C1 1.17 5.31 C2 0.20 0.38 D - 0.38 E -
-�Following theInternational Standard Classification of Occupations ISCO-08 [79]. https://doi.org/10.1371/journal.pone.0231474.t001
Oldenburg Burnout Inventory (OLBI). The Oldenburg Burnout Inventory (OLBI) in its
version for Portugal and Brazil [57] was used to measure burnout. Burnout is an occupational phenomenon; a workplace syndrome that results from coping unsuccessfully with chronic stressors from the occupational context [85]. This instrument assumes a second-order latent factor–Burnout–that comprises two first-order factors, Exhaustion (eight items) and engagement (seven items) which are rated from 5 = “Strongly Agree” to 1 = “Strongly Dis-agree”. Disengagement refers to a distancing and gradual loss of concern with one’s work recipients or contents, while exhaustion refers to a state of draining energy as a result of cogni-tive, emotional and physical strain [86]. The selected OLBI’s version presented good validity evidence base in the internal structure (i.e. dimensionality, reliability of the scores in terms of second-order internal consistency values [ωL2= .91;ωL1= .86;ωpartial L1= .93], and
measure-ment invariance among countries and sexes) and based on the relation to other variables (i.e. nomological; discriminant evidence with work engagement).
Utrecht Work Engagement Scale (UWES). Work engagement was measured using the
Utrecht Work Engagement Scale (short-version; nine items) in its Portuguese version for Por-tugal and Brazil [56]. It measures work engagement as a second-order latent factor which can be defined as a fulfilling, and positive state of mind related to work, with three (first-order) dimensions: absorption, dedication, and vigor [87]. Absorption is defined as one feeling totally concentrated and happily immersed at work [88]. Dedication refers to a sense of significance, challenge inspiration, pride and enthusiasm [87]. Vigor is defined as having high levels of energy [88]. As such, each of these three dimensions has three items, which are answered using a seven-point scale, from 0 = “Never” to 6 = “Always”. This instrument has presented good validity evidence with Portuguese samples [89,90], namely in terms of dimensionality, measurement invariance (among Brazil and Portugal), reliability (second-order internal con-sistency values [ωL2= .96;ωL1= .93;ωpartial L1= .97]) and expected relation to other variables
[56].
Procedure
The participants from both countries were invited to answer the selected instruments, sociode-mographic and career questions. They were contacted individually or through companies that accepted to share the study by email. The cross-sectional data (i.e. cross-sectional survey) was collected using theLimeSurvey software [80] through the website of two major universities one in each of the two countries. The participation rate of the subjects that clicked in the invitation link from Brazil was 68.07% while 74.38% of Portuguese sample that clicked on the link ful-filled the survey. The participants were presented with the electronic informed consent in the first place, and after accepting it, had access to the surveyper se. This study was approved by
Table 2. SIJS original and Portuguese versions.
Item Original SIJS [29] Portuguese (Brazil and Portugal) version of SIJS
Strongly Disagree Disagree Undecided Agree Strongly Agree Discordo Fortemente Discordo Indeciso Concordo Concordo Fortemente
1 2 3 4 5 1 2 3 4 5
1 I feel fairly satisfied with my present job Sinto-me razoavelmente satisfeito com meu emprego atual 2 Most days I am enthusiastic about my work Na maioria dos dias, estou entusiasmado com o meu trabalho 3R Each day at work seems like it will never end (R)
Cada dia no trabalho parece não ter fim (R) 4 I find real enjoyment in my work Sinto-me realmente satisfeito no meu trabalho
5R I consider my job to be rather unpleasant (R) Considero que meu emprego e´ particularmente desagrada´vel (R)
R
Reversed items.
the Committee of Ethics in Research with Human Beings (CEP) of the Faculty of Philosophy, Sciences, and Letters of Ribeirão Preto, University of São Paulo, through “platform Brazil” of CONEP (National Commission of Ethics in Research). The written consent was obtained with the approval number 33301214.2.0000.5407. This study was also approved by the Ethics Com-mittee of the Faculty of Psychology and Education Sciences of the University of Porto, the written consent had the following statement "the Ethics Committee of the Faculty of Psychol-ogy and Education Sciences of the University of Porto, having analyzed the research project . . . considers that it respects all ethical principles and ethical standards of research and there-fore gives a favorable opinion".
Data analysis
The statistical programR [91] through the integrated developmentRStudio [92] was used to perform all statistical analyses. Theskimr package [93] produced descriptive statistics. The multivariate normality was verified by the multivariate kurtosis [94] which was obtained using thepsych package [95].
The confirmatory factor analysis (CFA) was the statistical technique selected to test the dimensionality of the instrument model. Thelavaan package [96] was used to perform CFAs and multigroup CFA (MGCFA) with the Weighted Least Squares Means and Variances (WLSMV) estimator [97]. Some goodness-of-fit indices were selected:χ2
(chi-square), RMSEA (Root Mean Square Error of Approximation), SRMR (Standardized Root Mean Square Residual), CFI (Comparative Fit Index), NFI (Normed Fit Index), and the TLI (Tucker Lewis Index). Regarding the CFI, NFI, and TLI, Hu and Bentler [98] recommended that values above .95 should be considered as indicative of good fit. The RMSEA and SRMR values below .08 should be considered as good [99,100]. Model modifications were added through the anal-ysis of the modification indices (> 30;p < .001) together with theoretical considerations.
The convergent evidence (in terms of internal structure) was assessed through the Average Variance Extracted [AVE;101] calculated from polychoric correlations [102] where AVE � .50 was considered as adequate convergent validity evidence [100].
The reliability of the scores evidence in terms of internal consistency was approached with the ordinalα [103], Composite Reliability [CR;101] andω [104,105] coefficients. The ordinal α coefficient was calculated from the polychoric correlations matrix. For the three coefficients, values �.70 were considered as indicative of acceptable reliability of the scores [100]. In the case of the second-order latent factors, three reliability estimates were calculated: the variance of the first-order factors explained by the second-order factor (ωL2), the proportion of the
sec-ond-order factor explaining the total score (ωL1), and the proportion of variance explained by
second-order factor after partialling the uniqueness of the first-order factor (ωpartialL1). Both
theω (both for first- and second-order factors) and the α coefficients were calculated using the
semTools package [102].
The measurement invariance of the SIJS was evaluated through multigroup confirmatory factor analysis (MGCFA) which—considering the categorical nature of items–was analyzed using the theta-parameterization [106]. Five nested models were compared to test configural invariance, metric invariance, scalar invariance, strict invariance and homogeneity of factor means. For such analysis thesemTools package [102] was used. The full structural equation models were analyzed through thelavaan package [96].
Using the structural equation modeling framework, the latent variables mean scores were compared using as effect size the Cohen’sd [107]. Additionally, for the job satisfaction raw scores the means, standard deviations and quartiles were calculated through thedoBy package
the frequencies were compared using the chi-square test using the Crame´r’s V [109] or theφ [110] as an effect size measure using thelsr package [111] and thepsych package [95] respec-tively. The factor means were compared using the independent two-samplet-test or the
Welch’st-test when the variances were not equal. Cohen’s d [107] was used as estimator of effect size obtained through thelsr package [111].
Results
Validity evidence based on the internal structure
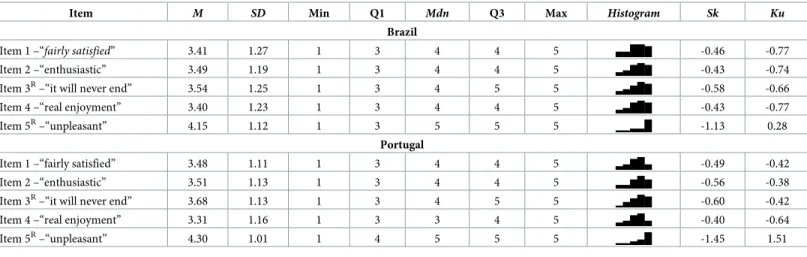
Dimensionality. Items’ distributional properties. The SIJS’ items were analyzed in terms of
its descriptive statistics (Table 3) which did not reveal severe violations in terms of univariate normality, since none of the items (for both samples) presented absolute values of Sk above 3 or absolute values of Ku above 7 [112]. In terms of multivariate normality, both samples had values of Mardia’s multivariate kurtosis indicative of the absence of multivariate normality: Portugal (27.61,p < .001) and Brazil (16.10, p < .001). The maximum possible range of
answers was observed in the five items and there was no outliers deletion. Altogether the distri-butional proprieties of the items indicate adequate psychometric sensitivity, however failing to achieve multivariate normality. As such, the WLSMV estimator that does not assume multi-variate normality was used being also more adequate to the ordinal nature of the SIJS items.
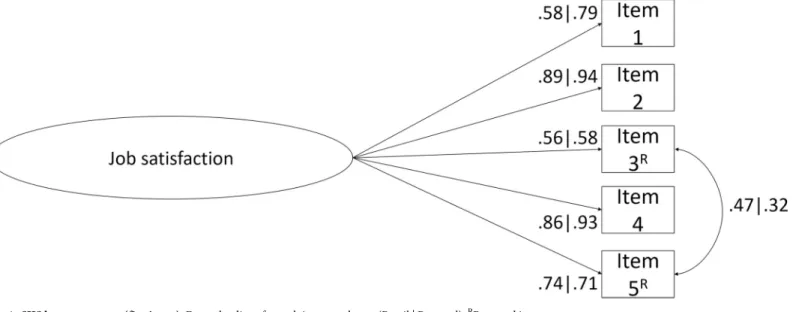
Factor related validity evidence. The factorial validity evidence of the original proposed
sin-gle latent factor was acceptable for the joint sample (Fig 1;χ2(5) = 108.469;p < .001; n = 1,171; CFI = .994; NFI = .993; TLI = .987; SRMR = .055; RMSEA = .133; P(rmsea) � .05) < .001; 90%
CI ].112; .155[). Although, after checking the modification indices it was noticed that the cor-relation path between the residuals of the items 3 and 5 could improve the model’s fit. That correlation was added (r = .322; p < .001) and the fit to the data was very good (χ2(4) = 11.228;
p = .024; n = 1,171; CFI = 1.000; NFI = .999; TLI = .999; SRMR = .021; RMSEA = .039; P(rmsea)
� .05) = .698; 90% CI ].013; .067[). All factor loadings (λ) and the items 3 and 5 residuals’ cor-relation were statistically significant. There were no items removed. The minimum item load-ing for the SIJS was .57. The fit of the data to the model with one correlation between the referred items in the Brazilian sample was good (χ2
(4) = 11.486;p = .022; n = 599; CFI = .999; NFI = .998; TLI = .997; SRMR = .030; RMSEA = .056; P(rmsea) � .05) = .339; 90% CI ].019;
.095[) the same was observed in the Portuguese data (χ2
(4) = 6.726;p < .001; n = 572;
Table 3. Sample 1 and 2 descriptive statistics.
Item M SD Min Q1 Mdn Q3 Max Histogram Sk Ku
Brazil
Item 1 –“fairly satisfied” 3.41 1.27 1 3 4 4 5 ▃▃▇▇▆ -0.46 -0.77
Item 2 –“enthusiastic” 3.49 1.19 1 3 4 4 5 ▂▃▆▇▆ -0.43 -0.74
Item 3R–“it will never end” 3.54 1.25 1 3 4 5 5 ▂▃▅▇▆ -0.58 -0.66
Item 4 –“real enjoyment” 3.40 1.23 1 3 4 4 5 ▂▃▆▇▆ -0.43 -0.77
Item 5R–“unpleasant” 4.15 1.12 1 3 5 5 5 ▁▁▂▂▇ -1.13 0.28
Portugal
Item 1 –“fairly satisfied” 3.48 1.11 1 3 4 4 5 ▂▃▆▇▃ -0.49 -0.42
Item 2 –“enthusiastic” 3.51 1.13 1 3 4 4 5 ▂▂▅▇▅ -0.56 -0.38
Item 3R–“it will never end” 3.68 1.13 1 3 4 5 5 ▁▃▅▇▆ -0.60 -0.42
Item 4 –“real enjoyment” 3.31 1.16 1 3 3 4 5 ▂▃▆▇▃ -0.40 -0.64
Item 5R–“unpleasant” 4.30 1.01 1 4 5 5 5 ▁▁▂▃▇ -1.45 1.51
R
Reversed items; the descriptive statistics of such items refer to the recoded scores.
CFI = 1.000; NFI = 1.000; TLI = 1.000; SRMR = .019; RMSEA = .035; P(rmsea) � .05) = .661;
90% CI ].000; .078[).
Convergent validity evidence. The AVE value for the job satisfaction factor was .58, which is
indicative of good convergent validity evidence for this factor. Good AVE values were also observed for each country (AVEBrazil= .54;AVEPortugal= .65). Globally, these results indicate good convergent validity evidence in terms of internal structure for SIJS. In other words, the items contained in the job satisfaction factor relate to each other.
Reliability of the scores
The reliability of the scores was assessed through internal consistency estimates which revealed to be globally very good values for both samples (Table 4). The values of the internal consis-tency estimates were very good (� .84) for the Brazilian data, with the CR obtaining the high-est value. In the case of the Portuguese sample all internal consistency high-estimates were also very good (� .88). Such results are indicative of very good evidence in terms of reliability, suggest-ing that items’ scores are homogenously crowded together around the job satisfaction latent variable.
Measurement invariance
The measurement invariance among countries and sexes was tested through a group of nested models with increasing constraints (Table 5). Scalar invariance was achieved among countries considering theΔCFI < .010 criterion [113] while using theΔχ2criterion [114] only metric invariance was achieved. Regarding the measurement invariance among sexes in the Brazilian sample, full uniqueness measurement invariance was obtained using theΔCFI < .010 criterion, while theΔχ2
criterion only supported metric invariance. The Portuguese sample showed that full uniqueness measurement invariance was supported by both criteria (i.e.ΔCFI < .010 and Δχ2
). That is to say that the SIJS measures job satisfaction in the same way across countries and sexes, allowing to interpret the differences in terms of group differences in the job satisfac-tion construct.
Fig 1. SIJS latent structure (five items). Factor loadings for each item are shown (Brazil | Portugal).RReversed items.
Validity evidence based on relations to other variables
Three additional measures were used to investigate the validity evidence based on relations to other variables, particularly the nomological validity both in terms of convergent and discrimi-nant evidence [49]. Using the OLBI second-order factor model which revealed an acceptable fit to the data (χ2
(86) = 1,039.970;p < .001; n = 1,109; CFI = .984; NFI = .983; TLI = .981; SRMR = .065; RMSEA = .100; P(rmsea) � .05) < .001; 90% CI ].095; .106[) after adding three
pairs of correlations between items’ residuals (i.e. Item1OLBI—Item7OLBI; Item10OLBI−
Item12OLBI; and Item4OLBI−Item16OLBI). Such correlations were added after the analysis of
modification indices because the items in each pair belong to the same factor. Since it seems plausible that residuals of the same factor are correlated [115]. The UWES-9 second-order model also obtained an acceptable fit (χ2
(25) = 437.948;p < .001; n = 1,100; CFI = .998; NFI =
.998;TLI = .997; SRMR = .041; RMSEA = .123; P(rmsea) � .05) < .001; 90% CI ].113; .133[)
after adding a constraint to the variance of one of the first-order factors–Dedication–fixing it
to 0.001 to avoid negative variance. The QWLS-16 presented good fit (χ2
(97) = 931.475;p <
.001;n = 1,108; CFI = .991; NFI = .990; TLI = .988; SRMR = .064; RMSEA = .088; P(rmsea) �
.05) < .001; 90% CI ].083; .093[). Both in terms of first- and second-order factors the reliability Table 4. Internal consistency estimates for both samples.
SIJS dimension SIJS—5 items
Brazil Portugal Total
α ω CR α ω CR α ω CR
Job Satisfaction .86 .84 .87 .90 .88 .90 .88 .86 .88
https://doi.org/10.1371/journal.pone.0231474.t004
Table 5. Measurement invariance between countries.
Countries
Model χ2 df CFI scaled Δχ2 ΔCFI scaled
Configural 106.14 10 .981 - -Metric 113.33 14 .985 7.820ns -.004 Scalar 149.57 28 .982 49.056��� .003 Full uniqueness 333.08 33 .959 233.143��� .023 Latent means 346.43 34 .975 2.125ns -.016 Sex Brazil Configural 76.147 10 .955 - -Metric 82.685 14 .962 6.021ns -.007 Scalar 92.337 28 .963 14.871ns -.001 Full uniqueness 102.484 33 .962 11.675� .001 Latent means 107.401 34 .975 0.863ns -.013 Sex Portugal Configural 27.010 10 .993 - -Metric 27.468 14 .994 1.260ns .001 Scalar 41.714 28 .994 20.350ns .000 Full uniqueness 45.361 33 .994 5.572ns .000 Latent means 50.736 34 .997 0.863ns -.003 ns p > .05 �p � .05 ���p < .001. https://doi.org/10.1371/journal.pone.0231474.t005
of the scores in terms of internal consistency for QWLS, UWES-9 and OLBI presented accept-able to very good evidence (Table 6).
In nomological terms, the convergent evidence was good, since both the model of quality of work life correlating with job satisfaction (χ2
(180) = 1,126.605;p < .001; n = 1,108; CFI = .993; NFI = .992; TLI = .992; SRMR = .054; RMSEA = .069; P(rmsea) � .05) < .001, 90% CI ].065;
.073[) and the model of work engagement correlating with job satisfaction (χ2
(73) = 669.163;p < .001;n = 1,100; CFI = .998; NFI = .997; TLI = .997; SRMR = .038; RMSEA = .086; P(rmsea) �
.05) < .001, 90% CI ].080; .092[) presented significant and strong correlations (rJS, QWL= 0.82; rJS, WE= 0.86, respectively).
The model where job satisfaction was correlated with burnout showed good fit to the data (χ2
(165) = 1,558.286;p < .001; n = 1,109; CFI = .988; NFI = .987; TLI = .986; SRMR = .061; RMSEA = .087; P(rmsea) � .05) < .001, 90% CI ].083; .091[). The hypothetical model indicates
a large and negative correlation between job satisfaction and burnout (rJS, B= -0.90;p < .001).
Such result suggests good discriminant evidence in nomological terms. Altogether, the SIJS’ validity evidence based on relations to other variables was satisfactory, showing associations in the expected directions in other associated measures.
Job satisfaction comparisons among sex and country
The job satisfaction latent means were compared through the structural equation modeling framework. The comparison among countries did not reveal statistically significant differences (Δχ2
scaled(1) = 2.125;p = 0.145; d = 0.086). Also, the comparison among sexes did not reveal
statistically significant differences (Δχ2
scaled(1) = 0.126p = 0.723; d = -0.003). For potential
comparison with other studies, job satisfaction means, standard deviations, and quartiles of the raw scores per country and sex are provided (Table 7).
Discussion
The SIJS presented a promising fit to data from multi-occupational workers from Portugal and Brazil. The minimumλ value was high, and the instrument presented acceptable conver-gent validity evidence. Globally, the SIJS presented acceptable values of internal consistency, with scalar invariance obtained among the Portuguese and Brazilian samples and sexes. This is in line with the good psychometric properties observed in different countries such as the USA [82], Italy [116], New Zealand [47] or the UAE [52]. Due to its good validity evidence, the SIJS has been reported as a commonly used instrument of job satisfaction in studies published in top journals [117].
The dimensionality of the SIJS was successfully confirmed (H1), presenting an excellent fit to the data. However, a modification was added to the structure: the correlation among items’ 3 and 5 residuals. Such correlation can be justified since both items belong to the same latent factor, and additionally both items are reversed. Interestingly, a study by Jabeen et al. [52] revealed problems with this pair of reversed items (i.e. unexpected factor loadings), which lead the authors to remove those items from the analysis. The discussion about the inclusion of reversed items reveals that there are specific trade-offs that researchers should be aware of [118–120].
The reliability evidence confirmed to be good (H2). Such findings are corroborated by other studies where the SIJS revealed adequate to good reliability evidence in terms of internal consistency [45–48]. Our study’s internal consistency estimates values were good in the three different used estimates (i.e.α, ω and CR).
Regarding Hypothesis 3, it was also confirmed. A minimum of scalar invariance was achieved both for countries and sexes. As far as we know, none of the other studies that used
the SIJS tested the measurement invariance of this instrument. As such, this finding is an inter-esting contribution to the literature. Strong measurement (scalar) invariance is an essential condition to directly compare an instrument score among groups [121].
The validity evidence based on the relation to other variables revealed to be satisfactory, since the tested full structural equation models presented paths that occurred as expected, con-firming Hypothesis 4. More specifically, job satisfaction was associated with burnout (H4.1). The burnout association with overall job satisfaction is well known, albeit some argue that they can have bidirectional relations [122]. Others [e.g.,123] reported a strong negative correlation between emotional exhaustion (burnout’s core dimension) and job satisfaction. Emotional exhaustion has been also observed to explain specific types of job satisfaction (e.g. satisfaction with the communication) [124].
Job satisfaction also correlated with work engagement (H4.2) a finding that has parallel in other studies [125,126]. Conversely in other studies, some authors tested work engagement as a predictor of job satisfaction, finding also a positive relationship between both variables [127,128].
The relation with quality of work-life was successfully verified (H4.3) similarly to previous research which showed that quality of work-life predicts job satisfaction [12,52]. The correla-tion magnitude is large which is somehow expected, since the used quality of work-life mea-sure approaches the perception of needs satisfaction related to the supervisory behavior, job requirements, and work environment which–when occurs–conducts to job satisfaction [12]. Table 6. UWES-9, OLBI, and QLWS internal consistency estimates.
Internal consistency estimates
Estimate UWES-92L OLBI2L QWLS2L
ω Vigor = .94 Disengagement = .68 Health & Safety = .43
Economic & Family = .64
Dedication = .91 Social = .46 Esteem = .77 Exhaustion = .86 Actualization = .91 Absorption = .88 Knowledge = .90 Aesthetics = .83 ωpartial L1 .97 .93 .96 ωL1 .93 .86 .92 ωL2 .96 .92 .96
2LSecond-order latent version.
https://doi.org/10.1371/journal.pone.0231474.t006
Table 7. Job satisfaction raw scores: Quartiles, means, and standard deviations for countries and sexes. Brazil
Female (n = 355) Male (n = 173) Total (n = 599)�
M SD P25 P50 P75 M SD P25 P50 P75 M SD P25 P50 P75
3.58 0.95 3.00 3.80 4.20 3.68 0.87 3.00 3.80 4.20 3.60 0.92 3.00 3.80 4.20
Portugal
Female (n = 323) Male (n = 191) Total (n = 572)�
3.68 0.91 3.20 3.80 4.40 3.61 0.89 3.00 3.80 4.20 3.66 0.90 3.00 3.80 4.40
�Some subjects did not inform their Sex. https://doi.org/10.1371/journal.pone.0231474.t007
Portugal and Brazil did not present statistically significant differences regarding job satis-faction (H5.1). Since the sample was mainly constituted by workers with higher education, such finding was plausible. Others [e.g.,129], found that job satisfaction was rather similar across various countries among the higher education graduates. Countries with different cul-tural backgrounds can display different perceptions of job satisfaction, and such potential dif-ferences should be controlled before making comparisons [130]. Something that—regarding the Brazil and Portugal comparison—was guaranteed both by the procedure of adaptation of the items which considered both countries’ cultural specificities and through the verification of the scalar invariance of the SIJS. Only after such evidence, direct comparisons of the scores can be established [131].
The hypothesis tested in H5.2 was not supported by the data. In Brazil, a previous study among health-care workers did not find statistically significant differences among genders [132]. In Portugal there are mixed findings, with some studies not finding statistically signifi-cant differences among men and women [133,134] while others reported that men had higher job satisfaction than women[135]. Past studies in other countries found differences between sexes both with males having greater job satisfaction after controlling for similar job ranks [136], or the reverse effect [137], or even the absence of differences between women and men [138,139]. Kaiser [135] found that job satisfaction differences among sexes are expected to be insignificant within a higher job status segment. This seems a plausible explanation since the collected samples in the present paper have high frequencies of higher academic levels, which are expected to be associated with higher job status. Zou [140] reported that when work orien-tations are taken into account, job satisfaction differences among women and men are elimi-nated. Also, there is evidence that women and men are similar in the crossover and spillover dynamics regarding job satisfaction, job insecurity, own family and partner’s family life satis-faction [141]. Various explanations exist for such absence, or even the possible greater job sat-isfaction perceived by women [142] which would be seen as a job satisfaction paradox [135]. Nulling effect of covariate variables of sex, like education, age and paygrade can explain the absence of differences [143],. perhaps due to the evolution of the demographics and women’s attitudes towards work [77]. Such findings can be also explained by the less apparent differ-ences among sexes in terms of job roles, qualifications, earnings and other indicators
[144,145]. Such a fading-out process might be explained by appropriate labor market interven-tions by the governing instituinterven-tions [135]. Hodson [142] suggested that women can report equal or greater job satisfaction than men, despite women’s worst job conditions because of two possible processes that may operate in conjunction. First, women can use different com-parison groups. Second, men can be more inclined to report situations of dissatisfaction than women.
Conclusions
The short measure (i.e. SIJS) can be taken as a good measure, since it has been used success-fully in several studies [e.g.6], and it also demonstrated promising validity in this study. Despite being shorter than several other instruments versions that measure job satisfaction [146] the SIJS revealed very promising validity evidence, both based in the internal structure as also based on the relations to other variables. When a researcher wants to use several measures, the length of the selected instruments is a fundamental issue to avoid respondents’ fatigue. As such, having short scales that show good validity evidence is crucial since lengthy surveys can lead to fatigue and consequently have increased insufficient effort responding [147,148].
Some limitations of the current study should be mentioned. The sample was a convenience sample (i.e. non-probabilistic). Desirably in future studies probability sampling techniques
should be used. Additionally, the two current samples do not have the same proportions of occupational groups, sex and academic level in each country. And since, the conclusions regarding invariance should be analyzed with caution. In this cross-sectional study, no infor-mation can be extracted regarding the temporal stability of the SIJS structure. In future research, researchers might address this issue by testing longitudinal measurement invariance [149]. Research with other samples (i.e. more specific occupational groups) is expected to occur in future studies, as also in other countries/cultures, to approach the transcultural invari-ance robustness of the SIJS.
Supporting information
S1 Dataset. The dataset used.
(CSV)
S2 Dataset. The dataset codebook.
(CSV)
Acknowledgments
The authors would like to thank the Portuguese national occupational health program of the Directorate-General of Health (DGS). We thank Dr. Edwin A. Locke (Robert H. Smith School of Business [Emeritus], University of Maryland, College Park, MD, United States of America) for helpful comments.
Author Contributions
Conceptualization: Jorge Sinval, João Maroˆco.
Data curation: Jorge Sinval. Formal analysis: Jorge Sinval. Funding acquisition: João Maroˆco.
Investigation: Jorge Sinval.
Methodology: Jorge Sinval, João Maroˆco.
Project administration: Jorge Sinval. Software: Jorge Sinval.
Supervision: João Maroˆco.
Visualization: Jorge Sinval.
Writing – original draft: Jorge Sinval.
Writing – review & editing: Jorge Sinval, João Maroˆco.
References
1. Wright TA. The emergence of job satisfaction in organizational behavior: A historical overview of the dawn of job attitude research. J Manag Hist. 2006; 12: 262–277.https://doi.org/10.1108/
17511340610670179
2. Spagnoli P, Caetano A, Santos SC. Satisfaction with job aspects: Do patterns change over time? J Bus Res. 2012; 65: 609–616.https://doi.org/10.1016/j.jbusres.2011.02.048
3. Hoppock R. Job satisfaction [Internet]. New York, NY, USA: Harper; 1935. Available:https://books. google.pt/books?id=ovFCAAAAIAAJ
4. Hoppock R, Spiegler S. Job satisfaction: Researches of 1935–1937. Occup Vocat Guid J. 1938; 16: 636–643.https://doi.org/10.1002/j.2164-5892.1938.tb00348.x
5. Spector PE. Job satisfaction: Application, assessment, causes, and consequences [Internet]. Thou-sand Oaks, CA, USA: SAGE; 1997.https://doi.org/10.4135/9781452231549
6. Judge TA, Parker S, Colbert AE, Heller D, Ilies R. Job satisfaction: A cross-cultural review. In: Ander-son N, Ones DS, Sinangil HK, Viswesvaran C, editors. Handbook of industrial, work and organizational psychology: Organizational psychology. London, UK: SAGE; 2001. pp. 25–52.https://doi.org/10. 4135/9781848608368.n3
7. Locke EA. The nature and causes of job satisfaction. In: Dunnette MD, editor. Handbook of industrial and organizational psychology. Chicago, IL, USA: Rand McNally; 1976. pp. 1297–1343.
8. Judge TA, Kammeyer-Mueller JD. Job attitudes. Annu Rev Psychol. 2012; 63: 341–367.https://doi. org/10.1146/annurev-psych-120710-100511PMID:22129457
9. Crede´ M. Attitudes: Satisfaction, commitment and involvement. In: Ones DS, Anderson N, Viswes-varan C, Sinangil HK, editors. The SAGE handbook of industrial, work and organizational psychology: Organizational psychology. 2nd ed. London, UK: SAGE; 2018. pp. 3–23.https://doi.org/10.4135/ 9781473914957.n2
10. Knox S, Irving JA. An interactive quality of work life model applied to organizational transition. J Nurs Adm. 1997; 27: 39–47.https://doi.org/10.1097/00005110-199701000-00009PMID:9006600
11. Chan KW, Wyatt TA. Quality of work life: A study of employees in Shanghai, China. Asia Pacific Bus Rev. 2007; 13: 501–517.https://doi.org/10.1080/13602380701250681
12. Sirgy MJ, Efraty D, Siegel P, Lee D-J. A new measure of quality of work life (QWL) based on need sat-isfaction and spillover theories. Soc Indic Res. 2001; 55: 241–302.https://doi.org/10.1023/
A:1010986923468
13. Li A, Early SF, Mahrer NE, Klaristenfel JL, Gold JI. Group cohesion and organizational commitment: Protective factors for nurse residents’ job satisfaction, compassion fatigue, compassion satisfaction, and burnout. J Prof Nurs. 2014; 30: 89–99.https://doi.org/10.1016/j.profnurs.2013.04.004PMID:
24503320
14. van Saane N, Sluiter JK, Verbeek JHAM, Frings-Dresen MHW. Reliability and validity of instruments measuring job satisfaction—A systematic review. Occup Med (Chic Ill). 2003; 53: 191–200.https://doi. org/10.1093/occmed/kqg038PMID:12724553
15. Bhave DP, Glomb TM. The role of occupational emotional labor requirements on the surface acting– job satisfaction relationship. J Manage. 2016; 42: 722–741.https://doi.org/10.1177/
0149206313498900
16. Dobrow Riza S, Ganzach Y, Liu Y. Time and job satisfaction: A longitudinal study of the differential roles of age and tenure. J Manage. 2018; 44: 2558–2579.https://doi.org/10.1177/0149206315624962
17. Irvine DM, Evans MG. Job satisfaction and turnover among nurses. Nurs Res. 1995; 44: 246–253.
https://doi.org/10.1097/00006199-199507000-00010PMID:7624236
18. Lance CE. Evaluation of a structural model relating job satisfaction, organizational commitment, and precursors to voluntary turnover. Multivariate Behav Res. 1991; 26: 137–162.https://doi.org/10.1207/ s15327906mbr2601_7PMID:26782615
19. Zito M, Emanuel F, Molino M, Cortese CG, Ghislieri C, Colombo L. Turnover intentions in a call center: The role of emotional dissonance, job resources, and job satisfaction. Georgantzis N, editor. PLoS One. 2018; 13: 1–16.https://doi.org/10.1371/journal.pone.0192126PMID:29401507
20. Judge TA, Ilies R. Affect and job satisfaction: A study of their relationship at work and at home. J Appl Psychol. 2004; 89: 661–673.https://doi.org/10.1037/0021-9010.89.4.661PMID:15327352
21. Burton WN, Chen C-Y, Conti DJ, Schultz AB, Pransky G, Edington DW. The association of health risks with on-the-job productivity. J Occup Environ Med. 2005; 47: 769–777.https://doi.org/10.1097/ 01.jom.0000169088.03301.e4PMID:16093926
22. Rantanen I, Tuominen R. Relative magnitude of presenteeism and absenteeism and work-related fac-tors affecting them among health care professionals. Int Arch Occup Environ Health. 2011; 84: 225– 230.https://doi.org/10.1007/s00420-010-0604-5PMID:21140162
23. Caverley N, Cunningham JB, MacGregor JN. Sickness presenteeism, sickness absenteeism, and health following restructuring in a public service organization. J Manag Stud. 2007; 44: 304–319.
https://doi.org/10.1111/j.1467-6486.2007.00690.x
24. BakotićD. Relationship between job satisfaction and organisational performance. Econ Res Istrazˇi-vanja. 2016; 29: 118–130.https://doi.org/10.1080/1331677X.2016.1163946
25. Weiss HM, Cropanzano R. Affective events theory: A theoretical discussion of the structure, causes and consequences of affective experiences at work. Staw BM, Cummings LL, editors. Research in
organizational behavior: An annual series of analytical essays and critical reviews. Greenwich, CT, USA: JAI Press; 1996.
26. Judge TA, Hulin CL, Dalal RS. Job satisfaction and job affect. In: Kozlowski SWJ, editor. The Oxford handbook of organizational psychology. Oxford University Press; 2012. pp. 496–525.https://doi.org/ 10.1093/oxfordhb/9780199928309.013.0015
27. Wanous JP, Reichers AE, Hudy MJ. Overall job satisfaction: How good are single-item measures? J Appl Psychol. 1997; 82: 247–252.https://doi.org/10.1037/0021-9010.82.2.247PMID:9109282
28. Brayfield AH, Rothe HF. An index of job satisfaction. J Appl Psychol. 1951; 35: 307–311.https://doi. org/10.1037/h0055617
29. Judge TA, Bono JE, Locke EA. Personality and job satisfaction: The mediating role of job characteris-tics. J Appl Psychol. 2000; 85: 237–249.https://doi.org/10.1037/0021-9010.85.2.237PMID:
10783540
30. Traynor M, Wade B. The development of a measure of job satisfaction for use in monitoring the morale of community nurses in four trusts. J Adv Nurs. 1993; 18: 127–136. https://doi.org/10.1046/j.1365-2648.1993.18010127.xPMID:8429157
31. Ironson GH, Smith PC, Brannick MT, Gibson WM, Paul KB. Construction of a Job in General scale: A comparison of global, composite, and specific measures. J Appl Psychol. 1989; 74: 193–200.https:// doi.org/10.1037/0021-9010.74.2.193
32. Smith PC, Kendall LM, Hulin CL. The measurement of satisfaction in work and retirement: A strategy for the study of attitudes. Oxford, England: Rand Mcnally; 1969.
33. Andrews FM, Withey SB. Social indicators of well-being: Americans’ perceptions of life quality [Inter-net]. Boston, MA, USA: Springer; 1976.https://doi.org/10.1007/978-1-4684-2253-5
34. Spector PE. Measurement of human service staff satisfaction: Development of the Job Satisfaction Survey. Am J Community Psychol. 1985; 13: 693–713.https://doi.org/10.1007/bf00929796PMID:
4083275
35. Weiss DJ, Dawis R, England GW, Lofquist LH. Manual for the Minnesota Satisfaction Questionnaire [Internet]. Minnesota Studies in Vocational Rehabilitation. Minneapolis,MN, USA: University of Min-nesota; 1967. doi:Article
36. Cammann C, Fichman M, Jenkins GD, Klesh JR. Assessing the attitudes and perceptions of tional members. In: Seashore SE, Lawler EE, Mirvis PH, Cammann C, editors. Assessing organiza-tional change: A guide to methods, measures, and practices. New York, NY, USA: Wiley-Interscience; 1983. pp. 71–138.
37. Macdonald S, Maclntyre P. The Generic Job Satisfaction Scale: Scale development and its correlates. Empl Assist Q. 1997; 13: 1–16.https://doi.org/10.1300/J022v13n02_01
38. Hartley J, Jacobson D, Klandermans B, Van Vuuren T, editors. Job insecurity: Coping with jobs at risk [Internet]. London, UK: Sage Publications; 1991. Available:https://books.google.pt/books?id= cC7tAAAAMAAJ
39. Oshagbemi T. Overall job satisfaction: How good are single versus multiple-item measures? J Manag Psychol. 1999; 14: 388–403.https://doi.org/10.1108/02683949910277148
40. Nagy MS. Using a single-item approach to measure facet job satisfaction. J Occup Organ Psychol. 2002; 75: 77–86.https://doi.org/10.1348/096317902167658
41. Nunnally JC, Bernstein IH. Psychometric theory. 3rd ed. New York, NY, USA: McGraw-Hill; 1994. 42. Borsboom D, Mellenbergh GJ, van Heerden J. The theoretical status of latent variables. Psychol Rev.
2003; 110: 203–219.https://doi.org/10.1037/0033-295X.110.2.203PMID:12747522
43. Wanous JP, Reichers AE. Estimating the reliability of a single-item measure. Psychol Rep. 1996; 78: 631–634.https://doi.org/10.2466/pr0.1996.78.2.631
44. Heggestad ED, Scheaf DJ, Banks GC, Monroe Hausfeld M, Tonidandel S, Williams EB. Scale adapta-tion in organizaadapta-tional science research: A review and best-practice recommendaadapta-tions. J Manage. 2019; 45: 2596–2627.https://doi.org/10.1177/0149206319850280
45. Yu¨cel I. Examining the Relationships among job satisfaction, organizational commitment, and turnover intention: An empirical study. Int J Bus Manag. 2012; 7: 44–58.https://doi.org/10.5539/ijbm.v7n20p44
46. Jawahar IM, Liu Y. Why are proactive people more satisfied with their job, career, and life? An exami-nation of the role of work engagement. J Career Dev. 2017; 44: 344–358.https://doi.org/10.1177/ 0894845316656070
47. Ang HB (Andy), Woodside AG. Is Bart Simpson offering sage advice? A case-based general theory of managers’ core self-evaluations and job satisfaction. J Bus Res. 2017; 74: 11–37.https://doi.org/10. 1016/j.jbusres.2017.01.005
48. Judge TA, Locke EA, Durham CC, Kluger AN. Dispositional effects on job and life satisfaction: The role of core evaluations. J Appl Psychol. 1998; 83: 17–34.https://doi.org/10.1037/0021-9010.83.1.17
PMID:9494439
49. American Educational Research Association, American Psychological Association, National Council on Measurement in Education. Standards for Educational and Psychological Testing. Washington, DC, USA: American Psychological Association; 2014.
50. Jawahar IM, Liu Y. Proactive personality and citizenship performance: The mediating role of career satisfaction and the moderating role of political skill. Career Dev Int. 2016; 21: 378–401.https://doi. org/10.1108/CDI-02-2015-0022
51. Walker AG. The Relationship between the Integration of Faith and Work with Life and Job Outcomes. J Bus Ethics. 2013; 112: 453–461.https://doi.org/10.1007/s10551-012-1271-0
52. Jabeen F, Friesen HL, Ghoudi K. Quality of work life of Emirati women and its influence on job satisfac-tion and turnover intensatisfac-tion: Evidence from the UAE. J Organ Chang Manag. 2018; 31: 352–370.
https://doi.org/10.1108/JOCM-01-2017-0016
53. Ho C-L, Au W-T. Teaching satisfaction scale: Measuring job satisfaction of teachers. Educ Psychol Meas. 2006; 66: 172–185.https://doi.org/10.1177/0013164405278573
54. Judge TA, Scott BA, Ilies R. Hostility, job attitudes, and workplace deviance: Test of a multilevel model. J Appl Psychol. 2006; 91: 126–138.https://doi.org/10.1037/0021-9010.91.1.126PMID:
16435943
55. Viljevac A, Cooper-Thomas HD, Saks AM. An investigation into the validity of two measures of work engagement. Int J Hum Resour Manag. 2012; 23: 3692–3709.https://doi.org/10.1080/09585192. 2011.639542
56. Sinval J, Pasian SR, Queiro´ s C, Maroˆco J. Brazil-Portugal transcultural adaptation of the UWES-9: Internal consistency, dimensionality, and measurement invariance. Front Psychol. 2018; 9: 1–18.
https://doi.org/10.3389/fpsyg.2018.00001
57. Sinval J, Queiro´ s C, Pasian SR, Maroˆco J. Transcultural adaptation of the Oldenburg Burnout Inven-tory (OLBI) for Brazil and Portugal. Front Psychol. 2019; 10: 1–28.https://doi.org/10.3389/fpsyg.2019. 00001
58. Lambert EG, Qureshi H, Frank J, Klahm C, Smith B. Job stress, job involvement, job satisfaction, and organizational commitment and their associations with job burnout among Indian police officers: A research note. J Police Crim Psychol. 2018; 33: 85–99.https://doi.org/10.1007/s11896-017-9236-y
59. Visser MRM, Smets EMA, Oort FJ, De Haes HCJM. Stress, satisfaction and burnout among Dutch medical specialists. C Can Med Assoc J. 2003; 168: 271–275. Available:http://www.cmaj.ca/content/ cmaj/168/3/271.full.pdf
60. Mijakoski D, Karadzinska-Bislimovska J, Basarovska V, Stoleski S, Minov J. Burnout and work demands predict reduced job satisfaction in health professionals working in a surgery clinic. Open Access Maced J Med Sci. 2015; 3: 166–173.https://doi.org/10.3889/oamjms.2015.020PMID:
27275216
61. Saks AM. Antecedents and consequences of employee engagement. J Manag Psychol. 2006; 21: 600–619.https://doi.org/10.1108/02683940610690169
62. Saks AM, Gruman JA. What do we really know about employee engagement? Hum Resour Dev Q. 2014; 25: 155–182.https://doi.org/10.1002/hrdq.21187
63. Moura D, Orgambı´dez-Ramos A, Gonc¸alves G. Role stress and work engagement as antecedents of job satisfaction: Results from Portugal. Eur J Psychol. 2014; 10: 291–300.https://doi.org/10.5964/ ejop.v10i2.714
64. Locke EA. Construct validity vs. concept validity. Hum Resour Manag Rev. 2012; 22: 146–148.https:// doi.org/10.1016/j.hrmr.2011.11.008
65. Geisinger KF. The metamorphosis to test validation. Educ Psychol. 1992; 27: 197–222.https://doi.org/ 10.1207/s15326985ep2702_5
66. Bozionelos N, Kostopoulos K. What accounts for job satisfaction differences across countries? Acad Manag Perspect. 2010; 24: 82–84.https://doi.org/10.5465/AMP.2010.50304421
67. Huang T-P. Comparing motivating work characteristics, job satisfaction, and turnover intention of knowledge workers and blue-collar workers, and testing a structural model of the variables’ relation-ships in China and Japan. Int J Hum Resour Manag. 2011; 22: 924–944.https://doi.org/10.1080/ 09585192.2011.555134
68. Masuda AD, Poelmans SAY, Allen TD, Spector PE, Lapierre LM, Cooper CL, et al. Flexible work arrangements availability and their relationship with work-to-family conflict, job satisfaction, and turn-over intentions: A comparison of three country clusters. Appl Psychol An Int Rev. 2012; 61: 1–29.
69. Chiu RK, Kosinsk FA. The role of affective dispositions in job satisfaction and work strain: Comparing collectivist and individualist societies. Int J Psychol. 1999; 34: 19–28.https://doi.org/10.1080/ 002075999400078
70. Pichler F, Wallace C. What are the reasons for differences in job satisfaction across Europe individual, compositional, and institutional explanations. Eur Sociol Rev. 2009; 25: 535–549.https://doi.org/10. 1093/esr/jcn070
71. Hauff S, Richter NF, Tressin T. Situational job characteristics and job satisfaction: The moderating role of national culture. Int Bus Rev. 2015; 24: 710–723.https://doi.org/10.1016/j.ibusrev.2015.01.003
72. Huang X, Van De Vliert E. Where intrinsic job satisfaction fails to work: National moderators of intrinsic motivation. J Organ Behav. 2003; 24: 159–179.https://doi.org/10.1002/job.186
73. Adigun IO, Stephenson GM. Sources of job motivation and satisfaction among British and Nigerian employees. J Soc Psychol. 1992; 132: 369–376.https://doi.org/10.1080/00224545.1992.9924712
74. Tabvuma V, Georgellis Y, Lange T. Orientation training and job satisfaction: A sector and gender anal-ysis. Hum Resour Manage. 2015; 54: 303–321.https://doi.org/10.1002/hrm.21650
75. Georgellis Y, Lange T, Tabvuma V. The impact of life events on job satisfaction. J Vocat Behav. 2012; 80: 464–473.https://doi.org/10.1016/j.jvb.2011.12.005
76. Hakim C. Grateful slaves and self-made women: Fact and fantasy in women’s work orientations. Eur Sociol Rev. 1991; 7: 101–121.https://doi.org/10.1093/oxfordjournals.esr.a036590
77. Tait M, Padgett MY, Baldwin TT. Job and life satisfaction: A reevaluation of the strength of the relation-ship and gender effects as a function of the date of the study. J Appl Psychol. 1989; 74: 502–507.
https://doi.org/10.1037/0021-9010.74.3.502
78. Associac¸ão Brasileira de Empresas de Pesquisa. Crite´rio de classificac¸ão econoˆmica do Brasil [Crite-ria for economic classification in Brazil] [Internet]. 2012. Available:http://www.abep.org/
79. International Labour Office. International Standard Classification of Occupations. Isco-08. Geneva, Switzerland: International Labour Organization; 2012.https://doi.org/10.13140/RG.2.1.1419.3126
80. LimeSurvey GmbH. LimeSurvey: An open source survey tool [Computer software] [Internet]. Ham-burg, Germany: Author; 2019. Available:http://www.limesurvey.org
81. Judge TA, Klinger R. Job satisfaction: Subjective well-being at work. In: Eid M, Larsen RJ, editors. The science of subjective well-being. New York, NY: Guilford Press; 2008. pp. 393–413.
82. Judge TA, Erez A, Bono JE, Thoresen CJ. The Core Self-Evaluations Scale: Development of a mea-sure. Pers Psychol. 2003; 56: 303–331.https://doi.org/10.1111/j.1744-6570.2003.tb00152.x
83. International Test Commission. ITC Guidelines for Translating and Adapting Tests (second edition). Int J Test. 2018; 18: 101–134.https://doi.org/10.1080/15305058.2017.1398166
84. Sinval J, Sirgy MJ, Lee D-J, Maroˆco J. The Quality of Work Life Scale: Validity evidence from Brazil and Portugal. Appl Res Qual Life. 2019;https://doi.org/10.1007/s11482-019-09730-3
85. World Health Organization. International classification of diseases for mortality and morbidity statistics [Internet]. 11th rev. 2018. Available:https://icd.who.int/browse11/l-m/en
86. Demerouti E, Bakker AB, Vardakou I, Kantas A. The convergent validity of two burnout instruments: A multitrait-multimethod analysis. Eur J Psychol Assess. 2003; 19: 12–23.https://doi.org/10.1027// 1015-5759.19.1.12
87. Schaufeli WB, Salanova M, Gonza´ lez-Roma´ V, Bakker AB. The measurement of engagement and burnout: A two sample confirmatory factor analytic approach. J Vocat Behav. 2002; 3: 71–92.https:// doi.org/10.1023/A:1015630930326
88. Bakker AB, Demerouti E. Towards a model of work engagement. Career Dev Int. 2008; 13: 209–223.
https://doi.org/10.1108/13620430810870476
89. Rodrigues S, Sinval J, Queiro´ s C, Maroˆco J, Kaiseler M. Transitioning from recruit to officer: An investi-gation of how stress appraisal and coping influence work engagement. Int J Sel Assess. 2019; 27: 152–168.https://doi.org/10.1111/ijsa.12238
90. Sinval J, Marques-Pinto A, Queiro´s C, Maroˆco J. Work engagement among rescue workers: Psycho-metric properties of the Portuguese UWES. Front Psychol. 2018; 8: 1–16.https://doi.org/10.3389/ fpsyg.2017.02229PMID:29403403
91. R Core Team. R: A language and environment for statistical computing (version 3.6.1) [Computer soft-ware] [Internet]. Vienna, Austria: R Foundation for Statistical Computing; 2019. Available:https:// www.r-project.org/
92. RStudio Team. RStudio: Integrated development for R (version 1.2.1330) [Computer software] [Inter-net]. Boston, MA, USA: RStudio, Inc.; 2019. Available:http://www.rstudio.com/