1 Universidade Federal do Paraná, Setor de Ciências da Saúde, Departamento de Nutrição. Av. Pref. Lothário Meissner, 632, Jd. Botânico, 80210-170, Curitiba, PR, Brasil. Correspondence to: CO MEDEIROS. E-mail: <[email protected]>. 2 Universidade Federal do Paraná, Setor de Ciências da Saúde, Programa de Pós-Graduação em Alimentação e Nutrição.
Curitiba, PR, Brasil. How to cite this article
Costa RL, Stangarlin-Fiori L, Bertin RL, Medeiros CO. Satisfaction of nutritionists who work in food service. Rev Nutr. 2019;32:e180168. http://dx.doi.org/10.1590/1678-9865201932e180168
Satisfaction of nutritionists who work
in food service
Satisfação dos nutricionistas que atuam
na alimentação coletiva
Rayane Luizi da COSTA1 0000-0002-7427-1570
Lize STANGARLIN-FIORI2 0000-0001-7904-904X
Renata Labronici BERTIN1 0000-0002-3876-655X
Caroline Opolski MEDEIROS1 0000-0001-7299-9149
A B S T R A C T
Objective
To evaluate the job satisfaction of nutritionists who work in food service in the state of Paraná (Brazil).
Methods
A survey was carried out with 249 nutritionists through a semi-structured online questionnaire, which assessed their profi le, professional activities, and job satisfaction. The Mann-Whitney and Kruskal-Wallis tests and the ordinal logistic regression at a 5% signifi cance level were applied to evaluate the differences and relationship between job satisfaction and the independent variables.
Results
Conclusion
Although most professionals are satisfied, many were indifferent to job satisfaction, which may reflect a low perspective on their current job or poor experience in the food service. These results suggest the need for further actions aiming at raising nutritionists’ perceived professional importance.
Keywords: Food service. Job satisfaction. Nutritionists.
R E S U M O
Objetivo
Avaliar a satisfação no trabalho dos nutricionistas que atuam na área de alimentação coletiva no estado do Paraná.
Métodos
Pesquisa realizada com 249 nutricionistas, por meio de um questionário semiestruturado online, que avaliou o perfil, o exercício profissional e a satisfação do nutricionista. O teste Mann-Whitney, Kruskal-Wallis e a regressão logística ordinal com nível de significância de 5% foram utilizados para avaliar a diferença e relação entre a satisfação e as variáveis.
Resultados
A idade média dos respondentes foi de 31,9±6,4 anos, sendo a maioria do sexo feminino (95,58%) e graduado entre 2000 e 2016 (90,36%). Constatou-se que 55,41% dos nutricionistas estavam satisfeitos no trabalho, 33,68% indiferentes, 6,86% altamente satisfeitos e 4,04% insatisfeitos. As variáveis que mais influenciaram a satisfação foram a idade, os anos de formação, o salário e os dias da semana de trabalho, sendo que a renda explicou positivamente a satisfação. Houve diferença estatística com relação à satisfação dos participantes com a avaliação do conhecimento sobre alimentação coletiva (p=0,0350), a realização de pós-graduação (p=0,0082) e o interesse em atuar em outra área da nutrição que não a alimentação coletiva (p<0,0001).
Conclusão
Apesar de a maioria dos profissionais estarem satisfeitos, muitos foram indiferentes à satisfação no trabalho, podendo refletir ausência de perspectiva sobre seu trabalho atual ou indicar a falta de familiaridade com a alimentação coletiva. Os dados indicam a necessidade de mais ações de valorização junto a esses profissionais.
Palavras-chave: Serviços de alimentação. Satisfação no trabalho. Nutricionistas.
I N T R O D U C T I O N
In several countries, the population’s food consumption pattern has been changing over the years [1], including a significant increase in out-of-home eating during the last few decades [2,3]. In Brazil, this growth is also evident, as 40.2% of food consumption has been done outside home [4]. As a result, there has been an increase in the number of food service companies [5] and, consequently, of job opportunities for nutritionists.
The most important responsibility of nutritionists who work in food service is to manage the food establishment in order to provide quality and nutritionally adequate food to the population [6-8]. In this challenging segment, the role of the nutritionist as a technical manager has become essential, leading them to take on professional and legal commitments in the execution of mandatory and complementary activities in Food Service Systems [8,9].
the company and the nutritionist; to excessive working hours and low pay; and to poor technical knowledge about what constitutes adequate food and health promotion [10,11].
The nutritionists’ dissatisfaction in their work may adversely affect productivity, services,
employees, and customers of the company, in addition to favoring the hire of unqualified people [12]. Therefore, understanding the variables related to the satisfaction of these professionals in food service is important to promote a balance between job offer and demand [13].
Fifty years after the regulation of the nutritionist profession in Brazil – guaranteed by the enactment of Law No.5276/1967 and later by Law No.8234/1991 [14,15] – and development of several career opportunities in food service, there has been little evidence on the job satisfaction of these professionals in this area in the last years, both in Brazil [11] and in other countries [12,16-18].
In Brazil, there is still little research on job satisfaction amongst nutritionists working with
food service. Clear understanding of the factors that influence nutritionists’ job satisfaction may lead
to greater professional valorization. Considering that job satisfaction surveys are of fundamental importance to the area of organizational behavior, this study aims at evaluating the satisfaction of nutritionists who work in the food service industry in the state of Paraná (Brazil).
M E T H O D S
This research is a cross-sectional design that follows an exploratory and quantitative approach, which was conducted with nutritionists who work with food service in the state of Paraná. Ethical aspects were respected and the research was approved by the Research Ethics Committee of the Universidade Federal do Paraná (UFPR, Federal University of Paraná), document No.1.670.435.
Sample
The sample included professionals who worked in one or more areas of food service during
the research period: restaurants, school feeding programs, and/or Worker’s Food Programs [6]. The
sample size was determined considering the total number of nutritionists enrolled in the 8th Regional
Councils of Nutrition (RCN-8) (n=6,791) in the first half of 2016. Considering that the RCN-8 was not able to provide specific data on the number of nutritionists who worked with food service, the percentage used was based on a study by Vasconcelos & Calado [19], which identified that 32.3% of nutritionists were working in this area.
Nutritionists who worked in the public health area in that period (8.8%) [19] were also
included in the sample because some professionals might work in the Workers’ Food Program
or the National School Feeding Program, but were not classified within the food service area.
The Workers’ Food Program and the National School Feeding Program are national programs
designed by the Brazilian Federal Government to promote better nutrition for workers and schoolchildren.
The inclusion criteria for participating in the research were: being a nutritionist; working in the food service industry in Paraná during the research period; being registered in the RCN-8; being at least 18 years-old; and having fully answered the questionnaire.
Research instrument
For data collection, a semi-structured survey questionnaire was developed online in the software Survey Monkey based on literature review. The questionnaire was divided into three blocks: (1) Identification of the participant [12,16,21,22]; (2) Professional activity [6,12,16,21,22]; and (3) Job satisfaction level [12,16,23,24]. The participants were enquired about their sociodemographic and professional profile, including gender, age, characteristics of training, weekly workload, workdays in the week, shifts, number of work sites, work location, income, among others.
Job satisfaction was evaluated through a list of 19 items, which was elaborated by the authors. Each item was assessed using the five-points Likert scale, where 1 represents ‘Extremely dissatisfied’ and 5, ‘Extremely satisfied’ [23,25].
Face validity was conducted with seven nutritionists with experience in food service in order to assess the satisfaction scale [25]. Following evaluation, a pre-test was carried out with seven
nutritionists to assess the ease of access to the questionnaires, the participants’ understanding of
the information and questions presented, and the time required to complete the survey. Then, some changes were performed in order to render the questions clearer.
Data collection
The data was collected between October 2016 and January 2017. Nutritionists were informed of the survey by an e-mail sent by the RCN-8 to those who were registered in the council and additionally by e-mails circulated in city halls in the State of Paraná, catering companies, restaurants, bakeries, event suppliers, nutrition consultants, hospitals, colleges and universities, and elementary and middle school administration offices. The professionals were also invited to disseminate the research. Prior to accessing the online questionnaire, the participants were referred to the Free and Informed Consent Form.
The time to complete the questionnaire was approximately 25 minutes. It was not possible to estimate the exact average response time as the participants were able to pause and restart the online questionnaire at any time. Additionally, the participants could give up on the research after signing the consent form.
Statistical Analysis
Only fully completed questionnaires were considered in the data analysis. The data was analyzed in the statistics software Statistical Package for the Social Sciences version 21.0 (SPSS, Chicago, Illinois, United States) [26] by descriptive statistical analysis. Job satisfaction was evaluated according to satisfaction scores, as recommended by Lopes [27].
indifferent; a score from 60.0 to 79.9 was classified as satisfied; and a score of 80.0 to 100 classified the individual as highly satisfied. In order to evaluate the relationship between job satisfaction and independent variables, an ordinal logistic regression analysis was performed. The variables were selected through Stepwise.
Mann-Whitney and Kruskal-Wallis tests were used to compare job satisfaction with sociodemographic and professional factors. In addition, the reliability of the satisfaction scale was
evaluated in terms of internal consistency using the Cronbach’s alpha coefficient. The level of
significance set in all analyzes was 95% (p<0.05).
R E S U L T S
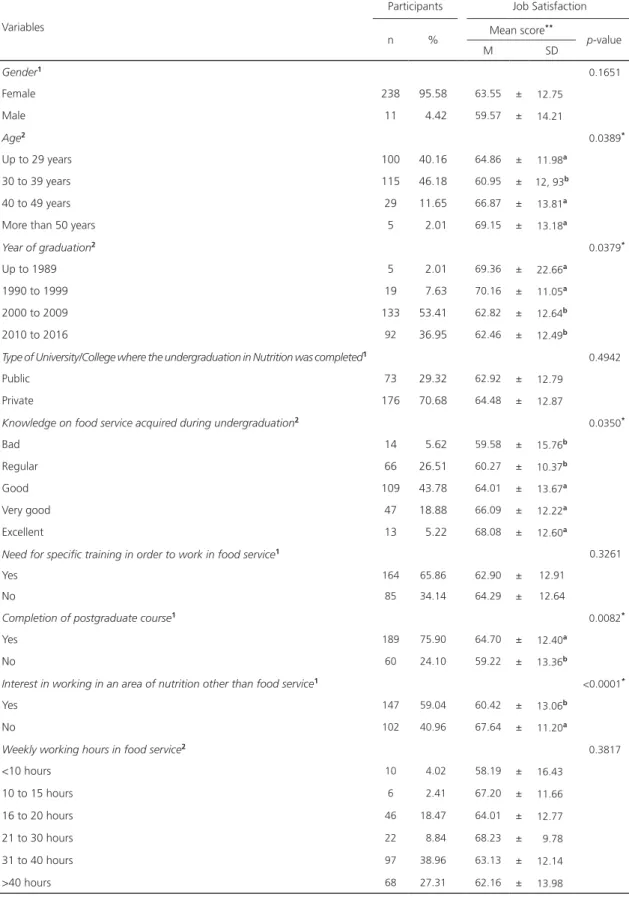
In total, 358 individuals accessed the online survey, but only 249 (69.5%) nutritionists completed the questionnaire. Most respondents were female (95.58%), with an average age of 31.9±6.4 years, who graduated college between 2000 and 2016 (90.36%) in private institutions (70.68%). Most of them completed a postgraduate course (75.90%), and their first employment started up to six months after graduation (71.08%) (Table 1). Although 43.78% of the nutritionists evaluated the knowledge on food service acquired during their undergraduate course as good, 26.51% considered such knowledge regular.
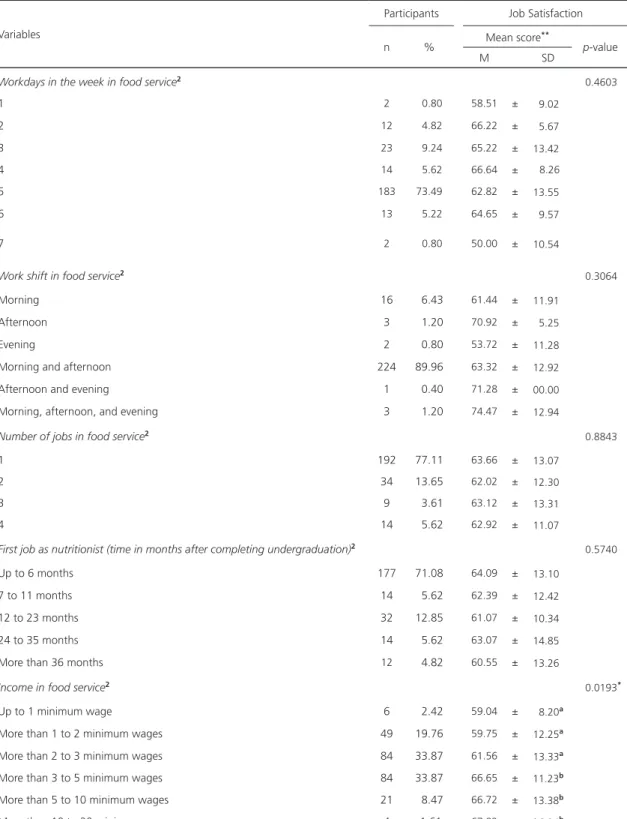
Most nutritionists (38.96%) had a 31 to 40 hour-working week, and 27.31% worked more than 40 hours per week. Furthermore, 73.49% of them worked five days per week; 89.96% worked in morning and afternoon shifts; 77.11% worked as nutritionists in food service in only one location; and 67.74% were paid between two and five minimum wages (Table 1).
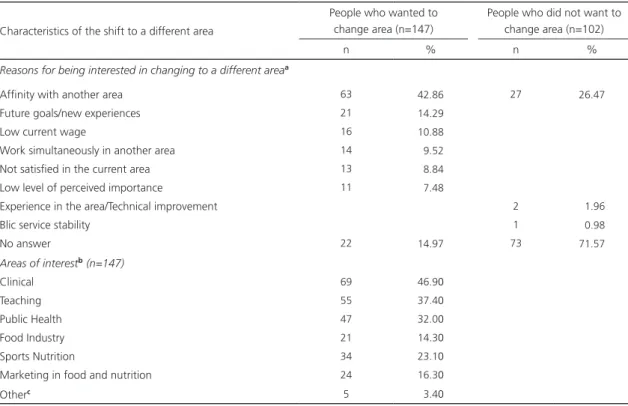
In addition, 65.86% of the nutritionists considered that there was a need for specific training in food service. More than half of the nutritionists (59.04%) reported an interest in another area of nutrition (Table 1). The main reasons to change area were: affinity with another area (42.86%); future objectives/new experiences (14.29%); and low current wage (10.88%). Finally, the areas of greatest interest were: Clinical (46.9%); Teaching (37.4%); and Public Health (32.0%) (Table 2).
Amongst the attributes evaluated, there was statistical difference in relation to job satisfaction according to age (p=0.0389), year of graduation (p=0.0379), knowledge on food service (p=0.0350), conclusion of postgraduate courses (p=0.0082), interest in acting in an area of nutrition other than food service (p<0.0001), and income in the food service industry (p=0.0193) (Table 1).
Table 3 shows the distribution of nutritionists in the state of Paraná during the research period according to the job satisfaction level and attributes assessed. The results were: (a) 6.86% of the nutritionists were highly satisfied; (b) 55.41% were satisfied; (c) 33.68% were indifferent; and (d) 4.04% were dissatisfied. There was statistical difference between the mean percentage of satisfied and dissatisfied individuals (p<0.001).
The items that corresponded to a higher satisfaction level (highly satisfied and satisfied) were: ergonomic conditions (62.75%), communication with subordinates (62.50%), time limit for decision-making (62.50%), conduction of administrative functions (62.50%), noise at work (62.50%), and temperature and humidity in the work environment (62.50%).
Table 1. Distribution of nutritionists who work in the state of Paraná according to sociodemographic characteristics and job satisfaction.
Curitiba (PR), Brazil, 2017.
1 of 2
Variables
Participants Job Satisfaction
n % Mean score
**
p-value
M SD
Gender1 0.1651
Female 238 95.58 63.55 ± 12.75
Male 11 4.42 59.57 ± 14.21
Age2 0.0389*
Up to 29 years 100 40.16 64.86 ± 11.98a
30 to 39 years 115 46.18 60.95 ± 12, 93b
40 to 49 years 29 11.65 66.87 ± 13.81a
More than 50 years 5 2.01 69.15 ± 13.18a
Year of graduation2 0.0379*
Up to 1989 5 2.01 69.36 ± 22.66a
1990 to 1999 19 7.63 70.16 ± 11.05a
2000 to 2009 133 53.41 62.82 ± 12.64b
2010 to 2016 92 36.95 62.46 ± 12.49b
Type of University/College where the undergraduation in Nutrition was completed1 0.4942
Public 73 29.32 62.92 ± 12.79
Private 176 70.68 64.48 ± 12.87
Knowledge on food service acquired during undergraduation2 0.0350*
Bad 14 5.62 59.58 ± 15.76b
Regular 66 26.51 60.27 ± 10.37b
Good 109 43.78 64.01 ± 13.67a
Very good 47 18.88 66.09 ± 12.22a
Excellent 13 5.22 68.08 ± 12.60a
Need for specific training in order to work in food service1 0.3261
Yes 164 65.86 62.90 ± 12.91
No 85 34.14 64.29 ± 12.64
Completion of postgraduate course1 0.0082*
Yes 189 75.90 64.70 ± 12.40a
No 60 24.10 59.22 ± 13.36b
Interest in working in an area of nutrition other than food service1 <0.0001*
Yes 147 59.04 60.42 ± 13.06b
No 102 40.96 67.64 ± 11.20a
Weekly working hours in food service2 0.3817
<10 hours 10 4.02 58.19 ± 16.43
10 to 15 hours 6 2.41 67.20 ± 11.66
16 to 20 hours 46 18.47 64.01 ± 12.77
21 to 30 hours 22 8.84 68.23 ± 9.78
31 to 40 hours 97 38.96 63.13 ± 12.14
Table 1. Distribution of nutritionists who work in the state of Paraná according to sociodemographic characteristics and job satisfaction.
Curitiba (PR), Brazil, 2017.
2 of 2
Variables
Participants Job Satisfaction
n % Mean score
**
p-value
M SD
Workdays in the week in food service2 0.4603
1 2 0.80 58.51 ± 9.02
2 12 4.82 66.22 ± 5.67
3 23 9.24 65.22 ± 13.42
4 14 5.62 66.64 ± 8.26
5 183 73.49 62.82 ± 13.55
6 13 5.22 64.65 ± 9.57
7 2 0.80 50.00 ± 10.54
Work shift in food service2 0.3064
Morning 16 6.43 61.44 ± 11.91
Afternoon 3 1.20 70.92 ± 5.25
Evening 2 0.80 53.72 ± 11.28
Morning and afternoon 224 89.96 63.32 ± 12.92
Afternoon and evening 1 0.40 71.28 ± 00.00
Morning, afternoon, and evening 3 1.20 74.47 ± 12.94
Number of jobs in food service2 0.8843
1 192 77.11 63.66 ± 13.07
2 34 13.65 62.02 ± 12.30
3 9 3.61 63.12 ± 13.31
4 14 5.62 62.92 ± 11.07
First job as nutritionist (time in months after completing undergraduation)2 0.5740
Up to 6 months 177 71.08 64.09 ± 13.10
7 to 11 months 14 5.62 62.39 ± 12.42
12 to 23 months 32 12.85 61.07 ± 10.34
24 to 35 months 14 5.62 63.07 ± 14.85
More than 36 months 12 4.82 60.55 ± 13.26
Income in food service2 0.0193*
Up to 1 minimum wage 6 2.42 59.04 ± 8.20a
More than 1 to 2 minimum wages 49 19.76 59.75 ± 12.25a
More than 2 to 3 minimum wages 84 33.87 61.56 ± 13.33a
More than 3 to 5 minimum wages 84 33.87 66.65 ± 11.23b
More than 5 to 10 minimum wages 21 8.47 66.72 ± 13.38b
More than 10 to 20 minimum wages 4 1.61 67.82 ± 26.24b
Note: 1Mann-Whitney Test; 2Kruskal-Wallis Test (Dunn test: same letters do not differ statistically, *p>0.05). **Minimum value is 0 and maximum
value is 100. Score from 0 to 39.9 was classified as dissatisfied; 40.0 to 59.9 was classified as indifferent; 60.0 to 79.9 was classified as satisfied;
Table 2. Information on the interest of nutritionists who work in food service in changing to a different area. Curitiba (PR), Brazil, 2017.
Characteristics of the shift to a different area
People who wanted to change area (n=147)
People who did not want to change area (n=102)
n % n %
Reasons for being interested in changing to a different areaa
Affinity with another area 63 42.86 27 26.47
Future goals/new experiences 21 14.29
Low current wage 16 10.88
Work simultaneously in another area 14 9.52
Not satisfied in the current area 13 8.84
Low level of perceived importance 11 7.48
Experience in the area/Technical improvement 2 1.96
Blic service stability 1 0.98
No answer 22 14.97 73 71.57
Areas of interestb(n=147)
Clinical 69 46.90
Teaching 55 37.40
Public Health 47 32.00
Food Industry 21 14.30
Sports Nutrition 34 23.10
Marketing in food and nutrition 24 16.30
Otherc 5 3.40
Note: aParticipants were able to choose more than one answer; bOnly those interested in changing to a different area answered this question; cOther areas the participants would like to work in: entrepreneurship (n=2); supply chain (n=1); sanitary control (n=3); nutrition focused on
gastronomy (n=2); aesthetic nutrition (n=1); nutritional education (n=1).
Table 3. Scale of job satisfaction presented to nutritionists who work in food service in the state of Paraná, Brazil – internal reliability of the scale and distribution of nutritionists. Curitiba (PR), Brazil, 2017.
Scale of satisfaction Highly satisfied Satisfied Indifferent Dissatisfied
n (%) n (%) n (%) n (%)
Professional motivation 17 7.00 133 54.73 83 34.16 10 4.12
Perceived professional importance 17 6.83 138 55.42 84 33.73 10 4.02
Income 17 6.85 137 55.24 84 33.87 10 4.03
Job stability 17 6.88 137 55.47 83 33.60 10 4.05
Opportunities for growth in the company 17 6.85 137 55.24 84 33.87 10 4.03
Relationship with superiors 17 6.83 138 55.42 84 33.73 10 4.02
Relationship with subordinates 17 6.83 138 55.42 84 33.73 10 4.02
Communication with superiors 17 6.88 136 55.06 84 34.01 10 4.05
Communication with subordinates 17 6.85 138 55.65 83 33.47 10 4.03
Time limit for decision-making 17 6.85 138 55.65 83 33.47 10 4.03
Menu planning budget 17 6.83 138 55.42 84 33.73 10 4.02
Conduct administrative functions 17 6.85 138 55.65 83 33.47 10 4.03
Division of tasks 17 6.83 138 55.42 84 33.73 10 4.02
Working hours 17 6.83 138 55.42 84 33.73 10 4.02
Workload 17 6.88 136 55.06 84 34.01 10 4.05
Noise in the work environment 17 6.85 138 55.65 83 33.47 10 4.03
Ergonomic conditions 17 6.88 138 55.87 82 33.20 10 4.05
Temperature and humidity in the work environment 17 6.85 138 55.65 83 33.47 10 4.03
Physical structure of the work site 17 6.83 138 55.42 84 33.47 10 4.02
Level of overall satisfaction 6.86 55.41 33.68 4.04
Table 4. Ordinal logistic regression of variables associated with job satisfaction levels of nutritionists who work in food service in the state of Paraná. Curitiba (PR), Brazil, 2017
Variables
Satisfaction level Regression
βa
adjusted
b p-value CI (95%)
Age -0.091 0.020 -0.167 -0.015
Yearc -0.109 0.013 -0.195 -0.023
Income 0.436 0.002 0.157 0.715
Daysd -0.304 0.032 -0.580 -0.027
Note: aRegression coefficient; bAdjusted by: time to obtain the first job as a nutritionist, number of work sites, years of experience in the area,
and weekly workload; cYears of graduation/training; dWorkdays in the week.
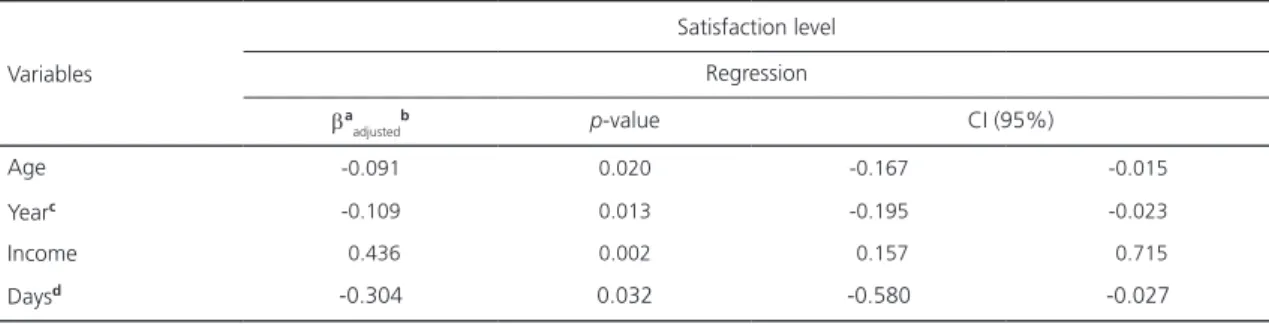
age, training time, income, and workdays in the week influenced job satisfaction (CI95%) (Table 4). However, income was the only variable that explained satisfaction positively, while age, years of training, and days worked in the week explained the results negatively.
D I S C U S S I O N
The results of this study enabled the assessment of the job satisfaction of nutritionists who work in food service in the State of Paraná, Southern Brazil. The online research made it possible to approach a greater number of professionals, even though a portion of them gave up on the survey after having accepted the invitation. However, it is difficult to state the reason for the withdrawal. According to Buchanan & Williams [28], the dropout in online surveys may be higher compared to face-to-face research because the participant simply closes the browser window to finish the process. The reasons for quitting may be diverse, but researchers have not yet agreed on how to reduce the dropout rates [28,29]. In any case, the results obtained in this research are of great relevance, even considering the dropout.
Nutritionists were satisfied with working in food service, including with exerting administrative functions. Sauer et al. [12] evaluated the job satisfaction of nutritionists registered in the American Dietetic Association (ADA) (n=1,200) using a questionnaire comprising 36 items. They found higher satisfaction levels among professionals who had greater administrative responsibilities, especially in the area of budget management. Nevertheless, nutritionists were mostly dissatisfied in other studies [11] – perhaps because they performed activities outside of their scope [30]. Additionally, professional motivation remains being the most dissatisfactory attribute among nutritionists in food service.
Using a central (neutral) category on the scale can make respondents feel more comfortable when answering a survey. However, the neutral category can generate ambivalence and indifference,
shading the respondents’ true opinion [31]. In addition, job satisfaction is related to feeling joy during
work. This outcome becomes a serious concern since there is no concrete opinion on the subject. Additionally, this may reflect a lack of perspective on the nutritionist’s current work, as well as poor overall wellbeing and life satisfaction levels. Conclusions on life satisfaction are reported by Grace-Farfaglia et al. [18], who evaluated personal life satisfaction levels amongst nutritionists in the US. Work-life balance showed to be the main factor influencing life satisfaction.
Another relevant factor to the job satisfaction of nutritionists was their interest in changing work area. Most participants were interested in changing area, especially the ones who reported low job satisfaction levels. This result is in accordance with another research, which showed that dissatisfied workers either contribute more significantly to labor turnover [32] or have higher intention to change jobs [12].
Individuals older than 40 years and those who graduated in the 90’s showed higher job satisfaction levels. A similar result was found by Visser et al. [16] and Chin et al. [24], who reported that age and time of experience independently have a positive influence on job satisfaction. However, time of experience did not impact on life satisfaction among nutritionists [18].
However, younger professionals may evaluate as positive some aspects that middle-aged workers believe to be causes of dissatisfaction. This is a common scenario, as younger workers usually desire to learn and acquire new experiences. On the other hand, older professionals adapt better to new employments and have more objective views, as they usually have greater professional experience. Thus, older professionals may assign higher values to aspects that others consider dissatisfactory [33].
Proper training has also influence on job satisfaction. Nutritionists who were more satisfied at work were those who classified their knowledge in food service as excellent. For instance, Almeida et al. [34] conducted a systematic review and observed the importance of the relationship between theory and practice, the dimensions of teaching, research and extension, and practical activities and internships for the development of skills and competencies of nutritionists who work in the public health area.
Even though this study focuses on nutritionists who work with food service, their relationship with public health is important, since these professionals have to comply with public policies that are
currently included in the activities of Food Service Systems (e.g.: Workers’ Food Program; National
School Feeding Program) [8].
These results reinforce the commitment that undergraduate courses of nutrition should have in the construction of pedagogical political projects. Such projects should be elaborated collectively and centered on the student as subject, while lecturers should be facilitators of the teaching-learning process, respecting both the Curriculum Guidelines of the National
Nutrition Undergraduate Course [35] and the nutritionist’s area of activity. Not only the
nutritionists’ attributions [7] influence their job satisfaction, but also the knowledge acquired during
undergraduate and postgraduate courses.
Thus, undergraduate courses should comprise modules on wellness and health self-management, which contribute to life satisfaction.
In addition, continued training should also be emphasized, since the professionals who completed postgraduate courses were more satisfied with their profession – similar results were found by Abad-Jorge & Butcher [36]. This fact shows that knowledge and constant update can provide better opportunities for professional advancement and value. It is noteworthy that only the knowledge obtained from undergraduate training may be insufficient to manage public health issues that keep increasing in complexity.
Moreover, job satisfaction was affected by income, which explained the results positively. A study by Chin et al. [24] with nutritionists in South Korea presented similar results. Other studies have also shown that low pay is the major cause of professional dissatisfaction [7,11,16]. Sauer et al. [12] also stress that the relationship between job satisfaction and income can often be related not only to the salary itself, but also to the position occupied by the professional.
Most nutritionists that participated in this research had a monthly income between R$1,760.00 and R$4,440.00, but not all of them worked 40 hours/week. Currently, the National Reference for
a nutritionist’s wage value (44 hours/week) is R$2,389.36 per month [37], which corresponds to 2.5
minimum wages [38].
The results found in this research indicate the need for higher perceived professional importance through the action of labor unions in various Brazilian states, since the National Reference
for nutritionists’ wage does not follow the annual adjustment of the minimum wage. It is worth
highlighting the absence of a labor union operating in the state of Paraná.
This study presents some limitations. The sample was non-probabilistic, thus the data may not represent the reality of all nutritionists in the state of Paraná. In addition, even though this research had been widely publicized, some professionals may have not managed to access it or have not received the invitation. Naturally, not all professionals who were invited to the survey accepted to participate. Even though the satisfaction scale presented excellent internal consistency and a face validity step was performed, further researches are needed to validate this satisfaction scale and assess its reproducibility. Despite some limitations, this research adds important data to the literature on job satisfaction levels of nutritionists who work with food service as it identifies aspects that might
increase nutritionists’ perceived professional importance.
C O N C L U S I O N
Most nutritionists who participated in this research were satisfied with their work in the food service industry, and their income was strongly associated with job satisfaction. However, the considerable percentage of professionals who were indifferent to job satisfaction suggested that either some participants might not be aware of the issues mentioned, or they perform their activities without focusing on job satisfaction. They may also not be enough familiarized with the food service segment.
C O N T R I B U T O R S
RL COSTA and CO MEDEIROS contribution to data acquisition and drafting the article. CO MEDEIROS, L STANGARLIN-FIORI and RL BERTIN contribution to conception and design and critically revising it for important intellectual content. The authors contributed to data analysis and interpretation and final approval of the article.
A C K N O W L E D G M E N T S
The 8th Regional Councils of Nutrition for the support in our research. The Academic Publishing Advisory
Center (CAPA - www.capa.ufpr.br) of the Universidade Federal do Paraná for assistance with English language editing.
R E F E R E N C E S
1. Popkin BM. Nutrition transition and the global diabetes epidemic. Curr Diab Rep. 2015;5(9):64. http://dx.doi. org/10.1007/s11892-015-0631-4
2. Lund TB, Kjærnesb U, Holma L. Eating out in four Nordic countries: National patterns and social stratification. Appetite. 2017;119(1):23-33. http://dx.doi.org/10.1016/j.appet.2017.06.017
3. D’Addezio L, Turrini A, Capacci S, Saba A. Out-of-home eating frequency, causal attribution of obesity and support to healthy eating policies from a cross-European survey. Epidemiol Biostat Public Health. 2014;11(4):e9921-1-13. http://dx.doi.org/10.2427/9921
4. Instituto Brasileiro de Geografia e Estatística. Pesquisa de orçamentos familiares 2008-2009: análise do consumo alimentar pessoal no Brasil. Rio de Janeiro: IBGE; 2011.
5. Associação Brasileira das Indústrias de Alimentação. Mercado. 2016 [citado 2018 dez 9]. Disponível em: https://www.abia.org.br/vsn/tmp_2.aspx?id=319
6. Conselho Regional de Nutricionistas. Resolução CFN nº380/2005. Dispõe sobre a definição das áreas de atuação do nutricionista e suas atribuições, estabelece parâmetros numéricos de referência por área de atuação e dá outras providências. Brasília: Diário Oficial da União; 2006.
7. European Federation of the Associations of Dietitians. Position paper on the role of the food service dietitian. 2016 [cited 2018 Dec 9]. Available from: http://vladio.be/wp-content/uploads/2017/06/Postition-paper-on-the-role-of-the-food-service-dietitian.pdf
8. Conselho Regional de Nutricionistas. Resolução CFN nº600/2018. Dispõe sobre a definição das áreas de atuação do nutricionista e suas atribuições, indica parâmetros numéricos mínimos de referência, por área de atuação, para a efetividade dos serviços prestados à sociedade e dá outras providências. Brasília: Diário Oficial da União; 2018.
9. Academy Quality Management Committee. Academy of Nutrition and Dietetics: Revised 2017 scope of practice for the registered dietitian nutritionist. J Acad Nutr Diet. 2018;118(1):141-65. http://dx.doi. org/10.1016/j.jand.2017.10.002
10. Souza AA, Bezerra OMPA, Bonomo E, Silva CAM. Atuação de nutricionistas responsáveis técnicos pela ali-mentação escolar de municípios de Minas Gerais e Espírito Santo. Ciênc Saúde Coletiva. 2017;22(2):593-606. http://dx.doi.org/10.1590/1413-81232017222.12272016
11. Souza JCN, Fagundes A, Silva DG, Barbosa KBF. Education, satisfaction and professional prospects of nutrition graduates of a federal university in the Brazilian northeast. Demetra. 2018;13(1):5-20. http:// dx.doi.org/10.12957/demetra.2018.28602
12. Sauer K, Canter D, Shanklin C. Job satisfaction of dietitians with management responsibilities: An exploratory study supporting ADA’s research priorities. J Acad Nutr Diet. 2012;112(5):S6-11. http://dx.doi.org/10.1016/j. jand.2012.03.020
14. Congresso Nacional (Brasil). Lei nº5.276, de 24 de abril de 1967. Dispõe sobre a profissão de Nutricionista, regula o seu exercício, e dá outras providências. Brasília: Diário Oficial da União; 1967.
15. Congresso Nacional (Brasil). Lei nº8.234, de 17 de Setembro de 1991. Regulamenta a profissão de Nutricionista e determina outras providências. Brasília: Diário Oficial da União; 1991.
16. Visser J, Mackenzie A, Marais D. Job satisfaction of South African registered dietitians. S Afr J Clin Nutr. 2012 [cited 2018 Dec 9];25(3):112-9. Available from: http://www.sajcn.co.za/index.php/SAJCN/article/view/615
17. Grace-Farfaglia P, Pickett-Bernard D, Gorman AW, Dehpahlavan J. Health philosophy of dietitians and its implications for life satisfaction: An exploratory study. Behav Sci. 2017;7(67):eE67. http://dx.doi.org/10.3390/ bs7040067
18. Grace-Farfaglia PM, Pickett-Bernard DL, Gorman AW, Dehpahlavan J. Keep calm and lead by example: Healthy lifestyles of dietitians and satisfaction with life. J Prev Med. 2018;3(1):1-6. http://dx.doi.org/10.21767/2572-5 483.100027
19. Vasconcelos FAG, Calado CLA. Profissão nutricionista: 70 anos de história no Brasil. Rev Nutr. 2011;24(4):605-17. http://dx.doi.org/10.1590/S1415-52732011000400009
20. Dean AG, Sullivan KM, Soe MM. OpenEpi: Open source epidemiologic statistics for public health. [cited 2018 Dec 9]. Available from: https://www.openepi.com/SampleSize/SSPropor.htm
21. Conselho Federal de Nutricionistas. Perfil da atuação profissional do nutricionista no Brasil. Brasília: CFN; 2006.
22. Mello AL, Vidal Júnior PO, Sampaio LR, Santos LAS, Freitas MCS, Fontes GAV. Perfil do nutricionista do programa nacional de alimentação escolar na região Nordeste do Brasil. Rev Nutr. 2012;25(1):119-32. http:// dx.doi.org/10.1590/S1415-52732012000100011
23. Saane N, Sluiter JK, Verbeek JHAM, Frings-Dresen MHW. Reliability and validity of instruments measuring job satisfaction: A systematic review. Occup Med. 2003;53(3):191-200. http://dx.doi.org/10.1093/occmed/ kqg038
24. Chin JH, You JS, Chang KJ. Comparison of role conflict, self-efficacy, job satisfaction, and job involvement between nutrition teachers and dietitians at School Food Service in Incheon Metropolitan City-Focusing on the interactions between nutrition teachers and dietitians. Korean J Nutr. 2012;5(1):64-79. http://dx.doi. org/10.4163/kjn.2012.45.1.64
25. Di Iorio CK. Measurement in health behavior: Methods for research and education. San Francisco: Josset Bass; 2005.
26. International Business Machines Corporation. IBM SPSS Statistics for Windows, Version 21.0. Armonk: IBM Corp; 2012.
27. Lopes LFD. Métodos quantitativos. Santa Maria: Universidade Federal de Santa Maria; 2016.
28. Buchanan T, Williams JE. Ethical issues in psychological research on the Internet. In: Gosling SD, Johnson, JA. Advanced methods for conducting online behavioral research. Washington (DC): American Psychological Association; 2010.
29. Allen PJ, Roberts LD. The impact of academic sponsorship on Web survey dropout and item non response. First Monday. 2016;21(2). http://dx.doi.org/10.5210/fm.v21i2.6144
30. Pires PFF, Retondario A, Almeida CCB, Schmidt ST, Beux MR, Ferreira SMR. Professional practice of dietitians in the Brazilian School Feeding Program: A multiple case study. Rev Nutr. 2017;30(4):499-510. http://dx.doi. org/10.1590/1678-98652017000400009
31. Willts FK, Theodori GL, Luloff AE. Another look at Likert Scales. J Rural Soc Sci. 2016 [cited 2018 Dec 9];31(3):126-39. Available from: http://journalofruralsocialsciences.org/pages/Articles/JRSS%202016%2031/3/JRSS%202016 %2031%203%20126-139.pdf
32. Machado DC, Silva AF. Um indicador de não satisfação no trabalho e a mobilidade do mercado de trabalho: um estudo para homens e mulheres. Nova Econ. 2014;24(1):123-40. http://dx.doi.org/10.1590/0103-6 351/1410
34. Almeida GM, Oliveira KHD, Monteiro JS, Medeiros MAT, Recine EGIG. Educational training of nutritionists in Public Health Nutrition: A systematic review. Rev Nutr. 2018;31(1):97-117. http://dx.doi.org/10.1590/1678-9 8652018000100009
35. Conselho Nacional de Educação. Câmara de Educação Superior. Resolução CNE/CES Nº5, de 7 de novembro de 2001. Institui Diretrizes Curriculares Nacionais do Curso de Graduação em Nutrição. Diário Oficial da União, Seção 1, p.19, 2001.
36. Abad-Jorge A, Butcher MF. Job satisfaction and professional characteristics of registered dietitians a survey of the impact of educational level during entry level practice. Top Clin Nutr. 2016;31(2):134-46. http://dx.doi. org/10.1097/TIN.0000000000000064
37. Federação Nacional dos Nutricionistas. Tabela de honorários nutricionistas. 2017 [citado 2018 dez 9]. Dispo-nível em: https://www.fnn.org.br/conteudos/arquivos/tabela_2017.pdf
38. Presidência da República (Brasil). Decreto 8.948, de 29 de dezembro de 2016. Regulamenta a Lei nº13.152, de 29 de julho de 2015, que dispõe sobre o valor do salário mínimo e a sua política de valorização de longo prazo. Diário Oficial da União, Seção 1, p.12, 2016.