Does Impact Investment remain a
niche market in the future?
An empirical study in Germany and Portugal
Vivian Voß
Dissertation written under the supervision of Prof. Susana Frazao
Pinheiro
Dissertation submitted in partial fulfilment of requirements for the MSc in Management, at the Universidade Católica Portuguesa, 19th May 2017.
II
Does Impact Investing remain a niche market in the future?
An empirical study in Germany and Portugal
Vivian Voß
Abstract
The purpose of this dissertation derives from the fact that the market for impact investing has recently not met its anticipated growth expectations. In order to scale from a niche to a mass market impact investing also needs to attract retail investors, since additionally demand for impact investing is driven from the bottom up. Thus, for the market to evolve to a mass market in the future the following question arises: What majorly impedes future retail investors from consideration? In order to answer this question an empirical study was conducted in Germany and Portugal with students as a proxy for future individual investors. The study strives to examine the perception of impediments of impact investing defined in the general literature alongside three dimensions: financial return, social return and market infrastructure. The main findings of the study are that there is an indication for a shift in mind-set regarding financial profitability of social enterprises as well as objectives of investment towards social impact. This perception is not dependent on whether sample respondents have had previous investment experience or not, thus supporting the conclusion. Although future investors are willing to trade of financial return for social impact, measurement and accountability still follow traditional return logics. There is a high need for standardized measurement and demonstration of impact achieved. In addition, the perception of challenges of II was found to vary across national boundaries.
Resumo
O propósito desta dissertação prende-se com o facto de que o mercado de investimentos de impacto não tem vindo a refletir às expectativas de crescimento previstas. Para crescer de um nicho de mercado para um mercado em massa, o investimento de impacto deverá atrair investidores de retalho, dado que a procura acrescida de investimento de impacto é impulsionada de baixo para cima. Assim, para este mercado evoluir para um mercado em massa, a seguinte questão coloca-se: O que impede de forma significativa investidores de retalho de o considerarem? De forma a responder a esta questão, foi levado a cabo um estudo empírico com estudantes na Alemanha e em Portugal como um indicador para futuros investidores individuais. O estudo procura analisar a perceção dos entraves do investimento de impacto definidos na literatura, bem como em três dimensões: retorno financeiro, retorno social e infraestrutura de mercado. As principais conclusões do estudo são que há uma indicação para uma mudança na mentalidade relacionada com rentabilidade financeira das empresas sociais, bem como com os objetivos de investimento para o impacto social. Esta perceção não depende do facto de os inquiridos terem tido uma experiência de investimento anterior ou não, corroborando assim a conclusão. Muito embora futuros investidores estejam dispostos a comprometer o retorno financeiro pelo impacto social, a medição e a
III
responsabilização seguem as lógicas de retorno tradicionais. Há uma grande necessidade de medição padronizada e demonstração do impacto alcançado. Além disso, concluiu-se que perceção dos desafios de II varia entre as fronteiras nacionais.
IV
Acknowledgements
I would like to take the opportunity to thank all those who made this dissertation possible.
To start with, I would like to thank Professor Susana Frazao Pinheiro for her support and guidance throughout the course of this thesis as well as her continuous interest for the topic.
I would like to express my sincerest gratitude to my parents and brother for their support throughout my entire studies and the opportunities made possible by them without which I would have not become the same person. Finally, I would like to take the time to thank my friends for their motivation and help at any time, and to my Lisbon Master friends, the great Lisbon times will be missed.
V
Table of Contents
Abstract ... II Acknowledgements ... IV List of Figures ... VII List of Tables ... VII Glossary ... VIII
1. Introduction ... 1
2. Literature Review ... 2
2.1. Impact Investing ... 2
2.1.1. Definition and Framework ... 2
2.2.2. Demarcation ... 5
2.2. Impact Investors ... 5
2.3. Current State of the Market and Development ... 7
2.4. Impediments of Impact Investing ... 9
2.5. Summary and hypotheses ... 12
3. Methodology ... 12
3.1. Sample ... 12
3.2. Questionnaire ... 14
3.3. Measurements and descriptive statistics ... 15
4. Results ... 19
4.1. General Results ... 19
4.2. Effect of investment experience on impediment perception ... 21
4.3. Effect of nationality on impediment perception ... 23
5. Discussion ... 25
VI
7. Conclusion ... 28 Appendices ... VI Appendix 1 – Sample Composition ... VII Appendix 2 – Survey Questionnaire ... IX Appendix 3 – Test Sample Composition ... XVII Appendix 4 – Questionnaire Item by Impediment ... XVIII Appendix 5 – F-test two sample for variance by variable investment experience ... XX Appendix 6 – F-Test two sample for variance by variable nationality ... XXI References ... XXII
VII
List of Figures
Figure 1: Impact investing asset class / return rate spectrum ... 4
Figure 2: Target financial returns sought in II ... 4
Figure 3: Source of funds for impact investment fund managers by survey score ... 6
Figure 4: Distribution of Global Asset Ownership by Investor Type, 2011 ... 7
Figure 5: Total II AUM by year ... 8
Figure 6: Asset Allocation across Sectors ... 8
List of Tables
Table 1: Summary challenges of impact investing ... 11Table 2: Distribution previous investment experience ... 15
Table 3: Distribution familiarity with terms used in II ... 16
Table 4: Descriptive statistics sub-groups ... 17
Table 5: Descriptive statistics sector preferences... 17
Table 6: Frequencies age groups ... 18
Table 7: Frequencies field of study ... 18
Table 8: Frequencies nationality ... 19
Table 9: Descriptive statistics challenges related to financial returns ... 20
Table 10: Descriptive statistics challenges related to market infrastructure ... 21
Table 11: Descriptive statistics by level of investment experience ... 22
Table 12: Independent Sample T-test for equality of means by level of investment experience... 23
Table 13: Descriptive statistics by nationality ... 24
VIII
Glossary
Abbreviation Meaning
AUM Assets under Management
BME Business Model Innovation & Execution CA Capital Allocation
CSR Corporate Social Responsibility df Degrees of Freedom
DEMO Demonstration
DFI Development Finance Institution
ESG Environmental, Social and Governance investing FR Financial Return
GIIN Global Impact Investing Network GIIRS Global Impact Investing Rating System HNWI High Net Worth Individual
II Impact Investing
IRIS Impact Reporting and Investment Standards MI Market Infrastructure
SE Social Entrepreneur SR Social Return
SROI Social Return on Investment SRI Socially Responsible Investment STD Standardization
USD United States Dollar VAL Valuation
VC Venture Capitalism WEF World Economic Forum
1
1. Introduction
As an achievement of the corporate social responsibility movement the relevance of social conditions to business success increased in the last quarter of the twentieth century resulting in the socially responsible investing movement (Bugg-Levine & Goldstein, Impact Investment: Harnessing Capital Markets to Solve Problems at Scale, 2009). According to Clark et al. (2012) the “old antithesis between society and business is dissolving” even further with impact investing nowadays, outlining that business opportunities can often be found in solving social problems. Impact investments are defined as investments that pursue the generation of measurable social or ecological impact alongside a financial return (GIIN, 2016). In recent years the engagement to deploy capital in such a way, that solves some of the world’s most pressing economic, social and environmental challenges, has increased.
However, the high expectations regarding the development of the impact investing market to a USD 1 trillion industry as forecasted by J.P. Morgan in 2010 (O'Donohoe, Leijonhufvud, & Saltuk, 2010) have fallen short. In order for the emerging sector to realize its attributed potential in the future, “a way to incorporate mainstream investors into the mix” needs to be found (World Economic Forum, 2013). As demand for impact investing is driven from the bottom up (Tickle, 2016), it is therefore crucial to understand what impedes small individual investors from allocating capital to the sector. Therefore the main research question addressed in this dissertation is the following:
What are the major challenges that impede future retail investors from considering an investment for impact?
For the purpose of exploring investor sentiments the following assumption is made: German and Portuguese students will be used as a proxy for future retail investors. Moreover, in order to answer the research question the following structure is adopted: Since this dissertation explores the sphere of impact investing chapter 2. Literature Review will provide a review of previous academic literature and market data within five sub-chapters. The first sub-chapter is concerned with defining the practice and scope of impact investing while giving particular attention to its key characteristics. The second sub-chapter focuses on which types of investors are currently prominent in impact investing followed by the current state of the market and its recent as well as its expected
2
development in the third sub-chapter. Thereafter, the fourth sub-chapter places particular emphasis on academic research dedicated to the general impediments of impact investing while the final sub-chapter accomplishes the theoretical background.
Subsequently in chapter 3. Methodology an empirical study conducted will be outlined to identify which impediments of impact investment found in the general literature apply to future individual investors in Germany and Portugal. For this purpose three sub-chapters present the characteristics of the sample, the questionnaire as well as the measurement used in the quantitative study including its descriptive statistics.
Thereafter, in chapter 4. Results the general findings of the empirical study will be pointed out followed by a detailed analysis of effects of investment experience and nationality on the perception of impediments of impact investing. The results and their implications on the impact investing market are discussed in chapter 5. Discussion.
Finally, the limitations of this dissertation and fields for future research will be depicted in chapter
6. Limitations and future research followed by chapter 7. Conclusions, summarizing the findings
of this study.
2. Literature Review
2.1. Impact Investing
2.1.1. Definition and Framework
The broader term of social finance includes all kinds of concepts directed to achieve social and ecological goals by deploying financial capital (Glänzel & Scheuerle, 2016). The concept of investing money in assets that offer a different type of return than a financial yield, thus a social or environmental impact, has been witnessed for centuries (Adam, 2012). However, according to Bugg-Levine and Emerson (2011) the idea of striving for social and ecological impact without sacrificing financial objectives distinguishes the emerging approach of Impact Investing (II) from previous concepts.
In detail, the means of II is to finance organizations that achieve social or ecological impact by applying commercial capital market mechanisms (Nicholls, 2010). Thus II is an innovation suggested to redefine prevalent institutional logics as to capitalize financial markets for social
3
benefit (Nicholls, 2010) (Moore, Westley, & Brodhead, Social finance intermediaries and social innovation, 2012b). Moreover, O’Donohoe et al. (2010) state that market capitalism fosters the evolvement of more competitive business models to address urgent social challenges. By providing financing (equity, debt or mezzanine1) to social enterprises investors are entitled to a financial
return in form of dividends or interest payments. Given the social purpose of the funded organization, the financial return is accompanied by a social or ecological impact. Besides the funding of the organization the investees often receive sponsorship for managerial development as practiced in commercial venture capitalism (VC) (Glänzel & Scheuerle, 2016). Impact investments can be made in both, emerging and developed markets and “address the world’s most pressing challenges in sectors such as sustainable agriculture, renewable energy, [ecological] conservation, microfinance, and affordable and accessible basic services including housing, healthcare, and education” (GIIN.org, 2017).
Based on Gregory (2016) and the Global Impact Investing Network (GIIN), the following core characteristics essential to II can be identified in order to further define its pattern:
Intentionality: The investor’s intention to have a positive socio-ecological impact is the essential element of II.
Investment opportunities: Financially sustainable investment opportunities, that have a financial return on capital or, at minimum, a return of capital, are critical for II to be initiated.
Impact measurement: The measurement and reporting of social and environmental progress performed by the underlying investment is a key element of practicing II.
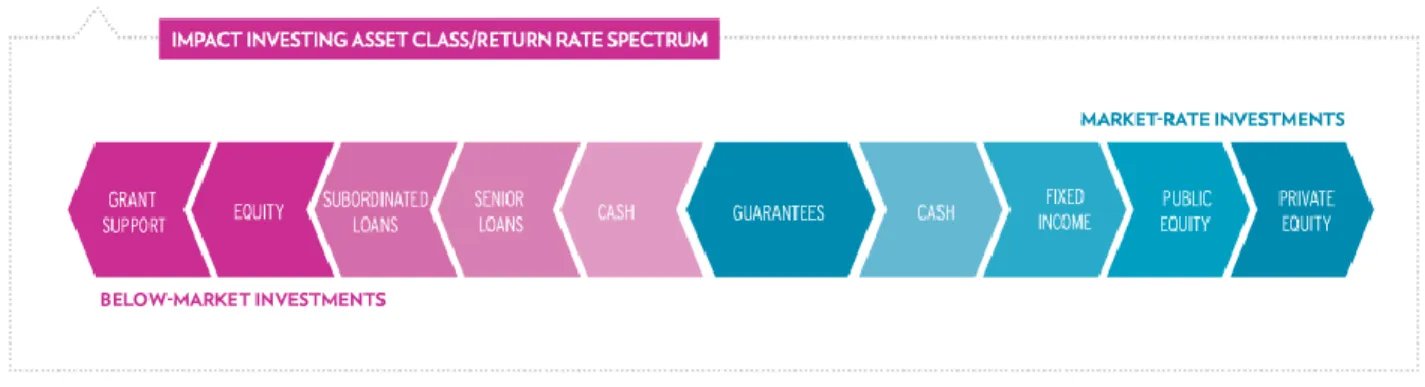
Spectrum of asset classes and return rates: II is not restricted to a specific asset class, but is spread across e.g. fixed income, VC and private equity among others. Besides it is a key characteristic of II that the range of financial returns targeted across asset classes includes both below market rate investments and market rate investments adjusted for the specific risk of the investment opportunity. This range is visualized in Figure 1.
1 „A type of financing that combines debt and equity characteristics. For example, a loan that also confers some
4
Figure 1: Impact investing asset class / return rate spectrum (GIIN.org, 2017)
To continue, Investor’s approaches to II diversify based on their objectives and capacities. There is mutual consent in the literature of the II approach being a hybrid between commercial financial investment practices and traditional philanthropy by generating effort to create social or ecological benefits alongside profit-oriented investments (Freireich & Fulton, 2009) (Mendell & Barbosa, 2013).
However, the tendency of investments towards the two components varies. On the one hand there are investment opportunities, which emphasize profitability over social impact, specified as finance
first investment (Wood, Thornley, & Grace, 2013). According to Hebb (2013) finance first
investors are not willing to trade part of the risk-adjusted market rate return for social or ecological impact. From a survey conducted by the GIIN in 2016 and responded by active impact investors follows that 59 per cent of investors are following finance first principles (Figure 2). On the contrary the generation of social and environmental impact as the leading purpose of investments is referred to as impact first investment (Bozesan, 2013). The financial aspect is of secondary interest here and serves as potential side effect such that investors are “prepared to take lower returns on their capital to achieve the social and environmental impact they seek” (Hebb, 2013). These investors accounted for 41 per cent of the market in 2016, whereas more than half of them seek returns that are closer to the market rate than to the mere return of capital (Figure 2).
5
2.2.2. Demarcation
II is rooted in the corporate social responsibility (CSR) movement in the 1980s and 1990s, at the time the theory of socially responsible investment (SRI) emerged (Bugg-Levine & Goldstein, Impact Investment: Harnessing Capital Markets to Solve Problems at Scale, 2009). Although SRI and II both share ethical values as a common motivation to apply funding and investment activities (Caplan, Griswold, & Jarvis, 2013), the concepts differ fundamentally. The purpose of SRI is to avoid negative social and ecological impact of investments, whereas II is designed to proactively affect social or environmental change (O'Donohoe, Leijonhufvud, & Saltuk, 2010).
On the contrary, investors looking into environmental, social and governance (ESG) investing integrate the respective factors into the investment decision in order to maximize the performance of the investment (Caplan, Griswold, & Jarvis, 2013). This means that investors focus on the maximization of financial returns but do not have the concrete intention to create positive socio-ecological impact. Caplan et al. (2013) explain the materiality of ESG issues to a corporation’s performance and therefore to traditional financial indicators, such that ESG is critical for any investors’ portfolio profitability and not only for SRI and II investors. Examples of ESG are energy efficiency, waste management, workplace safety and corporate governance.
To conclude, Freireich and Fulton (2009) define II as a complement to traditional philanthropy, including charitable grants and donations, by accelerating the creation of impact through profit-seeking investments.
2.2. Impact Investors
According to O’Donohoe et al. (2010) there is great diversity among investors practicing II. However the shared intention of creating impact as well as the belief of combined socio-ecological and financial achievement establishes common ground (Freireich & Fulton, 2009). The opinion on the dependency of the two variables varies among investors. Some perceive a dependency in inverse proportion, meaning that an increase in one variable leads to a decrease in the other. Others assume the parameters to be independent from each other, hence allowing a simultaneous optimization of social and financial return (Saltuk, Bouri, & Leung, 2011). Investors can therefore be classified along a continuum according to their objective to balance or trade-off financial and social returns.
6
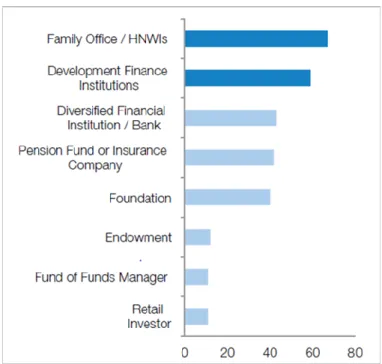
Regarding the type of investors, II has attracted both institutional and individual investors with different objectives (Figure 3). The leading owners of impact assets include family offices, high-net-worth individuals (HNWIs) and development finance institutions (DFIs). While family offices and HNWIs actively seek investment opportunities to address a range of socio-environmental challenges, DFIs focus on the support of private sector development in developing countries (Klein, Sangaré, & Semeraro, 2014). DFIs are usually majority-owned by national governments that are interested in funds that support economic development of poor areas.
Other sources of funds for II are private foundations that partner with DFIs, investment banks and other foundations to fund investments related to their social mission. Although also insurance companies and pension funds begin to identify how to deploy their substantial resources best in order to benefit the communities they serve, these investors hold only a small share of impact assets compared to their large share of the global capital pool (Figure 4).
Figure 3 additionally reveals that retail investors are among the smallest capital providers to impact investing funds. However, the focus of previous reports is primarily on institutional investors rather than on individual investors.
Figure 3: Source of funds for impact investment fund managers by survey score, 2012 (World Economic Forum, 2013)
7
2.3. Current State of the Market and Development
According to the World Economic Forum (2013) the term Impact Investing was established in 2007, such that market developments started being monitored by then. However, the approaches and results of market size estimation are various among leading institutions of II. The potential size of the sector by 2020 reaches from USD 400 billion to USD 1 trillion by J.P. Morgan and Rockefeller Foundation or USD 650 billion by the Calvert Foundation, which derived the future market size from a representative survey among investment managers (World Economic Forum, 2013). When setting these estimates into perspective, the market is expected to reach approximately 1 percent of total assets under management (AUM) when reaching USD 500 billion and AUM estimated at USD 50 trillion (Freireich & Fulton, 2009).
For an analysis of the expected growth of the II sector the current market size needs to be defined. Estimates calculated by different institutions vary from USD 25 billion in 2013 by J.P. Morgan and GIIN to USD 40 billion in 2012 by the Global Impact Investing Rating System (GIIRS) (World Economic Forum, 2013). Considering a conservative market size of USD 25 billion, the II market “will need to grow by approximately 53 percent annually to reach USD 500 billion or 69 percent annually to reach USD 1 trillion by the year 2020” (ibid). These growth rates are by far exceeding
Figure 4: Distribution of Global Asset Ownership by Investor Type, 2011 (WEF, 2013)
8
previous growth rates of related industries, as e.g. the sustainable investing market in the United States scarcely reached double-digit growth per year since 1995 (World Economic Forum, 2013). When considering more recent market size estimations of the II sector, the growth has not met the anticipations. According to the GIIN (2016) the asset volume within the sector grew from USD 25 billion in 2013 to USD 35.5 billion in 2015 (Figure 5). Therefore the realized compound annual growth rate is 18 percent, 35 percentage points below expectations.
Figure 5: Total II AUM by year (GIIN, 2016)
Furthermore when having a closer look at the allocation of II AUM across sectors, it is visible that Microfinance, Housing and Energy are among the most popular investment targets (Figure 6).
9
2.4. Impediments of Impact Investing
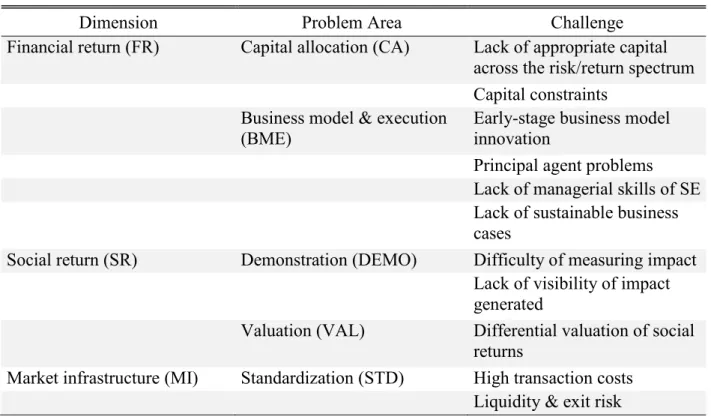
In order to review the challenges for the II sector to overcome, the main barriers identified in the literature are presented systemically along three dimensions. Glänzel and Scheuerle (2016) grouped the nature of the challenges to be related to the expected financial return of II, to the impact generated by II or to the infrastructure of the respective market. Since it is essential to the concept that financial prospects and social return go along with each other in II, especially the challenges related to the first two dimensions are interdependent (Jackson, 2013). Table 1 gives a summarized overview of the findings at the end of this sub-chapter.
Challenges related to financial returns
According to GIIN (2016) the II sector is facing a “lack of appropriate capital across the risk/return spectrum” as the main challenge to the growth of the industry. Investors do not perceive the financial return prospects as adequate given the riskiness of II as they are still strongly influenced by commercial return logics (Glänzel & Scheuerle, 2016). As a result many investment opportunities stay unfunded given that the supply of capital is limited for particular risk-return relationships (Gregory, 2016).
Compared to traditional investments the risk-return relationship for II is not in balance, as investors are exposed to a higher uncertainty to be remunerated their investment for various business model and execution risks. To start with, II enterprises often deploy innovative business models designed to serve social needs better than traditional business models. The unproven nature of early-stage enterprises however contradicts investor preferences, as a “secure income model is a key criterion for investment decision” (Glänzel & Scheuerle, 2016). Therefore the lack of track records impedes stronger investor engagement. In addition Evans (2013) points out that investors and social entrepreneurs (SE) have asymmetric information regarding the intent to fulfil both financial and social goals, therefore principal agent problems cause a higher risk for investors. The perception of investment risk furthermore varies among investors and investees, as the former weight financial risk against financial return when making an investment decision while the latter weight financial risk against social return (Glänzel & Scheuerle, 2016). The unlike level of information and sense for risk between the parties is fortified by a perceived lack of managerial skills of the SE to create a financial yield (Moore, Westley, & Nicholls, The Institutionalization of social investment: The interplay of investment logics and investor rationalities, 2012a). According to Glänzel and
10
Scheuerle (2016) business competencies are only subordinated factors in the development of social ventures while being a core competence from the investor perspective. Social impact remains the principal objective for the SE and “commercial activity value patterns are only a means to achieve it”. From this follows that a lack of sustainable business cases with long-term financial return prospects are available for investment (Moore, Westley, & Brodhead, Social finance intermediaries and social innovation, 2012b).
Challenges related to social returns
The second dimension analysed by the literature alongside the financial return dimension is the creation of social returns. The accounting of social returns is of utmost importance to II as a portion of financial returns is traded for social impact. Thus there is a broad discussion about the difficulty of measuring social returns and quantifying them in financial terms (Glänzel & Scheuerle, 2016). As social returns often need to be identified indirectly in form of cost savings within the full socio-ecological system the investment-specific “social value creation is not profoundly accounted for in investment contracts” (ibid). From this follows the risk that the impact created by the SEs’ efforts remains largely unnoticed among society and investors (Glänzel & Scheuerle, 2016) and therefore influence the willingness to trade-off social return against financial return in a negative way. Besides the evolvement of standardized measures of social or ecological impact achieved by the SE, such as IRIS2 or SROI3, the metrics are still considered either too timely or not to be helpful in
contract-designing between investors and investees (Glänzel & Scheuerle, 2016). On the contrary, the measurement often depends on the specific theory of change and is measured case by case. To continue, the lack of focus on the quantification of social returns results from a more basic challenge impeding II, namely the different stakeholder perceptions about the valuation of social returns. While SEs perceive the socio-ecological impact achieved by their efforts as a compensation for financial remuneration, potential investors are still anchored in thinking of social returns as additional benefit to their financial yield, if not taken as granted (Glänzel & Scheuerle, 2016). This leads to the “tendency to undervalue social returns created in social entrepreneurship” (ibid).
2 Impact Reporting and Investment Standards (IRIS): “IRIS is a common language for reporting the social and
environmental performance of impact investments. IRIS provides a framework and underlying set of definitions for impact-related terms, analogous to financial reporting standards” (GIIN, 2016)
3 Social Return on Investment (SROI): “A method for measuring and communicating a broad concept of value that
11
Challenges related to market infrastructure
The third dimension that was identified in the general literature that raises challenges for II to scale its importance relative to traditional investments is the still nascent infrastructure available in this market. As research on traditional VC markets reveals the high relevance of trust and personal relationships for investment decisions the lack of investment advisors, pipelines and standardized arrangements and procedures in social impact investing are constraints to its development (Glänzel & Scheuerle, 2016). This is supported by the research of GIIN (2016) resulting that a lack of common way to talk about II is one of the major reasons for investor scepticism. Hence there is consensus in the general literature that transaction costs of search, screening, structuring and monitoring investments is disproportionally high (Gregory, 2016) (Glänzel & Scheuerle, 2016). Secondly, the difficulty of exiting investments is among the top challenges selected by current II investors interviewed by the GIIN (2016). The lack of a secondary market in which II assets are traded causes that flexible liquidation of investments is not possible.
Challenges of impact investing
Dimension Problem Area Challenge Financial return (FR) Capital allocation (CA) Lack of appropriate capital
across the risk/return spectrum Capital constraints
Business model & execution (BME)
Early-stage business model innovation
Principal agent problems Lack of managerial skills of SE
Lack of sustainable business cases
Social return (SR) Demonstration (DEMO) Difficulty of measuring impact Lack of visibility of impact generated
Valuation (VAL) Differential valuation of social returns
Market infrastructure (MI) Standardization (STD) High transaction costs Liquidity & exit risk
12
2.5. Summary and hypotheses
Emerging from the CSR and SRI movement starting in the 20th century, II was expected to abolish
the polarity of financial and social returns further while becoming a USD 1 trillion industry by 2020. In order to pursue the generation of measurable social return alongside financial return financially sustainable investment opportunities for any asset class are required, besides the investor’s intention for impact creation. The prevalent academic research on II indicates that these conditions are currently not met and identifies numerous challenges the market faces. An overview of the impediments of II in the general literature can be seen in Table 1, classified along three dimensions: financial return, social return and market infrastructure. In order for II to realize industry expectations in the future small individual investors are required to drive demand from the bottom up. Therefore an empirical study is conducted in chapter 3. Methodology to identify the major challenges of future retail investors to invest in II in order to assert for which reasons II could remain a niche market in the future.
As a result of the literature review of impediments on II no particular hypotheses for testing have been developed. Given the nascent nature of previous research conducted this dissertation does not serve the purpose of exploring causal relationships between specific impediments and potentially related independent variables. The focus is set to identify the most critical from the catalogue of challenges for a previously unsought target group, namely retail investors.
3. Methodology
In order to analyse the main challenges that II faces in order to develop from a niche market to a mass market a quantitative study was conducted. The quantitative survey is based on previous qualitative early-stage research of Glänzel and Scheuerle (2016) and is an effective strategy to build on previous findings. In the following subchapters the components of the empirical study will be outlined.
3.1. Sample Respondents
To explore which are the major challenges of II to ascend from a niche market in the future, it is important to gather the impediments that potentially keep future individual investors from
13
allocating their capital to impact assets. Thus it is crucial to define the target group of future individual investors, also known as retail investors.
As this study focuses on the development of the II market in the near future given the assumptions made, the age group of respondents was set from 18 to 34. Assuming that the average investor age is above 35 years old given the simultaneous increase of age and disposable income, the respondents of the survey will on average serve as an approximation for the next generation of investors. Secondly, an essential criterion for investment to happen is disposable income. As future disposable income is difficult to forecast, this study uses education as an indicator. Assuming that the likelihood of disposable income for investment increases with an academic degree, university students serve as the target group of this survey. The third characteristic of a retail investor that needs to be accounted for is individuality. This means that he buys and sells assets for his own personal account and not for a company or organization. Hence a retail investor does not need to have an academic or professional background in finance and from this follows that the field of study does not serve as a limitation in collecting responses to the study.
As a further definition of the group of respondents nationality serves as an indicator. As this study focuses on Germany and Portugal respondents from other nations were excluded from the sample. 140 questionnaires were completed. Thereof 34 questionnaires were excluded from the sample given the defined age group (2), other nationalities than German or Portuguese (4), other professions than being a student (32) or a mixture. Thus, 106 questionnaires were used for this study. Appendix 1 gives an overview of the composition of the sample.
Sampling Procedure
In order to collect responses to the study, the questionnaire was shared via a social media channel, namely Facebook, and direct mailing. On Facebook the study was shared in closed groups of international university students of HSBA Hamburg School of Business Administration and CATOLÍCA-Lisbon School of Business and Economics, which are based in Germany and Portugal respectively. Additionally, the survey was shared among the network of mostly German individuals meeting the criteria of the sample, thus it was possible to obtain responses from students apart from the field of business and economics. As of January 2017 59% of Facebook users are aged from 18 to 34 (Statista, 2017), hence this procedure ensures to obtain the opinion of the targeted age group.
14
The respondents completed an online questionnaire with the survey application Qualtrics. Afterwards the answers have been transferred to Excel, which was used to analyse the results of the empirical study.
3.2. Questionnaire
Development and Structure of the Questionnaire
The questionnaire used for this study was specifically developed for the purpose of this dissertation. Given the nascent stage of empirical research in the field the questionnaire is based on the early-stage qualitative research of Glänzel and Scheuerle (2016) who were able to confirm “most of the barriers mentioned in the general literature on impact investing” by a series of semi-structured interviews. Besides questions on the respondents’ previous experience on impact and traditional investment it thus contains questions that are meant to analyse in how far the specific impediments identified in chapter 2.4. are observable among potential future individual investors.
Build upon Glänzel and Scheuerle (2016) the main part of the questionnaire concerning the impediments of II is organized along three problem dimensions: Challenges regarding the financial return dimension, the social return dimension as well as the dimension of market infrastructure. Table 1 gives an overview of the impediments accounted for in this survey. The dimensions of financial and social return are further sub-grouped to gain a better understanding of the nature of the restraint of investors. The impediments for II arising from the market infrastructure have been adapted from the literature and reduced to general infrastructure risks that are not specific to market boundaries, as the research of Glänzel and Scheuerle (2016) focuses on the German market exclusively.
Moreover a question regarding the consideration of different sectors for II was integrated before the last section of the questionnaire comprises socio-demographic characteristics relevant to evaluate respondent’s target group fit.
All in all, each respondent answered between 74 and 75 questions, varying due to the adaption of the questionnaire according to respondents’ answers.
Since the questionnaire was distributed to respondents internationally, namely to Germans and Portuguese, it was composed in English. Given the target group characteristic of striving for an academic degree it was assumed that respondents are proficient in English.
15
Pre-test of the Questionnaire
Before the questionnaire was spread for the purpose of collecting responses a pre-test was conducted. During the test phase seven students that rank among the targeted group of respondents answered the questionnaire paying special attention to the clear formulation of questions and understanding with regards to content. The participants of the pre-test were chosen to spread across academic fields in order to ensure the efficiency of the questionnaire across the sample. The average age of the test sample is 25.43 years while five of the participants are German and two are Portuguese. Subsequently, the feedback and ideas for improvement resulting from the test were incorporated in the questionnaire before an academic expert recommended further changes. Appendix 3 gives an extensive overview of the test sample.
3.3. Measurements and descriptive statistics Introduction
For the purpose of gaining a deeper insight to respondents’ pre-knowledge of II as well as their previous experience in general investments dummy variables are used that either take the value 0 or 1. If the respondents’ answer to a dichotomous item is positive, the variable adapts the value 0, whereas a negative answer is coded as 1. From this follows that the introducing set of questions are measured on a nominal scale. Table 2 shows the distribution of previous experience among participants. Table 3 outlines the frequencies of respondents being familiar to the different terms currently used in the field of II (Freireich & Fulton, 2009).
Distribution
N Yes (%) No (%)
Have you ever heard about II before? 106 59.4 40.6 Have you ever invested your own money before? 106 40.6 59.4 Have you ever invested somebody else's money before? 106 3.8 96.2 Have you ever invested in II or similar before? 106 0.9 99.1
16
Distribution
Have your ever heard of the following terms before? N Yes (%) No (%) Socially responsible investing 106 83.0 17.0 Sustainable investing 106 84.0 16.0 Social investing 106 74.5 25.5 Blende value 106 6.6 93.4 Mission-related investing 106 21.7 78.3 Value-based investing 106 38.7 61.3 Ethical Investing 106 72.6 27.4 Triple Bottom Line 106 20.8 79.2
Table 3: Distribution familiarity with terms used in II
Impediments of II
Each individual impediment of II is directly measured by one or multiple items of the questionnaire. The items were measured on a 7-point Likert scale to ensure sufficient variation in the respondents’ answers (Mooi & Sarstedt, 2011). Moreover this scaling method has the advantage of variables being treated as metrically scaled howbeit they are ordinally scaled (ibid). The direction of measurement is the following: The lower the score of a variable, the higher the relevance of the impediment for II. A score below 4.00 indicates a tendency for an impediment whereas a score above 4.00 indicates the opposite.
To study how future retail investors perceive the impediments of II 24 questions included in the survey were directed to this research question. Appendix 4 exhibits a tabular overview of all items measuring the impediments and whether an impediment is accounted for by a single item or by multiple items. In case of single item impediments the mean of respondents’ scores serves as measurement, while in case of multi-item impediments the average score was calculated by adding the single scores of each item and dividing through the overall number of items directed to measure the relevant impediment. Thereafter the mean values of the individual impediments were firstly aggregated to the sub-groups and subsequently to the three dimensions of challenges following the same procedure. Table 4 exhibits the descriptive statistics of the sub-groups of the three dimension of challenges.
17
Descriptive Statistics
Dimension Sub-group N Minimum Maximum Mean Std. Deviation FR CA 106 1.00 7.00 4.00 1.7027 FR BME 106 1.33 6.67 4.11 1.5312 SR DEMO 106 1.00 7.00 3.08 1.2725 SR VAL 106 1.00 7.00 3.75 1.6960 MI STD 106 1.00 7.00 4.30 1.6277
Table 4: Descriptive statistics sub-groups
Sector Preferences
Supplementary the consideration of different sectors for II was measured on a 7-point Likert scale in order to ensure enough variation in scores between different sectors. A dichotomous measurement, meaning either considering investment in a specific sector or not, might have led to less differentiable results. Table 5 shows the descriptive statistics on sector preferences.
Descriptive Statistics
Sector N Minimum Maximum Mean Std. Deviation Sustainable Agriculture 106 2.00 7.00 5.36 1.1313 Renewable Energy 106 2.00 7.00 5.66 1.0945 Housing, Health Care and Education 106 2.00 7.00 5.68 1.1002 Microfinance 106 1.00 7.00 4.03 1.6003 Ecological Conservation 106 2.00 7.00 4.22 1.4929
Table 5: Descriptive statistics sector preferences
Socio-demographics
Age is used as a categorical variable with different intervals of ages. This system is reasonable for the analysis of future investor preferences since members of a birth cohort share opinions and experiences (Glenn, 2005). Thus, the variable for age is ordinally scaled. All respondents who do not match the categories 18-24 years or 25-34 years were excluded from the sample, given the mismatch with the target group. Table 6 gives further details on the distribution of age within the target group.
18 Frequencies Age Frequency % 18 - 24 79 74.5 25 - 34 27 25.5 Total 106 100.0
Table 6: Frequencies age groups
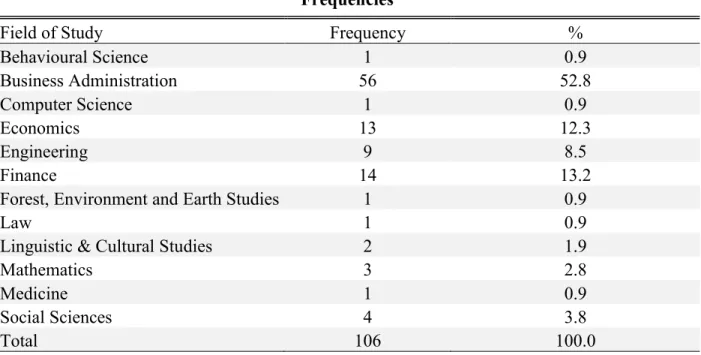
In order to assess the participants target group fit, a categorical variable for the respondents’ profession was used. All respondents who chose a category different from “Student” were excluded from the sample. Table 7 shows the distribution of the fields of studies of the respondents matching the target group.
Frequencies
Field of Study Frequency % Behavioural Science 1 0.9 Business Administration 56 52.8 Computer Science 1 0.9 Economics 13 12.3 Engineering 9 8.5 Finance 14 13.2
Forest, Environment and Earth Studies 1 0.9
Law 1 0.9
Linguistic & Cultural Studies 2 1.9
Mathematics 3 2.8
Medicine 1 0.9
Social Sciences 4 3.8
Total 106 100.0
Table 7: Frequencies field of study
Moreover, nationality is a variable that was measured during the study on a nominal scale. Besides “Portuguese” and “German” the respondents had the opportunity to opt for “Others” and were hence excluded from the sample. Therefore within the sample the nationality can only adapt two values, 0 or 1 for German or Portuguese nationality respectively. In table 8 the distribution of nationalities of survey participants is described further.
19 Frequencies Nationality Frequency % German 71 67.0 Portuguese 35 33.0 Total 106 100.0
Table 8: Frequencies nationality
4. Results
4.1. General Results Introduction
The descriptive statistics show that roughly 60 per cent of respondents are familiar with the term of II. However only one participant states to have previously invested in II, which is in line with the findings of WEF (2013) that retail investors hold the smallest share of II AUM. This result cannot be seen as representative for retail investments given that the respondents are considered to become investors only in the future. But taking into account that 41 per cent of respondents state to have invested their own money before, it is a reflectance of the market. The perception of the impediments based on whether the respondents have invested their own money before or not is further analyzed in chapter 4.2. Effect of investment experience on impediment perception. Furthermore it is worth mentioning, that the terms of SRI, sustainable investing and ethical investing are more established among the sample than II, whereas blended value, mission-related investing and triple bottom line are by far the ones with least familiarity.
Impediments of II
Regarding the main research question the descriptive statistics indicate that the challenges related to the social return outweigh the impediments regarding the financial return and market infrastructure dimension.
The challenge of demonstrating the socio-ecological impact achieved has the lowest average score (M = 3.08), meaning that it is considered the highest impediment to invest for impact by the survey respondents. Furthermore the different valuations of social return among investors and investees
20
have a score below the sub-groups of other dimensions (M = 3.75).
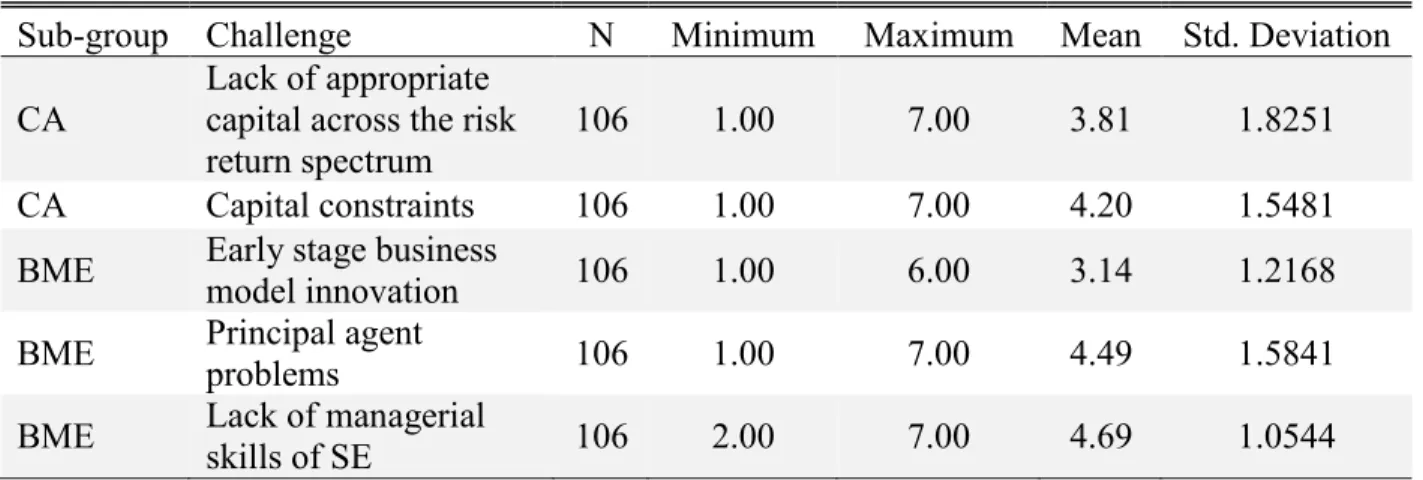
Moreover, the results of the survey regarding challenges related to the financial return of an investment for impact oppose the findings of the general literature. Contrary to expectations the challenges are not perceived as impediments for investment when considering the aggregated results. Both sub-groups of challenges related to capital allocation and business model execution have mean scores that indicate neutrality (M = 4.00 and M = 4.11). However, the disaggregated statistics for the single challenges exhibit that the inadequate financial return prospects given the risk of II as well as the innovative nature of social enterprises are constraints to investors (Table 9). Anyhow, the latter challenge is offset by other challenges related to the business model and execution risk identified in the literature, which are not perceived as such by the survey respondents. It is worth mentioning that contrary to expectations, the participants of the study do not suspect different objectives between investors and investees. Besides, SEs are not perceived to have a lack of managerial skills to create also a financial return besides social impact. Therefore, principal agent problems as well as the potential lack of managerial skills of the SE have mean scores that indicate no impediment for II (M = 4.49 and M = 4.69).
Descriptive Statistics
Sub-group Challenge N Minimum Maximum Mean Std. Deviation CA Lack of appropriate capital across the risk
return spectrum
106 1.00 7.00 3.81 1.8251 CA Capital constraints 106 1.00 7.00 4.20 1.5481 BME Early stage business model innovation 106 1.00 6.00 3.14 1.2168 BME Principal agent
problems 106 1.00 7.00 4.49 1.5841 BME Lack of managerial skills of SE 106 2.00 7.00 4.69 1.0544
Table 9: Descriptive statistics challenges related to financial returns
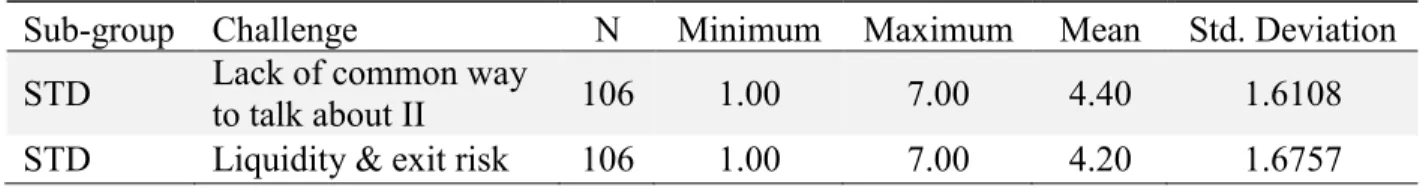
The statistics of the challenges related to the market infrastructure of II behave similarly to those of the financial return dimension. Contrary to the findings in the literature the sample of future retail investors does not perceive the lack of standardization in the market as impediment to invest for impact, as both challenges related have mean scores above 4.00 (Table 10).
21
Descriptive Statistics
Sub-group Challenge N Minimum Maximum Mean Std. Deviation STD Lack of common way
to talk about II 106 1.00 7.00 4.40 1.6108 STD Liquidity & exit risk 106 1.00 7.00 4.20 1.6757
Table 10: Descriptive statistics challenges related to market infrastructure
Sector Preferences
The descriptive statistics for the sector preferences (Table 5) exhibit that housing, healthcare and education (M = 5.68) are the top priorities to survey respondents for investment, closely followed by renewable energies (M = 5.66) and sustainable agriculture (M = 5.36). It is noticeable that the scores for an investment in microfinance (M = 4.03) and ecological conservation (M = 4.22) are significantly lower than for other sectors. Therefore the preferences of the sample used as a proxy for future retail investors differ from the current market status since the largest share of capital in II is allocated to microfinance, as outlined in chapter 2.3. Current State of the Market and
Development.
4.2. Effect of investment experience on impediment perception
To get a deeper understanding of the challenges that II is facing from the point of view of future retail investors, it is crucial to differentiate the survey respondents by their experience in the investment sphere. It is assumed that respondents who have previously invested their own money at the financial markets are more sensible towards the shortfalls of the II market. Survey respondents that have no previous experience in investing their own capital are only hypothetically exposed to the uncertainties of investment and therefore their risk return profile might be biased. Thus the responses obtained that are related to the impediments of II will be distinguished by the variable investment experience, defined by the following item: Have you ever invested your own
money before? 40.6 percent of participants answered this item positively, as exhibited in Table 2.
The item included in the survey for the purpose of exploring how many respondents have ever invested somebody else’s money is not used to further analyze the results. Since only 3.8 percent of the sample answered this question with “Yes” further examination would not yield significant results.
22
The descriptive statistics indicate that respondents who have previously invested their money are generally perceiving the impediments of II related to the financial return stronger than unexperienced respondents. The opposite holds for impediments related to the market infrastructure, whereas no clear indication is visible for challenges regarding the social return of II. Table 11 exhibits the full results.
Descriptive Statistics
Previous investment experience No Yes Dimension
Sub-Group Challenge N Mean N Mean FR CA Lack of appropriate capital
across the risk return spectrum
63 3.95 43 3.59 FR CA Capital constraints 63 4.25 43 4.14 FR BME Early stage business model
innovation
63 3.15 43 3.13 FR BME Principal agent problems 63 4.50 43 4.47 FR BME Lack of managerial skills of SE 63 4.52 43 4.93 SR DEMO Difficulty of measuring impact 63 3.00 43 3.21 SR VAL Differential valuation of social
returns
63 3.81 43 3.66 MI STD Lack of common way to talk
about II
63 4.33 43 4.50 MI STD Liquidity & exit risk 63 4.17 43 4.23
Table 11: Descriptive statistics by level of investment experience
As the variable investment experience separates the sample into two groups – previous experience or no previous experience – an independent sample t-test is used to compare these two groups regarding their perception of the impediments of investing for impact. The objective of the conduction is to explore whether the differences in means are statistically significant. The t-test assumes that the variances in the two groups are homogenous. This assumption is tested using an F-test two sample for variance. From this follows that the equality of variances is given for all items except the items designed to explore the difficulty of measuring impact within the social return dimension. Appendix 5 exhibits the detailed results of the F-test.
As a result it is proceeded with a two-sided sample t-test that does not assume equal variances to test whether there is a significant difference of perception within the sub-group DEMO. For all
23
other sub-groups the two-sided t-test is conducted assuming equal variances. Despite the indications of differences in means by the descriptive statistics, no significant difference in the perception of the impediments of II can be proven. Solely a difference in perception of the managerial skills of SEs is significant on a 95% level, meaning that participants who have ever invested their capital before have more trust in SEs to manage financial returns than respondents who are unexperienced in the investment sphere. The results of the t-test are depicted in Table 12.
Independent Sample T-Test for Equality of Means
Challenge df t stat critical t
(two-sided) p-value Hypothesis* Lack of appropriate capital across the
risk return spectrum 104 -1.60 1.66 0.11 Do not reject Ho Capital constraints 104 -0.52 1.66 0.61 Do not reject Ho Early stage business model innovation 104 -0.13 1.66 0.89 Do not reject Ho Principal agent problems 104 -0.12 1.66 0.90 Do not reject Ho Lack of managerial skills of SE 104 1.98* 1.66 0.05 Reject Ho Difficulty of measuring impact 92 1.49 1.66 0.14 Do not reject Ho Differential valuation of social returns 104 -0.83 1.66 0.41 Do not reject Ho Lack of common way to talk about II 104 0.92 1.66 0.36 Do not reject Ho Liquidity & exit risk 104 0.17 1.66 0.86 Do not reject Ho
* The hypothesized difference between the two means is 0 tested on a 5% confidence level.
Table 12: Independent Sample T-test for equality of means by level of investment experience
4.3. Effect of nationality on impediment perception
Moreover, the differential perception of impediments could be influenced by investors’ nationality. As this study focuses on two groups of nationalities, it is therefore helpful to distinguish the results obtained for the two groups to get a better understanding of the drivers of impediment perception. 67.0 percent of participants of the survey are German while the remaining 33.0 percent are Portuguese. The frequencies of nationality are exhibited in Table 8.
The descriptive statistics of the analysis indicate that respondents of Portuguese nationality are generally perceiving the impediments of II related to capital allocation stronger than German participants. Furthermore this holds for the differential valuation of social returns. No such strong indication to either one of the nationalities is visible for other challenges, except that there seems to be a major difference in the perception of liquidity and exit risk, being perceived as a much stronger impediment by German respondents compared to the Portuguese peer group. These
24
anticipated differences will be subject to further statistical testing. Table 13 exhibits the full descriptive statistics.
Descriptive Statistics
Nationality German Portuguese Dimension Sub-Group Challenge N Mean N Mean FR CA Lack of appropriate capital across the risk
return spectrum
71 3.95 35 3.50 FR CA Capital constraints 71 4.31 35 3.98 FR BME Early stage business model innovation 71 3.13 35 3.18 FR BME Principal agent problems 71 4.54 35 4.39 FR BME Lack of managerial skills of SE 71 4.68 35 4.71 SR DEMO Difficulty of measuring impact 71 3.06 35 3.14 SR VAL Differential valuation of social returns 71 3.89 35 3.47 MI STD Lack of common way to talk about II 71 4.38 35 4.44 MI STD Liquidity & exit risk 71 3.80 35 5.00
Table 13: Descriptive statistics by nationality
As the variable nationality also separates the sample into two groups – German and Portuguese – an independent sample t-test is used to compare these two groups regarding their perception of the impediments of investing for impact. The objective of the analysis is to explore whether the differences in means are statistically significant. The t-test assumes that the variances in the two groups are homogenous. This assumption is tested using an F-test two sample for variance. From this follows that the equality of variances is not given for challenges related to the sub-groups CA, BME and DEMO. Appendix 6 exhibits the detailed results of the F-test.
Thus, for reasons of simplicity it is proceeded with a two-sided sample t-test that does not assume equal variances beforehand for all challenges. Differences in perception of impediments are found to exist for several challenges on a 95% significance level. Firstly, the lack of appropriate capital across the risk return spectrum is perceived as a stronger impediment by Portuguese citizens than by Germans. This means that Portuguese perceive the financial return prospects of II not adequate given its riskiness. Secondly, the same relation holds for the impediment that valuation of social returns varies among investors and investees. Lastly, the perception of the liquidity and exit risk in II among different nationalities, namely German and Portuguese, is found to be significantly different on a 99% level (two-sided t-crit.: 2.65). In detail, Germans evaluate the lack of a secondary market which provides the option to liquidate II investments at any given time as more
25
critical than Portuguese. The results of the t-test are depicted in Table 14.
Independent Sample T-Test for Equality of Means
Challenge df t stat critical t
(two-sided) p-value Hypothesis* Lack of appropriate capital across the
risk return spectrum
95 2.18 1.99 0.03 Reject Ho Capital constraints 94 1.73 1.99 0.09 Do not reject Ho Early stage business model innovation 89 -0.36 1.99 0.72 Do not reject Ho Principal agent problems 78 0.72 1.99 0.47 Do not reject Ho Lack of managerial skills of SE 72 -0.18 1.99 0.86 Do not reject Ho Difficulty of measuring impact 94 -0.66 1.99 0.51 Do not reject Ho Differential valuation of social returns 79 2.39 1.99 0.02 Reject Ho Lack of common way to talk about II 75 -0.28 1.99 0.78 Do not reject Ho Liquidity & exit risk 66 -3.63 1.99 0.00 Reject Ho
* The hypothesized difference between the two means is 0 tested on a 5% confidence level.
Table 14: Independent Sample T-Test for Equality of Means by nationality
5. Discussion
The main finding of this study is that there are differences in the perception among the categorized impediments of II. To be more precise: Challenges that are related to the demonstration and valuation of the social or ecological return of II present a bigger impediment to future retail investors to invest for impact than other challenges.
This is opposing the previous research on institutional impact investors conducted by the GIIN (2016) that lists challenges related to the financial return dimension or shortfalls in the market infrastructure among the top three impediments. On the contrary, the respondents of this study rank only one challenge related to financial return among the top three, whereas the others are related to social returns. Given the difference in the two samples, from this follows that future individual investors have a different set of priorities compared to actual impact investors from the GIIN’s annual survey, which represented by fund managers governing their clients’ capital. Hence, in order to ascend from a niche market and appeal retail investors in the future, it is critical to focus on resolving the challenges related to the impact measurement and valuation of II. The financial return is considered to be of secondary interest.
Starting with the first, the measurement and demonstration of social returns, the II market is in a state of discrepancy. As outlined in the literature the measurement of social impact generated by a
26
social enterprise is highly dependent on the specific business model (Glänzel & Scheuerle, 2016). However, standardized approaches to performance measurement of non-financial results provide the transparency and support to investors “to understand their risks and opportunities comprehensively, including factors associated with intangible and reputational value”, as stated by Bloomberg (2017). Thus in order to gain efficiencies in the II market and counteract the reservation of retail investors due to a lack of accountability of social returns, the development of further standardized metrics is required.
To conclude, a major challenge of II is the balance of standardization and individualization when measuring the non-financial returns generated. As the established metrics are considered to be too timely or costly by current investors as well as SEs (Glänzel & Scheuerle, 2016), new ways of providing figures that are comprehensive across business models but also require only moderate effort to generate are needed.
Since the results of the study do not only indicate a higher need for demonstration of social returns but also a lack of trust in the business model innovation and execution of the social sector, a standardized score also taking into account the financial dimension besides the social dimension could possibly increase investor confidence.
Secondly, and in line with previous research conducted the study reveals that the different valuation of social returns among investors and investees is among the strongest impediments for investors to consider in II. This challenge is proof of the ongoing barrier created by institutional logics4. The
proxy for future retail investors is concerned about the SE following social sector logics whereas they themselves are still partly following commercial return logics. From this follows that II has not overcome the challenges of combining social sector characteristics with commercial finance logics yet (Glänzel & Scheuerle, 2016). However, according to the study the financial return dimension seems to lose its unmated importance to investors in the future. Setting this into perspective shows that future retail investors are not focused on the financial return in II anymore but still trust the characteristics of commercial finance logics. Hence, these characteristics need to be transferred to the social perspective of II, resulting for example in the development of measurement and accountability of social returns in financial terms, as stated above.
Surprisingly there is evidence in the study that investors do not doubt the capability of the SE to act according to commercial return logics, which deviates from previous findings in the literature.
4 „[…]the belief systems and associated practices that predominate in an organizational field[…]“ (Scott, Ruef,
27
Nonetheless it supports the conclusion that there is generally enough trust in social sector capabilities if sufficiently paired with commercial return metrics.
To conclude, the previous literature concentrates on current investors which are impeded mostly by challenges related to financial return. On the contrary the focus of this study is on future retail investors, which are mostly challenging the social return dimension. Thus one can conclude a shift of mind-set regarding the profitability of social enterprises as well as objectives of investment towards social impact.
This is supported by the results of studying the effect of the level of investment experience on impediment perception. Although the risk profile of individuals should alter with previous experience in the investment sphere, no significant difference in perception of impediments among the experienced and the unexperienced respondents could be found. Therefore one can assume that the supposed shift in mind does not only build on the fact that students are only hypothetically exposed to the risks of investment and are therefore biased, but rather can be considered as a veritable development.
An additional result of the study conducted is that impediment perception shows variation across national boundaries. In this study Germany and Portugal were analysed and show significant differences in the perception of several risks related to II. Possible reasons for these differences are cultural disparities, investment habits but also the stage of development of the II market among others. The higher impediment of Portuguese students compared to German students to invest in II given that the return prospects are not adequately offsetting its risk is supported by a higher level of uncertainty avoidance within the Portuguese culture (Hofstede, 2017). Moreover, it was found that Germans are stronger restrained by the missing opportunity to exit the investment than Portuguese. This effect could among others be explained by the German II market to still be in its infancy (Glänzel & Scheuerle, 2016), whereas the interest in the social investment market is already at a growth stage in Portugal (Portuguese Social Investment Taskforce, 2014). This is due to the increase of popularity of II leading to the investments within the market gaining liquidity.
Overall, this finding is in line with the II market being considered to be of domestic nature given the high level of involvement of national governments as investors (Social Impact Investment Taskforce, 2014).
28
6. Limitations and Future Research
The findings of this dissertation are subject to several limitations, especially of methodological nature. To start with, the sample is adequate to give an indication with regards to the major challenges of II, but is not representative to prove theoretical norms. Firstly, the sample size is rather narrow and focused on Germany and Portugal. Secondly the properties of the sample restrict theoretical implications for II, since the participants of the survey are only a proxy for the group of interest with several assumptions outlined in Chapter 3.1.: Sample. As the results of this study are based on these assumptions, for instance that impediments related to social return will be the major challenge to overcome in II, they are preliminary and require further examination. Especially further approximation of the selected sample to the target group increases the reliability of results. The field of study of the sample has a high focus on business, which therefore decreases representativeness.
Moreover, the study does not verify that the barriers identified as critical to overcome arise in II solely. For instance, the challenges related to the sub-group BME are also relevant impediments in the regular investment sphere. Therefore it cannot be identified to what extent this impediment is specifically restraining social investments. Supplementary research might focus on the differences of the impediment in social investments compared to regular investments.
Furthermore, as the study builds on the impediments of II found in the general literature, it does not take into account other criteria of the investment decision of investors. The interdependence of decision factors related to II and other criteria, for instance level of income, gender or sentiments, are interesting subjects for further research.
Lastly and related to the previous limitation, the characteristics of the defined group of interest itself complicate the generalization of results. As retail investors are characterized by their individuality, their investment decision is driven by very diverse motives and strategies. Therefore in order to overcome the challenges of II further research needs to be conducted for understanding more about retail investors’ perspectives.
7. Conclusion
The objective of this dissertation was to evaluate which impediments could restrain the II market from ascending from a niche market to a mass market in the near future. With such purpose in mind the research question was defined as: What are the major challenges that impede future retail
29
investors from considering an investment for impact?
Hence the general literature on II was reviewed, identifying challenges of the II market within three dimensions: financial return, social return and market infrastructure. Thereafter a quantitative study with German and Portuguese students as a proxy for future retail investors was conducted, examining their perception of the impediments defined in previous research.
The results of the study show an indication for a shift in mind-set regarding financial profitability of social enterprises as well as objectives of investment towards social impact. This perception is not dependent on whether sample respondents have had previous investment experience or not, thus supporting the confidence of the generalization of conclusions. However, future retail investors still follow the logics of commercial finance in terms of measurement. Especially the demonstration and valuation of social returns are subject to a lack of standardization and therefore trust of investors. Moreover the perception of challenges of II was found to vary across national boundaries, being dependent on cultural differences as well as the specific market development stage.
All in all, this study provides valuable insights for both practitioners as well as researchers. Nevertheless, caution is warranted in generalizing these findings especially due to the fact that the study was conducted with a sample that serves only as a proxy for the target group subject to the analysis.
VI