1
Choosing the best direction of printing for additive
manufacturing process in medical applications using a new
geometric complexity model based on part CAD data
Sabrine Ben Amor1, Salah Abdellaoui2, Antoine Tahan3, Borhen Louhichi1, João Manuel RS Tavares4 1 Laboratoire de Mécanique de Sousse, Ecole Nationale d’Ingénieurs de Sousse, Université de Sousse, Tunisie ;
2 Institut supérieur des sciences appliquées et de technologie de Sousse, Université de Sousse, Tunisie ; 3 École de Technologie Supérieure, Montréal, QC, Canada ;
4 Faculdade de Engenharia da Universidade do Porto (FEUP), Portugal ;
[email protected], [email protected], [email protected] [email protected]
Abstract
Additive manufacturing processes is now experiencing significant growth and is at the origin of intense research activity (optimization of topology, biomedical applications, etc.). One of the characteristics of this method is that the geometric complexity is free. The complexity of a CAD model is also a field of research. The basic idea is that the complexity of a component has implications in design and especially in manufacturing. Indeed, industrial competitiveness in the mechanical field generated the need to produce increasingly complex systems and parts (in terms of geometry, topology...). Part deposition orientation is also very important factor of additive manufacturing as it effects build time, support structure, dimensional accuracy, surface finish and cost of the part. A number of layered manufacturing process specific parameters and constraints have to be considered while deciding the part deposition orientation. Determination of an optimal part deposition orientation is a difficult and time consuming task as one has to trade-off among various contradicting objectives like part surface finish and build time. This paper describes and compares various attempts made to determine part deposition orientation of orthoses using geometric complexity model and part CAD information.
Keywords:
3D Printing, orthoses, Computer-Aided Design, Deposition orientation, complexity metrics.1.
Introduction, background and motivations
Additive Manufacturing (AM) is defined as the process of adding materials to fabricate parts from 3D model data, usually layer-by-layer [1]. Contrary to material-removal manufacturing methods, such as traditional machining, AM can produce very high complexity parts for different types of materials (plastic, metal, ceramic, etc.) and without the loss of material. The techniques and methods of AM are developing, on the one hand, in terms of applications and, on the other hand, in terms of areas of use (automotive, medical, aeronautics ...). The AM is growing strongly for the next few years. The most used materials in AM are plastics. While in recent years, there is a significant trend towards metallic materials.
The part orientation problem can be defined as changing the orientation of the part to maximize or minimize one or more manufacturing considerations. This can be done on either the STL file or on the CAD model itself [2]. Depending on the application or purpose of the part, certain features may be more important than others. This makes the orientation of the part a design challenge as much as an optimization challenge [3]. Orientation can affect build time, quality of the part, and mechanical properties of anisotropic parts. Depending on the process, there may even be manufacturing constrains that must be considered such as supports or deposition properties [4].
The determination of the optimal part orientation is essential for all AM processes. However, the way in which a part's orientation affects the manufactured part is process dependent. Different factors that can be considered while choosing the build direction for AM [2].
2 Figure 1 shows how different orientations affect support material. The amount of part area touching the base of the build platform can also affect the quality of the part surface, so should be minimized [2].
Many different methods have been used to find an optimal part orientation in the literature.
Frank and Fadel [6] suggested that many factors get affected by the part deposition orientation. Some of these factors are surface quality, build time, amount of support structures, shrinkage, curling, distortion, roundness/flatness, resin flow, material cost and trapped volume etc. Frank and Fadel [6] considered the first three factors namely surface quality, build time and amount of support structures to obtain a better part deposition orientation.
Cheng et al. [7] presented an approach for determining suitable part deposition orientation for SL parts considering dimensional accuracy as well as build time as objectives. Part accuracy was treated as primary objective and was estimated using the different weight factors for different types of surface geometries.
Lan et al. [8] determined part deposition orientation for parts based on the considerations of surface quality, build time or complexity of the support structures. Surface quality was evaluated either by maximizing the area of stepped surfaces or by minimizing the area of worst quality surfaces. The maximization of area of non-stepped surfaces was achieved by selecting a part deposition orientation that maximizes the total area of perpendicular and horizontal faces, which do not offer stair stepping.
Alexander et al. [9] determined suitable part deposition orientation for better part accuracy and lower cost. McClurkin and Rosen [10] developed statistical models to predict build time, accuracy and surface finish of SL parts using response surface methodology.
In sum, Different published works for part deposition orientation determination are presented. Most of the researchers have considered part accuracy, build time, support structure and cost as a criterion to determine part deposition orientation.
In recent years, 3D printing technology was introduced to the medical field, specifically for medical orthoses production. The goal was to bring new revolutionary medical devices to the market. As known, the traditional orthoses fabrication processes have always been labeled slow, expensive, skill depending and time-consuming, which generally results in a poor orthoses quality.
In this paper, we propose to choose the best direction of printing medical orthoses using the complexity metric model (𝐶), the cost and the mass of material of the part.
Finally, this paper is structured as follows: Section 2 presents the complexity metric model. Section 3 then proceeds to describe the methodology used to choose the best direction of 3D printing and case studies.
2. Complexity Model Presentation
In order to develop our product complexity metric model (𝐶), we have inspired from the principle of AM. He treats the part layer by layer as build. This model is calculated after a slicing of the part following the direction of printing. It is composed of five parameters (Eq. (1)).
C = ∑5j=1Cj Eq. (1)
The first metric 𝐶1 represent the mean of 𝐶1𝑖, 𝑛 represent the total number of layers in part after slicing. The coefficient 𝐶1𝑖 is designed to describe the complexity of the part between two consecutive layers along the z-axis: 𝐶1= 1 𝑛−1∑ 𝐶1𝑖 𝑛 𝑖=2 Eq. (2)
𝐶1𝑖 is calculated using the difference between tow surfaces.
𝐶1𝑖= ln(|𝑆𝑛𝑒𝑡− 𝑆𝑛𝑒𝑡−1| + 1) Eq. (3)
Where 𝑆𝑛𝑒𝑡 represent the net area of a given section and 𝑆𝑛𝑒𝑡−1 the area of the previous section. The second metric 𝐶2 represent the mean of 𝐶2𝑖.
𝐶2= 1
𝑛−1∑ 𝐶2𝑖 𝑛
𝑖=2 Eq. (4)
The coefficient 𝐶2𝑖 is designed to describe the complexity of the part between two consecutive layers along the z-axis. It consists in studying the difference between their centers of gravities. (𝑋𝑔,𝑌𝑔) are the center of gravity coordinates of a given section and (𝑋𝑔−1,𝑌𝑔−1) are the center of gravity coordinates of the previous one.
𝐶2𝑖= 25𝑙𝑛√(𝑋𝑔− 𝑋𝑔−1) 2
+ (𝑌𝑔− 𝑌𝑔−1) 2
+ 1 Eq.(5) The metric 𝐶3 represents the mean of 𝐶3𝑖:
3 𝐶3= 1 𝑛∑ 𝐶3𝑖 𝑛 𝑖=1 Eq. (6)
The coefficient 𝐶3𝑖 is designed to describe the amount of cavities in the part. It consists of dividing 𝑆𝑚𝑎𝑥 by 𝑆𝑛𝑒𝑡.Where 𝑆𝑚𝑎𝑥 is the area of a section including the cavities and 𝑆𝑛𝑒𝑡 is the net area of a given section. This coefficient 𝐶3𝑖 is similar to the method of [11] who described the complexity in extrusion in the same way.
𝐶3𝑖= 𝑆𝑚𝑎𝑥
𝑆𝑛𝑒𝑡 Eq. (7)
The fourth metric 𝐶4 represent the arithmetic mean of 𝐶4𝑖 : 𝐶4=
1
𝑛∑ 𝐶4𝑖 𝑛
𝑖=1 Eq. (8)
The complexity factor 𝐶4𝑖 is inspired by the work of Joshi and Ravi [9], who described the complexity as being on the surface of the piece with respect to the surface of a sphere of the same volume. Indeed, in our case 𝐶4𝑖 describes the two-dimensional complexity. Therefore, we did the projection of the work. This projection gave the perimeter instead of surface (𝑃𝑡𝑜𝑡[mm]) and the net surface (𝑆𝑛𝑒𝑡) of a given layer [mm²] at a given height.
𝐶4𝑖= 𝑃𝑡𝑜𝑡
2√𝜋𝑆𝑛𝑒𝑡 Eq. (9)
The fifth metric 𝐶5 represent the arithmetic mean of 𝐶5i : 𝐶5=1
𝑛∑ 𝐶5𝑖 𝑛
𝑖=1 Eq. (10)
The coefficient 𝐶5𝑖 consists in studying the sum of the numbers of the independent surfaces and the cavities in a given section.
𝐶5𝑖= ln(𝑁𝑝+ 𝑁ℎ) Eq. (11)
Where 𝑁𝑝 and 𝑁ℎ are respectively the number of independent surfaces and cavities in a given section.
3. Case Studies
In order to choose the best direction of 3D printing for medical orthoses, we start by calculating the complexity metric model using the methodology described in (Figure 2) then we move to ideamaker ® to calculate the cost and the mass of the material of the part.
Figure 2: the methodology to calculate the complexity metric
Five medical orthoses were treated (table 1) in this part in different direction of slicing to choose the best orientation deposition of each part.
Table 1 : The studied parts
4 Part 2
Part 3
Part 4
Part 5
3.1 The result of Part 1
Part 1 is a Foot Orthosis (Figure 3) manufactured by 3DP, three directions are treated and a choice of the better direction for 3D printing has been done.
Figure 3: Part 1 in three direction
3.1.1 Result in the first direction:
In this part we will see the general parameters and the metric coefficients in the first direction. In this direction, after slicing, we had 901 layers.
5
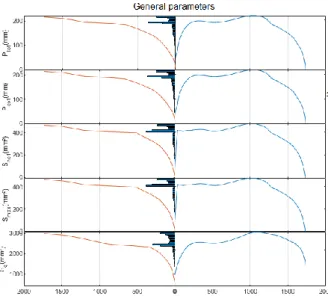
Figure 4: the General parameters of part 1 in the first direction
Figure 4 represents the different general parameters of part 1 in the first direction. The right part of the figure shows its parameters according to the number of the layer. The section on the left illustrates the frequency of these parameters with the cumulative curve.
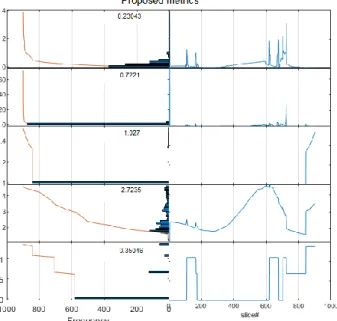
Figure 5: the proposed metrics of part 1 in the first direction
Figure 5 shows the different candidate metrics for part 1 in the first direction. The right part of the figure shows its metrics based on the number of the layer. The left side shows the frequency of these parameters with the cumulative curve.
3.1.2
Result in the second direction:
In this part we will see the general parameters and the metric coefficients in the second direction. In this direction, after slicing, we had 487 layers.
6
Figure 6: The General parameters of part 1 in the second direction
Figure 7 represents the different general parameters of part 1 in the second direction. The right part of the figure shows its parameters according to the number of the layer. The section on the left illustrates the frequency of these parameters with the cumulative curve
Figure 7: the proposed metrics of part 1 in the second direction
Figure 8 shows the different candidate metrics for part 1 in the second direction. The right part of the figure shows its metrics based on the number of the layer. The left side shows the frequency of these parameters with the cumulative curve.
3.1.3 Result in the third direction:
In this part we will see the general parameters and the metric coefficients in the third direction. In this direction, after slicing, we had 1732 layers.
7
Figure 8:The General parameters of part 1 in the third direction
Figure 9 represents the different general parameters of part 1 in the third direction. The right part of the figure shows its parameters according to the number of the layer. The section on the left illustrates the frequency of these parameters with the cumulative curve.
Figure 9:the proposed metrics of part 1 in the third direction
Figure 10 shows the different candidate metrics for part 1 in the third direction. The right part of the figure shows its metrics based on the number of the layer. The left side shows the frequency of these parameters with the cumulative curve.
Table 2:The results of part 1
𝐶
1𝐶
2𝐶
3𝐶
4𝐶
5𝐶
Cost ($) Mass of Material (g) Direction 1 0.230 0.722 1.027 2.723 0.350 5.05 0.2 6.7 Direction 2 0.894 12.652 1,050 3.590 0.545 18.7 0.16 5.2 Direction 3 0.184 0.590 1 2.498 0 4.2 0.16 5.2Table 2 shows the average values of these metrics in the three directions. These values reflect that the direction 3 is the best in the direction of surface variation.
This method was used to get an idea about the geometry of the part and to geometrically comparison in different directions. But you have to consider the amount of fastening material and the cost to choose the best print direction. For this part, we can choose the third direction to print the part. This direction has the lowest geometric complexity, the lowest cost and the lowest mass of material.
8
3.2 The result of Part 2
Part 2 is a Foot Orthosis (Figure 11) manufactured by 3DP, Three directions are treated and a choice of the better direction for 3D printing has been done.
Figure 10: Part 2 in three direction
Table 3:The results of part 2
C1 C2 C3 C4 C5 C Cost ($) Mass of Material (g) Direction 1 0.468 1.434 1.002 2.707 0.870 6.48 0.95 31.7 Direction 2 0.771 3.752 1,012 3.461 1.263 10.2 0.97 32.5 Direction 3 1.173 8.008 1.002 3.293 1.119 14.5 1.03 34.4
Table 3 shows the average values of the complexity metrics, the cost and mass of material in the three directions. For this part, we can choose the first direction to print the part. This direction has the lowest geometric complexity, the lowest cost and the lowest mass of material.
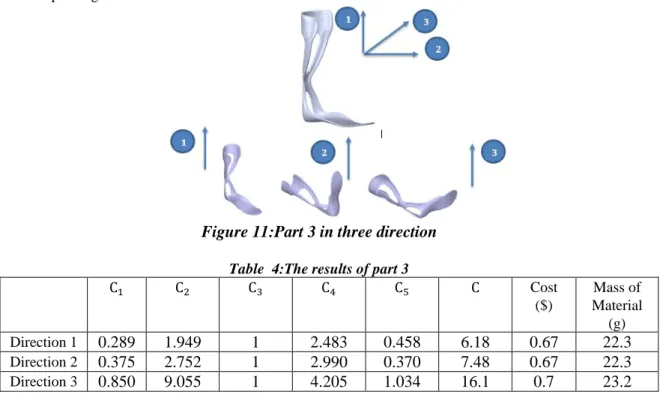
3.3 The result of Part 3:
Part 3 (Figure 12) manufactured by 3DP, Three directions are treated and a choice of the better direction for 3D printing has been done.
Figure 11:Part 3 in three direction
Table 4:The results of part 3
C1 C2 C3 C4 C5 C Cost ($) Mass of Material (g) Direction 1
0.289
1.949
1
2.483
0.458
6.18
0.67
22.3
Direction 20.375
2.752
1
2.990
0.370
7.48
0.67
22.3
Direction 30.850
9.055
1
4.205
1.034
16.1
0.7
23.2
Table 4 shows the average values of the complexity metrics, the cost and the mass of material in the three directions. For this part, we can choose the first direction to print the part. This direction has the lowest geometric complexity, the lowest cost and the lowest mass of material.
9
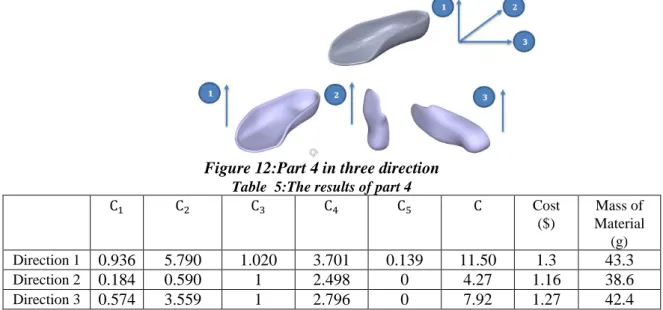
3.4 The result of Part 4:
Part 4 (Figure 13) manufactured by 3DP, Three directions are treated and a choice of the better direction for 3D printing has been done
.
Figure 12:Part 4 in three direction
Table 5:The results of part 4
C1 C2 C3 C4 C5 C Cost ($) Mass of Material (g) Direction 1
0.936
5.790
1.020
3.701
0.139
11.50
1.3
43.3
Direction 20.184
0.590
1
2.498
0
4.27
1.16
38.6
Direction 30.574
3.559
1
2.796
0
7.92
1.27
42.4
Table 5 shows the average values of the complexity metrics, the cost and the mass of material in the three directions. For this part, we can choose the second direction to print the part. This direction has the lowest geometric complexity, the lowest cost and the lowest mass of material.
3.5 The result of Part 5:
Part 5 (Figure 14) manufactured by 3DP, Three directions are treated and a choice of the better direction for 3D printing has been done.
Figure 13:Part 5 in two direction
Table 6:The results of part 5
C1 C2 C3 C4 C5 C Cost ($) Mass of Material (g) Direction 1
0,465
1,683
1
6,135
0,672
9,95
0,47
15,8
Direction 20,717
4,790
1,043
5,610
1,2
13,3
0,49
16,2
Table 6 shows the average values of the complexity metrics, the cost and the mass of material in the three directions. For this part, we can choose the first direction to print the part. This direction has the lowest geometric complexity, the lowest cost and the lowest mass of material.
10
4. Conclusion
Additive manufacturing process has shown great manufacturing performance in the medical applications. They are able to produce very high complexity parts. The part orientation problem can be defined as changing the orientation of the part to maximize or minimize one or more manufacturing considerations. This work was done to choose the best direction of printing medical othoses using the geometric complexity model in AM, the cost and the mass of material.
5. References
[1] Obaton, A. F., Bernard, A., Taillandier, G., & Moschetta, J. M. (2015). Fabrication additive: état de l'art et besoins métrologiques engendrés Additive manufacturing: state of the art and generated metrological needs. Revue française de métrologie, 37, 133.
[2] Kulkarni, P., Marsan, A., & Dutta, D. (2000). A review of process planning techniques in layered manufacturing.Rapid prototyping journal, 6(1),18-35.
[3] Gibson, I., Rosen, D. W., & Stucker, B. (2010). Design for additive manufacturing. In Additive Manufacturing Technologies(pp. 299-332). Springer, Boston, MA.
[4] Pandey, P. M., Reddy, N. V., & Dhande, S. G. (2007). Part deposition orientation studies in layered manufacturing. Journal of materials processing technology, 185(1-3), 125-131.
[5] Oropallo, W., & Piegl, L. A. (2016). Ten challenges in 3D printing. Engineering with Computers, 32(1), 135-148.
[6]Frank, D., & Fadel, G. (1995). Expert system-based selection of the preferred direction of build for rapid prototyping processes. Journal of Intelligent Manufacturing, 6(5), 339-345.
[7] Cheng, W., Fuh, J. Y. H., Nee, A. Y. C., Wong, Y. S., Loh, H. T., & Miyazawa, T. (1995). Multi-objective optimization of part-building orientation in stereolithography. Rapid Prototyping Journal, 1(4), 12-23.
[8] Lan, P. T., Chou, S. Y., Chen, L. L., & Gemmill, D. (1997). Determining fabrication orientations for rapid prototyping with stereolithography apparatus. Computer-Aided Design, 29(1), 53-62.
[9] Alexander, P., Allen, S., & Dutta, D. (1998). Part orientation and build cost determination in layered manufacturing. Computer-Aided Design, 30(5), 343-356.
[10] McClurkin, J. E., & Rosen, D. W. (1998). Computer-aided build style decision support for stereolithography. Rapid Prototyping Journal, 4(1), 4-13.
[11] Qamar, S. Z., Arif, A. F. M., & Sheikh, A. K. (2004). A new definition of shape complexity for metal extrusion. Journal of Materials Processing Technology, 155, 1734-1739.
[12] Joshi, D., & Ravi, B. (2010). Quantifying the shape complexity of cast parts. Computer-Aided Design and Applications, 7(5), 685-700.
![Figure 1: Original model and different orientations requiring different support structures [5]](https://thumb-eu.123doks.com/thumbv2/123dok_br/15156221.1013345/1.892.286.624.1030.1095/figure-original-different-orientations-requiring-different-support-structures.webp)