Comparative biochemical profile of protein-rich
products obtained from industrial rapeseed meal
Petya Ivanova1, Hristo Kalaydzhiev1, Turid Rustad2, Cristina L. M. Silva3, Vesela I. Chalova1*1Department of Biochemistry and Molecular Biology, University of Food Technologies, 26 Maritsa Blvd, Plovdiv 4002, Bulgaria, 2Department
of Biotechnology, Norwegian University of Science and Technology, 7491 Trondheim, Norway, 3CBQF - Center of Biotechnology and Fine
Chemistry - Associated Laboratory, Superior School of Biotechnology, Portuguese Catholic University / Porto, Rua Arquiteto Lobão Vital, Apartado 2511, 4202-401 Porto, Portugal
INTRODUCTION
Rapeseed is a major oil-bearing crop. It is mainly used for preparation of vegetable oil, which, depending on the quality, is economically valuable for food or biofuel production (Carré and Pouzet, 2014). The oil extraction leads to generation of solid residues known as rapeseed meal which can amount to 48% of the total quantity of rapeseeds used (Ivanova, 2012). Due to high protein content (38 to 45%), rapeseed meal is used as a protein-rich additive in the feed industry (Newkirk, 2009). However, its application as a feed ingredient is limited by high fiber content and anti-nutritional compounds which have negative effect on animal metabolism and growth performance (Khajali and Slominski, 2012; Mejicanos et al., 2016). As a result, a substantial amount of rapeseed meal remains unutilized thus becoming a waste product (Campbell et al., 2016).
The application of industrial rapeseed meal for preparation of protein-rich products could lead to a better and more complete use of this agricultural by-product. Rapeseed meal has the potential to serve as an alternative plant protein source for human consumption because of its high biological value (Campbell et al., 1981), relatively well-balanced amino acid composition (Sosulski, 1983; Pastuszewska et al., 2000) and good functional properties (Aluko and McIntosh, 2001; Yoshie-Stark et al., 2008). The use of rapeseed protein or their derivatives for non-food and non-feed purposes as antiamnestic, antihypertensive, antithrombotic, antioxidative, antifungal and antiviral agents has also been documented (Wanasundara et al., 2016). Major challenges in preparation of rapeseed meal-derived protein products and their subsequent application in food industry are related to alteration of protein characteristics due to process parameters related to oil extraction and rapeseed pre-treatment. This is especially valid for
Protein-rich products, prepared from industrial rapeseed meal, have the potential for versatile applications in the food, feed, and nutraceutical industries. The aim of study was to characterize the biochemical composition of two protein-rich products obtained from industrially produced rapeseed meal. Protein isolate (PI) and acid soluble protein (ASP) were prepared by alkaline extraction (pH 12.0) followed by isoelectric precipitation (pH 4.5). Biochemical analyses revealed that PI contained a high protein amount (86.9%), while ASP had 28.8% protein and a relatively high level of non- protein compounds including ash (20.6%) and fiber (30.0%). Results showed that neither protein products contained glucosinolates. They were rich in microelements; the most abundant were Cu (64.3 mg kg-1) and Fe (133 mg
kg-1) in PI and Mn (39.7 mg kg-1) and Zn (84.2 mg kg-1) in ASP. PI and ASP were also a good source of Se (1.1 mg kg-1 and 0.9 mg kg-1,
respectively). Lysine was the most abundant essential amino acid in PI with amino acid score of 100.7% followed by leucine (98.3%) and valine (95.8%). Both protein products were mainly composed of low molecular weight fractions (5 to 33 kDa), but in different ratio. The PI contained two fractions with molecular weights 53 and 235 kDa which were not found in ASP. In conclusion, PI and ASP exhibited different biochemical characteristics which make them suitable for different applications.
Keywords: Acid soluble protein; Industrial rapeseed meal; Protein isolate
A B S T R A C T
http://www.ejfa.me/
R E G U L A R A R T I C L E
*Corresponding author:
Vesela I. Chalova, University of Food Technologies Department of Biochemistry and Molecular Biology 26 Maritsa Blvd.Plovdiv 4002 Bulgaria, Tel: 0395 32 603 855, E-mail: veselachalova@gmail.com
industrially obtained rapeseed meal which is produced after thermal treatment with a high heat load. This is probably the reason for the limited numbers of published reports on protein preparations from industrially produced rapeseed meal. The most typical procedure used for preparation of protein isolates is based on alkaline extraction followed by isoelectric precipitation at acidic pH (Tan et al., 2011). However, little attention is paid to acid soluble protein which remains in the solution after acidic precipitation. According to Lqari et al. (2002), the acid soluble protein may reach up to 20% of the alkaline-extracted protein. Wong et al. (2013) reported that acid soluble protein, recovered after isoelectric precipitation (pH 4.5) of alkaline- extracted protein (pH 8.5) from lupine kernels, yielded 16.2 ± 0.4% of the protein contained in kernels. The acid soluble protein exhibited foaming properties superior to that of the alkaline protein isolate and similar to foaming properties of fresh egg white. From industrially defatted rapeseed meal, a yield of 10% soluble protein was obtained (Chabanon et al., 2007). To the best of our knowledge, no published studies on detailed characterization of acid soluble proteins derived from rapeseed meal are available. The purpose of this study was to characterize the biochemical composition of two protein-rich products obtained from industrially produced rapeseed meal after isoelectric precipitation.
MATERIAL AND METHODS
Material
Rapeseed meal was provided by a local company. It was produced after thermal treatment of rapeseeds at 110 – 115 ºС followed by extraction with hexane at 60 – 65ºС for approximately 1 h. The industrially produced rapeseed meal was grinded and sifted to collect 0.315 mm particles which were used for analysis. To reduce phenol and glucosinolate contents, the rapeseed meal was subjected to a 4-step treatment with 75% aqueous ethanol solution at a meal to solvent ratio of 25% (w/v), for 30 min at room temperature (Chabanon et al., 2007). The residue was collected by decanting, dried in air and stored in a closed container. All reagents used were of analytical grade. A written informed consent for the implementation of herein described research activities has been taken from the participants of the study.
Preparation of rapeseed meal protein-rich products
Two protein-rich products, namely protein isolate (PI) and acid soluble protein (ASP), were prepared by using the ethanol pre-treated industrial rapeseed meal as a protein source. The PI was produced by alkaline extraction (pH 12.0) of 7.5% meal suspension at 40°C for 75 min. Extracted proteins were precipitated with HCl at pH 4.5 which corresponded to the lowest protein solubility. The
resulting sediment was collected by centrifugation at 1800xg for 15 min (MPW-251, Med. Instruments, Poland). It was washed 3 times with acidic distilled water (pH 4.5) with a volume 6 times the volume of the wet precipitate and lyophilized (Lyovac GT2, Leybold-Heraeus, Germany). The supernatant and all washing liquids were combined and also lyophilized to prepare ASP.
Chemical analysis
Total nitrogen was determined by Kjeldahl’s method and multiplied by 6.25 to convert to crude protein (AOAC, 1990). Ash content was determined by ICC Standard №104/1. The amount of total lipids was evaluated as described by Bligh and Dyer (1959) with slight modifications. Total fibers were determined as described by Southgate (1991). Total phenols were extracted with 70% aqueous ethanol solution as describe by Petkova et al. (2014) and quantified by using Folin-Ciocalteu reagent (Ainsworth and Gillespie, 2007). Total glucosinolates were evaluated as described by Jezek et al. (1999). The method is based on spectrophotometric evaluation of glucosinolates after alkaline hydrolysis and reduction with potassium ferricyanide. Sinigrin was used for standard curve generation. Selenium (Se) was determined by using inductively coupled plasma optical emission spectrometry (ICP-OES) (ISO 11885:2007). For all other microelements and heavy metals, Bulgarian National Standard procedure, BDS 11374, was used.
Sodium dodecyl sulfate-polyacrylamide gel electrophoresis (SDS-PAGE)
SDS-PAGE was performed with an omniPAGE mini Cleaver electrophoresis (Model CVS10DSYS, Cleaver Scientific Ltd, United Kingdom) as described by Laemmli (1970). The gel system consisted of a 15% polyacrylamide resolving gel (pH 8.8). Protein samples were loaded at two concentrations, namely 2.7 mg mL-1 and 4.05 mg mL-1, to provide better
visibility. Visualization of gels was realized with 0.2% Coomassie Brilliant Blue R-250 dye (Serva Electrophoresis GmbH, Germany) for 20 min and discolored by immerging in a solution containing 10% ethanol and 7% CH3COOH for overnight. Data were analyzed by using TotalLab1D Analysis software (BioStep GmbH, Germany).
Total amino acid analysis and amino acid score calculation
The amino acid composition was determined by high-pressure liquid chromatography (HPLC). Lyophilized samples were prepared by hydrolysis in 6M HCl at 105°C for 22 h (Blackburn, 1968) followed by neutralization and filtration of hydrolysates. Reverse phase HPLC by precolumn fluorescence derivatisation with o-phthaldialdehyde (SIL-9A Auto Injector, LC-9A Liquid Chromatograph, RF-530 Fluorescence HPLC Monitor, Shimadzu Corporation, Japan) was performed
with a NovaPak C18 cartridge column, using the method of Lindroth and Mopper (1979) as modified by Flynn (1988). Amino acid score (AAS) was calculated as a ratio of the amount of each essential amino acid in a sample (g/100g protein) and the amount of the respective amino acid in an “ideal” protein (g/100g protein) as stated by the Food and Agriculture Organization of the United Nations (FAO, 1970). The result was expressed in percent.
Statistical analysis
Results are presented as means of at least three independent determinations ± standard deviation (SD). Statistical evaluation was performed by using one-way analysis of variance (ANOVA) of the IBM SPSS Statistics program (Somers, NY, USA). Mean differences were established by Fisher’s least significant difference test for paired comparison with a significance level α = 0.05.
RESULTS AND DISCUSSION
Chemical composition of ethanol-treated rapeseed meal
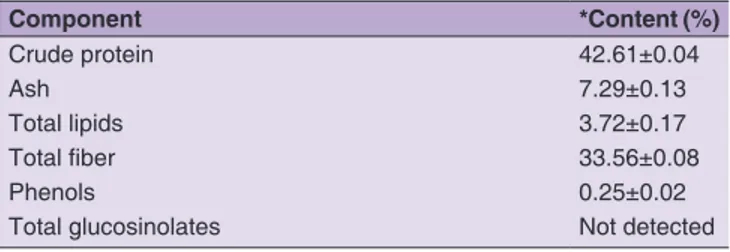
The ethanol-treated rapeseed meal contained relatively high amount of protein (42.61 ± 0.04%) which is a necessary prerequisite for the preparation of protein-rich products (Table 1). Total fiber content remained at the level of 33.56 ± 0.08% (Table 1). Although fiber content of the meal could be reduced by rapeseeds dehulling, this approach is not practiced industrially due to possible oil loss (Khajali and Slominski, 2012) and potential increase of primary product cost (Shires et al., 1983).
Antinutritional compounds in rapeseed meal are a major factor which limits its application as a protein source in food and feed industries (Tan et al., 2011). According to Wanasundara (2011), the fiber fraction and alcohol soluble components (sugars, glucosinolates and some phenolics) may account for a significant amount of rapeseed derived protein products. The content of total phenols in the rapeseed meal used (1.13 ± 0.04%), previously established by Ivanova et al. (2016), was 4-fold reduced to 0.25 ± 0.02% (Table 1) by a simple 4-step ethanol treatment of the raw material. While in low quantities phenols are considered beneficial because of their antioxidant capacity, in higher amounts they reduce nutritional and functional properties of proteins (Aider and Barbana, 2011). In addition, rapeseed phenols are contributing to the bitter taste, astringency and dark color of the rapeseed meal thus influencing overall quality of corresponding protein products (Zum Felde et al., 2007).
Glucosinolates were below the detection limit of the analytical method used (Table 1). This is probably a
consequence of the ethanol pre-treatment as well as the initial relatively low glucosinolate level in the industrial rapeseed meal used in the study (12.69 µmol g-1), as
previously evaluated by Ivanova et al. (2016). Since this industrial rapeseed meal is composed of mixed cultivars, it is difficult to relate the low glucosinolate concentration to a specific variety. Most probably, this is due to heat treatment of the rapeseeds during the oil production process (Bell and Keith, 1991; Mansour et al., 1993). Slawski et al. (2012) and Adem et al. (2014), who explored the suitability of rapeseed meal as a protein source in aquaculture, also used ethanol pre-treatment of rapeseed meal as an approach for reduction of antinutrients.
Chemical composition of protein-rich products
As expected, PI, which was obtained by isoelectric precipitation of alkali extracted proteins, contained a high amount of crude protein (86.86 ± 0.02) and a relatively low amount of non-protein compounds (Table 2). Rapeseed derived protein rich products can be prepared by various approaches including the protein micellation method (Ismond and Welsh, 1992), membrane separation technology (Ghodsvali et al., 2005), direct alkaline extraction (Tan et al., 2011) as well as other methods. The direct alkaline extraction is one of the most typical procedures for preparation of canola (rapeseed varieties) protein isolates with high protein yield (Tan et al., 2011). Protein content of alkaline extracted precipitates may vary from 70% to 90% (Aluko and McIntosh, 2001; Ghodsvali et al., 2005), although protein isolates with a protein content higher than 90% have also been reported
Table 1: Chemical composition of ethanol‑treated industrial rapeseed meal Component *Content (%) Crude protein 42.61±0.04 Ash 7.29±0.13 Total lipids 3.72±0.17 Total fiber 33.56±0.08 Phenols 0.25±0.02
Total glucosinolates Not detected
*Calculated on a dry matter basis (90.28% ± 0.02)
Table 2: Chemical compositions of protein isolate (PI) and acid soluble protein (ASP)
Component Content (%) PI* ASP* Crude protein 86.86±0.02a 28.84±0.03b Ash 2.35±0.32b 20.55±0.66a Total lipids 2.13±0.17a 1.16±0.06b Total fiber 4.64±0.40b 30.01±0.14a Phenols 0.26±0.00b 2.15±0.01a
Total glucosinolates Not detected Not detected
*Contents are calculated on a dry matter basis, 97.84% ± 0.06 for PI and 94.75% ± 0.04 for ASP. a,bMeans in a row with different superscripts differ
(Pedroche et al., 2004). The ash (2.35 ± 0.32%, Table 2) and total lipid contents (2.13 ± 0.17%, Table 2) were in the range of maximum allowed concentrations, below 4% and 2%, respectively (EFSA, 2013). The PI had a relatively low total level of phenols (0.26 ± 0.00%, Table 2) which could still interact with proteins in a food system if used as a food or feed ingredient. Phenolic compounds react with proteins by various mechanisms and form stable protein/ phenolic complexes which may reduce nutritional and organoleptic properties of final food products (Aider and Barbana, 2011). Regardless of undesired color and reduced amino acid availability, plant polyphenols are powerful antioxidants with potential benefits for human health. Pandey and Rizvi (2009) suggested that consumption of diets rich in plant polyphenols may decrease the risk of cancers, cardiovascular diseases, diabetes, osteoporosis and neurodegenerative diseases.
Although solubilization of proteins in alkaline media followed by isoelectric precipitation is considered a successful approach for fiber separation, our PI contained relatively high fiber level (4.64 ± 0.40%, Table 2). In contrast, Pedroche et al. (2004) prepared a protein isolate from Brassica carinata by alkaline extraction (pH 12) which
contained 0.23% fiber. High fiber content in protein isolates is not desired since it may negatively influence protein digestibility (Bell, 1993). However, it has been demonstrated that dietary fiber reduced cholesterol levels and incidences of colon cancer in human (Anderson, 1985; Reddy et al., 1987). The ASP, prepared in our study, contained 7-times more total fiber than PI (30.01 ± 0.14%, Table 2). By using two rapeseed cultivars, Yoshie-Stark et al. (2006) purposefully obtained protein concentrates with enhanced fiber contents that varied from 26.2% to 30.6%. Sensory analysis of sausages prepared with the same protein concentrates as substitutes for casein demonstrated superiority of taste, texture and aroma. Compared to PI, ASP was a better source of Mn and Zn containing approximately 10- and 2.5-fold higher amounts of these elements, respectively (Table 3). Although fiber is often
implied to negatively affect zinc bioavailability, more precise studies involving reduction of concomitant antinutrient factors (Barbro et al., 1985) as well as experiments on pure fiber components such as α-cellulose (Turnlund et al., 1984) suggested little or no inhibitory effect of fiber on zinc absorption. However, further investigation should be performed to evaluate the influence of the high fiber content in ASP on manganese bioavailability (Freeland-Graves et al., 2015). If needed, a decrease in fiber content could be achieved by enzymatic or chemical decomposition. By using Viscozyme® L, a combination
of arabinase, cellulase, β-glucanase, hemicellulase and xylanase, Rodrigues et al. (2014) significantly decreased the content of non-digestible carbohydrates in rapeseed meal. The enzymatic treatment led to enhancement of protein content from 41 to 68% and to an 80%-yield of reducing sugars expressed as glucose equivalents. Carbohydrases secreted by white rot fungi were applied for canola plant biomass biodegradation (Isikhuemhen et al., 2014). Luj´an-Rhenals et al. (2015) used sulfuric acid in various concentrations to degrade carbohydrates in soybean meal. The procedure resulted in fermentable sugars which were further used as a carbon source by Saccharomyces cerevisiae
and Zymomonas mobilis to produce ethanol.
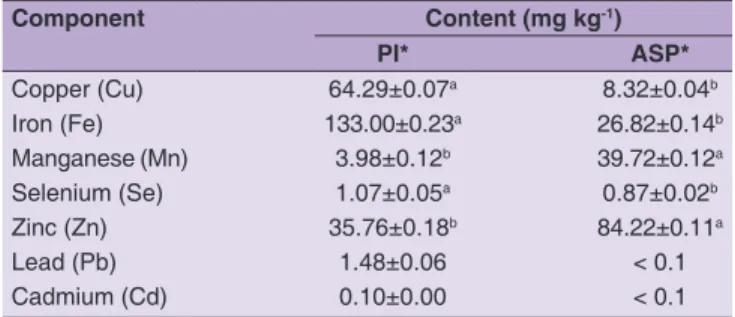
Ash content in food- and feed ingredients as well as in processed food is highly variable. For example, ash content in white sugar should not exceed 0.1%, while the limit range for the same parameter in instant and decaffeinated coffee is set at 6 to 15% (FDA, 2013). Since no purification step was involved, the ASP contained high ash content (20.55 ± 0.66%, Table 2). By using a chick growth assay, Johnson and Parsons (1997) established that ash content in meat and bone meal (24%), poultry by-product (16%) and lamb meal (24%) did not significantly alter protein efficiency ratio and net protein ratio values for these inclusions in poultry diets. Decreases of ash content of ASP, if needed, could potentially be achieved by means of ultrafiltration and diafiltration. The combination of both techniques is widely used in small- and large-scale industrial processes for purification of specific biomolecules including plant proteins (Zwijnenberg et al., 2002; Aspelund and Glatz, 2010). However, the volume and the grade of diluents as well as degree of purification could significantly impact the overall operating cost and consequently the financial profit of the final product (Paulen et al., 2013). Therefore, application of ultrafiltration/diafiltration as well as the choice of diluent scheme should be considered after careful economic analysis. In addition, this type of protein purification would result in a product with enhanced protein level but low level of minerals which are necessary for the optimal development and metabolic functioning of humans. Copper, Fe, Zn and Se are essential trace Table 3: Contents of selected microelements and heavy
metals of protein isolate (PI) and acid soluble protein (ASP)
Component Content (mg kg‑1) PI* ASP* Copper (Cu) 64.29±0.07a 8.32±0.04b Iron (Fe) 133.00±0.23a 26.82±0.14b Manganese (Mn) 3.98±0.12b 39.72±0.12a Selenium (Se) 1.07±0.05a 0.87±0.02b Zinc (Zn) 35.76±0.18b 84.22±0.11a Lead (Pb) 1.48±0.06 < 0.1 Cadmium (Cd) 0.10±0.00 < 0.1
*Contents are calculated on a dry matter basis, 97.84% ± 0.06 for PI and 94.75% ± 0.04 for ASP. a,bMeans in a row with different superscripts differ
elements where sub-optimal level may provoke numerous diseases of public health importance (Aliasgharpour and Farzami, 2013). Manganese serves as an activator and a constituent of several enzymes in human organism (WHO, 1996). Both protein-rich products, obtained in our study, were rich in microelements with the main elements being Cu (64.29 mg kg-1) and Fe (133 mg kg-1) in PI and Mn
(39.72 mg kg-1) and Zn (84.22 mg kg-1) in ASP (Table 3).
The contents of the studied elements in the one or both protein-rich products exceeded the respective values established for protein isolates prepared from soybean (García et al., 1998) and Parkia biglobosa seeds (Ogunyinka
et al., 2017). Most probably, the extent of the interaction of microelements with proteins as well as the stability of the respective complexes under the conditions of the isoelectric precipitation contributed to the different contents observed in PI and ASP.
Both PI and ASP were rich in Se as PI contained significantly higher amount of Se (p < 0.05) than ASP (Table 3). Selenium is needed for proper function of glutathione peroxidases and thioredoxin reductase, involved in controlling concentrations of highly reactive oxygen-containing metabolites in tissues (Arthur et al., 1996; Howie et al., 1998). A major Se source for human is food from animal origin like beef and pork meat, fish, liver and kidney (Brown and Arthur, 2001). Plant foods are low in Se and diets, limited to plant-derived foods, may lead to a higher risk of Se deficiency. Selenium content in PI (1.07 mg kg-1,
Table 3) and ASP (0.87 mg kg-1, Table 3) exceeded several
folds the ones established in wheat (0.165 μg g-1) and barley
(0.069 μg g-1) which are considered a major plant source of
this element in human nutrition (Al-Ahmary, 2009). The Se content in rapeseed meal varies from 0.16 to 0.29 mg kg-1
and it is approximately10 times higher than that in soybean meal (Arthur, 1971; Feng and Zuo, 2003). While rapeseed meal cannot be directly consumed by humans, rapeseed meal protein-rich products may be prepared in a form suitable for enrichment of dietary Se in human nutrition. While being a good source of protein and minerals i.e., Fe, Cu, Se and Zn, PI contained high amount of Pb (1.48 mg kg-1, Table 3) which precludes its potential
application in food industry in its current form. The value is 3-fold higher than the limit set by EFSA (2013). Lead affinity towards protein complexation (Belatik et al., 2012; Jalilehvand et al., 2015) is the most probable explanation for the higher concentration of this element in PI compared to ASP. Cadmium, evaluated in both PI and ASP, was within (or below) the limit values set for most food products (EC No 466, 2001). Although not appropriate as a food additive, the PI could be valuable for food and non-feed uses. Because of the presence of multiple reactive sites and charged residues, rapeseed/canola proteins can be
converted into molecules/polymers with diverse technical properties (Wanasundara et al., 2016). It was demonstrated that rapeseed napins possessed significant antifungal activities against Fusarium langsethiae with IC50 = 70 μM (Nioi et al, 2012).
Plants from Brassica genus including B. napus are well
known for their high capacity to accumulate heavy metals available in soil (Mourato et al., 2015). Wang et al. (2005) observed accumulation of Pb in both rapeseeds and hull. Other studies have also shown that Pb levels higher than the accepted maximum permissible concentrations were established in rapeseed oil (Angelova et al., 2011) and meal (Elson et al, 1979). Accumulation of heavy metals by
Brassica plants is highly variable and is dependent on the
utilization of contaminated sewage water for irrigation and the extent of soil contamination (Kaur and Sharma, 2014). In addition, Brassica cultivars and hybrids demonstrated
high fluctuation in their capacities to uptake heavy metals (Mourato et al., 2015). Therefore, concentration of these elements in products derived from rapeseed/canola, if
present at all, is not consistent and should be evaluated prior to a food application.
Total amino acid composition and amino acid score
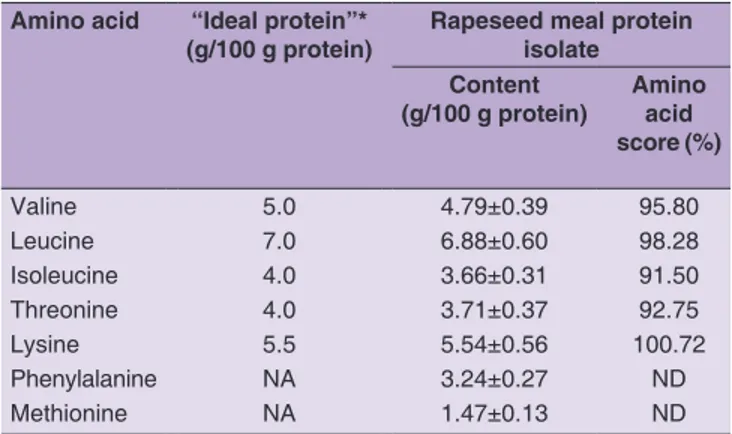
Total amino acid analysis revealed that PI contained a high amount of lysine (5. 5%, Table 4). The calculated amino acid score (AAS) for lysine (100.72%) demonstrated that the PI may almost fully satisfy the daily need of this essential amino acid as defined by FAO (1970). According to Tan et al (2011), lysine content in canola protein isolates may vary from 5.04% to 6.34% and is highly dependent on extraction method. The lysine content in PI is close to the amount found in isoelectric canola meal protein isolate (5.6%), as reported by Tzeng et al. (1988), but is higher than the values found in Brassica carinata protein
isolates (3.8%, 3.3%, and 4.5%) prepared after NaOH extraction at pH 10, 11, and 12, respectively (Pedroche
Table 4: Essential amino acid composition and amino acid score of rapeseed meal protein isolate
Amino acid “Ideal protein”*
(g/100 g protein) Rapeseed meal protein isolate Content
(g/100 g protein) Amino acid score (%) Valine 5.0 4.79±0.39 95.80 Leucine 7.0 6.88±0.60 98.28 Isoleucine 4.0 3.66±0.31 91.50 Threonine 4.0 3.71±0.37 92.75 Lysine 5.5 5.54±0.56 100.72 Phenylalanine NA 3.24±0.27 ND Methionine NA 1.47±0.13 ND
*Amino acid composition of an “ideal” protein (FAO, 1970), ND denotes Not determined
et al., 2004). Methionine in PI (1.47%) was higher than that in soy protein isolate (0.92%) and hempseed protein isolates (1.39%) estimated by Wang et al. (2008), and the methionine level (1.31%) in flaxseed whole extracts evaluated by Chung et al. (2005). The PI appeared to be a good source of leucine and isoleucine with AAS reaching 98.3% and 91.5%, respectively. Although not evaluated as a usual limiting amino acids in plant protein sources, the branched amino acids may be needed in proportionally higher amounts under specific physiological conditions such as surgery, trauma, infections and starvation and therefore, external provision of these amino acids would be necessary (Kinney and Elwyn, 1983). The ASP, obtained in our study, could not be considered a valuable source of essential amino acids (data not provided).
From non-essential amino acids, glycine/arginine amount was the highest (24.55%, Table 5). In general, arginine can be synthesized de novo by human body but external
supplementation of this amino acid may be necessary during specific diseases and trauma recovery when decrease of arginine concentration in blood plasma accompanied by a lack of compensatory mechanisms may occur (Castillo et al., 1994). Histidine and tyrosine were not detected in the PI. This may be partially due to ethanol pre-treatment of the rapeseed meal, employed in our study, which initially aimed to decrease concomitant anti-nutritional compounds. However, ethanol is a common solvent use for the extraction of prolamins which may account for 20% of canola proteins (Tan et al., 2011). Although the opposite was stated by Tan et al. (2011), probable amino acid loss may also occur because of the rapeseed processing for meal production. Tzeng et al. (1988) explained that long processing as well as alkaline conditions may negatively impact amino acid stability. Newkirk et al. (2003) reported significant decreases in histidine and proline after toasting of canola seeds. Variations in anti-nutrient concentrations, protein digestibility and amino acid composition among rapeseed meals were previously reported (Newkirk and Classen, 2002; Ayton, 2014). Genetics and growth
conditions of the rapeseeds, used for production of the meal, may also contribute to the differences in the total amino acid composition, observed between PI and the published data (Uppstrom, 1995; Tan et al., 2011).
Protein profile of PI and ASP
SDS-PAGE analysis revealed significant differences in molecular weight distribution of PI and ASP. Both protein products were mainly composed of low molecular weight fractions between 5 to 33 kDa but in different ratio (Figs. 1 and 2). This is in agreement with results for canola protein isolate (mainly 14 to 59 kDa) presented by Wu and Muir (2008). However, a band of 14 kDa, referred to by the same authors to as napin (a major rapeseed albumin), was not observed neither in PI nor ASP (Figs. 1 and 2). Instead, two bands with lower molecular weights, namely 5 and 8 kDa were found. It should be noted that the 8 kDa – protein fraction was the most abundant fraction in ASP accounting for 36.6% of total proteins and the third
Table 5: Nonessential amino acid composition of rapeseed meal protein isolate
Amino acid Rapeseed meal
protein isolate (g/100 g protein) Alanine 4.45±0.41 Tyrosine NA Glycine/arginine 25.21±2.72 Serine 4.30±0.43 Aspartic acid 5.15±0.41 Glutamine/glutamate 22.34±1.81 Asparagine 0.18±0.01 Histidine NA
NA denotes Not available
Fig 1. SDS-PAGE of protein isolate, lines 1 (2.7 mg mL-1) and
1' (4.05 mg mL-1), and acid soluble protein, lines 3 (2.7 mg mL-1) and
3' (4.05 mg mL-1). Line 2 is a molecular weight marker. *Band not
identified by software analysis.
0 5 10 15 20 25 30 35 40 5 8 18 20 21 29 33 53 235
Individual protein fraction,
%
Molecular weight, kDa PI
5 8 18 20 21 29 33 53 23
Molecular weight, kDa PI ASP
Fig 2. Comparative fractional profiles of protein isolate (PI) and acid soluble protein (ASP).
one in PI reaching 14.5%. Our results imply that possible decomposition of napin during rapeseed processing and subsequent protein products preparation may occur. After evaluating protein profile of a rapeseed protein concentrate by SDS-PAGE, Adem et al. (2014) revealed 9 to 4 kDa bands corresponding to napin polypeptide chains. Aluco and McIntosh (2001) observed only four major bands (16, 18, 30 and 53kDa) in laboratory-defatted meals prepared from canola seeds. The 18 kDa band was observed in both PI and ASP electrophoretic analysis. This low molecular weight fraction was the second most abundant one in ASP reaching 21.7% of total proteins. The 20- and 33 kDa fractions, also found in both protein products, correspond to α- and β- subunits of cruciferin as described by Höglund et al. (1992). The 53kDa fraction, also observed by Aluco and McIntosh (2001), was present only in PI but not in ASP (Fig. 2). While ASP contained only low molecular protein fractions, 12.69% of PI consisted of a 235 kDa protein fractions which is most probably cruciferin. Its molecular weight has been reported to vary between 230 and 320 kDa depending on literature. Interestingly, a minor band at around 66 kDa, which was not detected by analyzing program but was visible on Fig. 1, was also observed and reported as not defined by Adem et al. (2014) who studied SDS-PAGE protein profile of a rapeseed protein concentrate.
CONCLUSION
Industrial rapeseed meal is a by-product which is still underutilized. Preparation of protein-rich products leads to a better and more efficient utilization of industrial rapeseed meal and generate added value from it. The two protein-rich products, obtained in our study, differed considerably in biochemical characteristics which suggest versatile potential application. Values of Pb in PI above acceptable concentration limit imply a necessity of precise quantitative analyses of heavy metals in the obtained protein products prior to their utilization. Since this parameter is highly dependent on rapeseed quality, high variations of heavy metal concentrations in rapeseed-based protein products could be expected. This study demonstrated the possibility for better and more complete use of the industrial rapeseed meal by simultaneous preparation of two protein-rich products.
ACKNOWLEDGEMENTS
This study was partially supported by grant № 8/15-H, fund “Science” administered by University of Food Technologies, Plovdiv, Bulgaria. The skillful analytical work done by engineer Trude Johansen is greatly acknowledged.
Author’s contributions
P. Ivanova and H. Kalaydzhiev performed most of the experiments and data analyses. T. Rustad contributed to sample analysis, discussion and manuscript writing. Cristina L. M. Silva assisted in manuscript writing. Vesela Chalova was responsible for design of the study, data analyses and manuscript writing.
REFERENCES
Adem, H. N., R. Tressel, F. Pudel, H. Slawski and C. Schulz. 2014. Rapeseed use in aquaculture. OCL. 21: D105-D113.
Ainsworth, E. A. and K. M. Gillespie. 2007. Estimation of total phenolic content and other oxidation substrates in plant tissues using Folin-Ciocalteu reagent. Nat. Prot. 2: 875-877.
Aider, M. and C. Barbana. 2011. Canola proteins: Composition, extraction, functional properties, bioactivity, applications as a food ingredient and allergenicity – A practical and critical review. Trends Food Sci. Technol. 22: 21-39.
Al-Ahmary, K. M. 2009. Selenium content in selected foods from the Saudi Arabia market and estimation of the daily intake. Arabian J. Chem. 2: 95-99.
Aliasgharpour, M. and M. Farzami. 2013. Trace elements in human nutrition: A review. Int. J. Med. Invest. 2: 115-128.
AOAC. 1990. Official Methods of Analysis, Association of Official Analytical Chemists, Washington, DC, USA.
Aluko, R. E. and T. McIntosh. 2001. Polypeptide profile and functional properties of defatted meals and protein isolates of canola seeds. J. Sci. Food Agric. 81: 391-396.
Anderson, J. W. 1985. Physiological and metabolic effects of dietary fiber. Fed. Proc. 44: 2902-2906.
Angelova, V., R. Ivanova and K. Ivanov. 2005. Heavy metal accumulation and distribution in oil crops. Commun. Soil Sci. Plant Anal. 35: 2551-2566.
Arthur, D. 1971. Selenium content of some feed ingredients available in Canada. Can. J. Anim. Sci. 51: 71-74.
Arthur, J. R., G. Bermano, J. H. Mitchell and J. E. Hesketh. 1996. Regulation of selenoprotein gene expression and thyroid hormone metabolism. Biochem. Soc. Trans. 24: 384-388. Aspelund, M. T. and C. E. Glatz. 2010. Purification of recombinant
plant-made proteins from corn extracts by ultrafiltration. J. Membr. Sci. 353: 103-110.
Ayton, J. 2014. Variability of quality traits in canola seed, oil and meal - A review. NSW Department of Primary Industries, New South Wales, Australia.
Barbro, N., S. Brittmarie and C. Åke. 1985. Reduction of the phytate content of bran by leavening in bread and its effect on zinc absorption in man. Br. J. Nutr. 53: 47-53.
Belatik, A., S. Hotchandani, R. Carpentier and H. Tajmir-Riahi. 2012. Locating the binding sites of Pb(II) ion with human and bovine serum albumins. PLoS One. 7: e36723.
Bell, J. M. 1993. Factors affecting the nutritional value of canola meal: A review. Can. J. Anim. Sci. 73: 689-697.
Bell, J. M. and M. O. Keith. 1991. A survey of variation in the chemical composition of commercial canola meal produced in Western Canadian crushing plants. Can. J. Anim. Sci. 71: 469-480. Blackburn, S. 1968. Amino Acid Determination: Methods and
Techniques, Dekker, New York.
extraction and purification. Can. J. Biochem. Phys. 37: 911-917. BDS 11374. Available from: http://www.bds-bg.org/bg/ standard/?natstandard_document_id=5976. [Last accessed on 2015 Jan].
Brown, K. and J. Arthur. 2001. Selenium, selenoproteins and human health: A review. Public Health Nutr. 4: 593-599.
Campbell, L. D., B. O. Eggum and I. Jacobsen. 1981. Biological value, amino acid availability and true metabolizable energy of low-glucosinolate rapeseed meal (canola) determined with rats and/or roosters. Nutr. Rep. Int. 24: 791-798.
Campbell, L., C. B. Rempel and J. P. D. Wanasundara. 2016. Canola/ Rapeseed protein: Future opportunities and directions - Workshop proceedings of IRC 2015. Plants. 5: 17-23.
Carré, P. and A. Pouzet. 2014. Rapeseed market, worldwide and in Europe. OCL. 21: D102-D114.
Castillo, L., A. Ajami, S. Branch, T. E. Chapman, Y. Yu, J. F. Burke and V. R. Young. 1994. Plasma arginine kinetics in adult man: Response to an arginine-free diet. Metab. Clin. Exp. 43: 114-122. Chabanon, G., I. Chevalot, X. Framboisier, S. Chenu and I. Marc.
2007. Hydrolysis of rapeseed protein isolates: Kinetics, characterization and functional properties of hydrolysates. Process Biochem. 42: 1419-1428.
Chung, M. W. Y., B. Lei and E. C. Y. Li-Chan. 2005. Isolation and structural characterization of the major protein fraction from NorMan flaxseed (Linum usitatissimum L.). Food Chem. 90: 271-279.
EC №. 466. 2001. Setting maximum levels for certain contaminants in foodstuffs. Off. J. Eur. Commun. L77: 1-13.
EFSA (EFSA Panel on Dietetic Products, Nutrition and Allergies). 2013. Scientific Opinion on the safety of “rapeseed protein isolate” as a Novel Food ingredient. EFSA J. 11: 3420-3443. Elson, C. M., D. L. Hynes and P. A. MacNeil. 1979. Trace metal
content of rapeseed meals, oils and seeds. J. Am. Oil Chem. Soc. 56: 998-999.
FAO. 1970. Nutritional Studies № 24. Amino acid Content of Foods and Biological Data on Proteins, FAO, Rome.
FDA. 2013. Summary of Current Food Standards. Available from: http://www.fda.gov.ph/attachments/article/71149/Annex%20 J%20%20FOOD%20STANDARD.pdf. [Last accessed on 2016 Jul].
Feng, D. and J. Zuo. 2007. Nutritional and anti-nutritional composition of rapeseed meal and its utilization as a feed ingredient for animal, International Consultative Group for Research on Rapeseed, Wuhan, China, pp. 265-270.
Flynn, K. J. 1988. Some practical aspects of measurements of dissolved free amino acids in natural waters and within microalgae by the use of HPLC. Chem. Ecol. 3: 269-293. Freeland-Graves, J. H., T. Y. Mousa and N. Sanjeevi. 2015. Nutritive
requirements for manganese. In: Costa, L. G. and M. Aschner (Eds.), Manganese in Health and Disease, The Royal Society of Chemistry, Cambridge, UK, pp. 34-78.
García, M. C., M. L. Marina, F. Laborda and M. Torre. 1998. Chemical characterization of commercial soybean products. Food Chem. 62: 325-331.
Ghodsvali, A., M. H. H. Khodaparast, M. Vosoughi and L. L. Diosady. 2005. Preparation of canola protein materials using membrane technology and evaluation of meals functional properties. Food Res. Int. 38: 223-231.
Howie, A. F., J. R. Arthur, T. Nicol, S. W. Walker, S. G. Beech and G. J. Beckett. 1998. Identification of a 57-kilodalton selenoprotein in human thyrocytes as thioredoxin reductase. J.
Clin. Endocrinol. Metab. 83: 2052-2058.
Höglund, A. S., J. Rödin, E. Larsson and L. Rask. 1992. Distribution of napin and cruciferin in developing rape seed embryos. Plant Phys. 98: 509-515.
ICC Standard №104/1. Approved 1960, Revised 1990. Determination of Ash in Cereals and Cereal Products.
Ismond, M. A. H. and W. D. Welsh. 1992. Application of new methodology to canola protein isolation. Food Chem. 45: 125-127.
ISO 11885:2007. Water quality-Determination of selected elements by inductively coupled plasma optical emission spectrometry (ICP-OES). Available from: http://www.iso.org/iso/catalogue_ detail.htm?csnumber=36250. [Last accessed on 2015 Jan]. Isikhuemhen, O. S., N. A. Mikiashvili, Z. N. Senwo and E. I. Ohimain.
2014. Biodegradation and sugar release from canola plant biomass by selected white rot fungi. Adv. Biol. Chem. 4: 395-406. Ivanova, R. 2012. Rapeseed - The Culture of Present and Future,
“Videnov & Son”, Sofia, Bulgaria.
Ivanova, P., V. Chalova, G. Uzunova, L. Koleva and I. Manolov. 2016. Biochemical characterization of industrially produced rapeseed meal as a protein source in food industry. Agric. Agric. Sci. Proc. 10: 55-62.
Jalilehvand, F., N. S. Sisombath, A. C. Schell and G. A. Facey. 2015. Lead (II) complex formation with L-cysteine in aqueous solution. Inorg. Chem. 54: 2160-2170.
Jezek, J., B. G. D. Haggett, A. Atkinson and D. M. Rawson. 1999. Determination of glucosinolates using their alkaline degradation and reaction with ferricyanide. J. Agric. Food Chem. 47: 4669-4674.
Johnson, M. L. and C. M. Parsons. 1997. Effects of raw material source, ash content, and assay length on protein efficiency ratio and net protein ratio values for animal protein meals. Poult. Sci. 76: 1722-1727.
Kaur, V. and G. Sharma. 2014. Effects of industrial effluent on soil characteristics: A review. Int. J. Adv. Eng. Sci. Technol. 3: 201-207.
Khajali, F. and B. A. Slominski. 2012. Factors that affect the nutritive value of canola meal for poultry. Poult. Sci. 91: 2564-2575. Kinney, J. M. and D. H. Elwyn. 1983. Protein metabolism and injury.
Annu. Rev. Nutr. 3: 433-466.
Laemmli, U. K. 1970. Cleavage of structural proteins during the assembly of the head of bacteriophage T4. Nature. 227: 680-685.
Lindroth, P. and K. Mopper. 1979. High performance liquid chromatographic determination of subpicomole amounts of amino acids by precolumn fluorescence derivatization with o-phthaldialdehyde. Anal. Chem. 51: 1667-1674.
Luj´an-Rhenals, D. E., R. O. Morawicki, E. E. Gbur and S. C. Ricke. 2015. Fermentation of soybean meal hydrolyzates with Saccharomyces cerevisiae and Zymomonas mobilis for ethanol production. J. Food Sci. 80: E1512-E1518.
Lqari, H., J. Vioque, J. Pedroche and F. Millán. 2002. Lupinus angustifolius protein isolates: Chemical composition, functional properties and protein characterization. Food Chem. 76: 349-356.
Mansour, E. H., E. Dworschák, A. Lugasi, Ö. Gaál, É. Barna and A. Gergely. 1993. Effect of processing on the antinutritive factors and nutritive value of rapeseed products. Food Chem. 47: 247-252.
Mejicanos, G., N. Sanjayan, I. H. Kim and C. M. Nyachoti. 2016. Recent advances in canola meal utilization in swine nutrition. J.
Anim. Sci. Technol. 58: 7-19.
Mourato, M. P., I. N. Moreira, I. Leitão, F. R. Pinto, J. R. Sales and L. L. Martins. 2015. Effect of heavy metals in plants of the genus Brassica. Int. J. Mol. Sci. 16: 17975-17998.
Newkirk, R. 2009. Canola meal: Feed industry guide. Canadian International Grains Institute, Winnipeg, Canada. Available from: http://www.canolacouncil.org.
Newkirk, R. W. and H. L. Classen. 2002. The effects of toasting canola meal on body weight, feed conversion efficiency, and mortality in broiler chickens. Poult. Sci. 81: 815-825.
Newkirk, R. W., H. L. Classen, T. A. Scott and M. J. Edney. 2003. The digestibility and content of amino acids in toasted and non-toasted canola meals. Can. J. Anim. Sci. 83: 131-139.
Nioi, C., R. Kapel, E. Rondags, I. Marc. 2012. Selective extraction, structural characterisation and antifungal activity assessment of napins from an industrial rapeseed meal. Food Chem. 134: 2149-2155.
Ogunyinka, B. I., B. E. Oyinloye, F. O. Osunsanmi, A. P. Kappo and A. R. Opoku. 2017. Comparative study on proximate, functional, mineral, and antinutrient composition of fermented, defatted, and protein isolate of Parkia biglobosa seed. Food Sci. Nutr. 5: 139-147.
Pandey, K. B. and S. I. Rizvi. 2009. Plant polyphenols as dietary antioxidants in human health and disease. Oxid. Med. Cell Longev. 2: 270-278.
Pastuszewska, B., A. Ochtabinska and A. Morawski. 2000. A note on the nutritional adequacy of stock diets for laboratory rats and mice. J. Anim. Feed Sci. 9: 533-542.
Paulen, R., M. Jelemenský, M. Fikar and Z. Kovács. 2013. Optimal balancing of temporal and buffer costs for ultrafiltration/ diafiltration processes under limiting flux conditions. J. Membr. Sci. 444: 87-95.
Pedroche, J., M. M. Yust, H. Lqari, J. Girón-Calle, M. Alaiz, J. Vioque and F. Millán. 2004. Brassica carinata protein isolates: Chemical composition, protein characterization and improvement of functional properties by protein hydrolysis. Food Chem. 88: 337-346.
Petkova, N., I. Ivanov, P. Denev and A. Pavlov. 2014. Bioactive substance and free radical scavenging activities of flour from Jerusalem artichoke (Helianthus tuberosus L.) tubers - A comparative study. Turk. J. Agric. Nat. Sci. Special Issue 2: 1773-1778.
Reddy, B. S., C. Sharma, B. Simi, A. Engle, K. Laakso, P. Puska and R. Korpela. 1987. Metabolic epidemiology of colon cancer: Effect of dietary fiber on fecal mutagens and bile acids in healthy subjects. Cancer Res. 47: 644-648.
Rodrigues, I. M. M., M. G. V. Carvalho and J. M. S. Rocha. 2014. Increasing the protein content of rapeseed meal by enzymatic hydrolysis of carbohydrates. BioResources. 9: 2010-2025. Shires, A., J. M. Bell, W. H. Laverty, P. Fedec, J. A. Blake and
D. I. McGregor. 1983. Effect of desolventization conditions and removal of fibrous material by screening on the nutritional value of canola rapeseed meal for broiler chickens. Poult. Sci. 62: 2234-2244.
Slawski, H., H. Adem, R. P. Tressel, K. Wysujack, U. Koops, Y. Kotzamanis, S. Wuert and C. Schulz. 2012. Total fish meal replacement with rapeseed protein concentrate in diets fed to
rainbow trout (Oncorhynchus mykiss Walbaum). Aquacult. Int. 20: 443-453.
Sosulski, F. W. 1983. Rapeseed protein for food use. In: B. J. F. Hudson (Ed.), Developments in Food Proteins, Applied Science Publishers Ltd., London, UK, pp. 109-132.
Southgate, D. A. T. 1991. Determination of Food Carbohydrates, Elsevier Applied Science Publishers Ltd., London, UK, pp. 123-198.
Tan, S. H., R. J. Mailer, C. L. Blanchard and S. O. Agboola. 2011. Canola proteins for human consumption: Extraction, profile, and functional properties. J. Food Sci. 76: R16-R28.
Turnlund, J. R., J. C. King, W. R. Keyes, B. Gong and M. C. Michel. 1984. A stable isotope study of zinc absorption in young men: Effects of phytate and alpha-cellulose. Am. J. Clin. Nutr. 40: 1071-1077.
Tzeng, Y., L. L. Diosady and L. J. Rubin. 1988. Preparation of rapeseed protein isolates using ultrafiltration, precipitation and diafiltration. Can. Inst. Food Sci. Technol. J. 21: 419-424. Uppstrom, B. 1995. Seed chemistry. In: Kimber, D. S. and
D. I. McGregor, (Eds.), Brassica Oilseeds: Production and Utilization, CAB International, Wallingford, UK, pp. 217-42, 242. Wanasundara, J. P. D. 2011. Proteins of brassicaceae oilseeds and
their potential as a plant protein source. Crit. Rev. Food Sci. Nutr. 51: 635-677.
Wanasundara, J. P. D., T. C. McIntosh, S. P. Perera, T. S. Withana-Gamage and P. Mitra. 2016. Canola/rapeseed protein-functionality and nutrition. OCL. 23: D407.
Wang, X., D. Liu, J. Tu, Z. Li and Y. Wang. 2005. Cd, Cu, Zn and Pb contents and forms in soils and rapeseeds around Wuhu Plant. Ying Yong Sheng Tai Xue Bao. 16: 1924-1931.
Wang, X., C. Tang, X. Yang and W. Gao. 2008. Characterization, amino acid composition and in vitro digestibility of hemp (Cannabis sativa L.) proteins. Food Chem. 107: 11-18.
WHO. 1996. Trace Elements in Human Nutrition, World Health Organization, Geneva, Switzerland.
Wong, A., K. Pitts, V. Jayasena and S. Johnson. 2013. Isolation and foaming functionality of acid-soluble protein from lupin (Lupinus angustifolius) kernels. J. Sci. Food Agric. 93: 3755-3762. Wu, J. and A. D. Muir. 2008. Comparative structural, emulsifying, and
biological properties of 2 major canola proteins, cruciferin and napin. J. Food Sci. 73: C210-C216.
Yoshie-Stark, Y., Y. Wada, M. Schott and A. Wäsche. 2006. Functional and bioactive properties of rapeseed protein concentrates and sensory analysis of food application with rapeseed protein concentrates. LWT Food Sci. Technol. 39: 503-512.
Yoshie-Stark, Y., Y. Wada and A. Wasche. 2008. Chemical composition, functional properties, and bioactivities of rapeseed protein isolates. Food Chem. 107: 32-39.
Zum Felde, T., A. Baumert, D. Strack, H. C. Becker and C. Möllers. 2007. Genetic variation for sinapate ester content in winter rapeseed (Brassica napus L.) and development of NIRS calibration equations. Plant Breed. 126: 291-296.
Zwijnenberg, H. J., A. J. B. Kemperman, M. E. Boerrigter, M. Lotz, J. F. Dijksterhuis, P. E. Poulsen and G. Koops. 2002. Native protein recovery from potato fruit juice by ultrafiltration. Desalination. 144: 331-334.