Performance and nutrient utilization in South American juvenile catfish
Pseudoplatystoma
spp. weighting 89 – 170g, fed at different
energy and protein levels
[Desempenho e utilização de nutrientes em juvenis de surubim Pseudoplatystoma spp. alimentados com diferentes níveis de energia e proteína]
E.A. Teixeira1, A.C.C. Euler2, P.M.C. Faria3, E.M. Turra1, R.K. Luz1, S.A. Prado1,
R. Takata4, P.A.P. Ribeiro1, D.O. Fontes1, L.P. Ribeiro1, E.O.S. Saliba1
1Escola de Veterinária Universidade Federal de Minas Gerais Belo Horizonte, MG 2EMATER-MG Belo Horizonte, MG
3Escola Agrícola de Jundiaí – Universidade Federal do Rio Grande do Norte Macaíba, RN 4Universidade Federal Rural da Amazônia Belém, PA
ABSTRACT
Most studies in nutrition for the South American catfish (surubim) were limited to the initial phase of development. However, it is clear that performance and nutrient utilization can change during the life stages of a fish. Therefore, this study aimed to evaluate the performance and nutrient utilization in juveniles of surubim fed diets varying in protein and energy levels. Two experiments were performed to test different levels of energy and protein in formulated diets. In the first experiment, surubim juveniles (89.2±4.8g) were fed five diets containing different levels of energy (18.0, 18.8, 19.6, 20.5, 21.3 MJ/kg). In the second experiment, juveniles (170.03±3.35g) were fed five diets containing different levels of protein (360, 400, 440, 480 and 520g/kg). The most favorable energy level for weight gain was 20.3 MJ/kg. The increasing energy levels provided a rise in fat and decrease in protein whole-body composition. The protein amount was between 360 to 400g/kg (383g/kg), which was adequate for performance and nutrient assimilation in surubim juveniles.
Keywords: carnivorous species, neotropical fish, nutrition, surubim
RESUMO
A maior parte dos estudos a respeito dos aspectos nutricionais do surubim está limitada às primeiras fases de desenvolvimento. Entretanto, é claro que o desempenho e a utilização dos nutrientes podem mudar durante os diferentes estágios de desenvolvimento destes animais. Assim sendo, este estudo teve como objetivo avaliar o desempenho e a utilização de nutrientes em juvenis de surubim alimentados com dietas contendo níveis variáveis de energia e proteína. Dois experimentos foram realizados para testar os diferentes níveis de proteína e energia. No primeiro experimento, juvenis de surubim (89,2±4,8g) foram alimentados com cinco dietas contendo níveis diferentes de energia (18.0, 18.8, 19.6, 20.5, 21.3MJ/kg). No segundo experimento, os juvenis (170,03±3,35g) foram alimentados com dietas contendo cinco níveis de proteína (360, 400, 440, 480 e 520g/kg). O melhor nível de energia para ganho de peso foi 20,3 MJ/kg. O aumento dos níveis de energia levou a um incremento nos níveis de lipídeo e diminuição da proteína corporal. Níveis de proteína entre 360 a 400g/kg foram os mais adequados para o desempenho e utilização dos nutrientes em juvenis grandes de surubim.
Palavras-chave: espécies carnívoras, peixes neotropicais, nutrição, surubim
Recebido em 16 de julho de 2012
INTRODUCTION
The South American catfish, Pseudoplatystoma spp., also known as surubim, can be found in the great river basins of South America (Buitrago-Suárez and Burr, 2007). Some research has been performed to improve the knowledge on physiology (Arslan et al., 2008; 2009; Noffs et al., 2009) and nutrition (Gonçalves and Carneiro, 2003; Teixeira et al., 2010) of surubim juveniles. However, there are still gaps in the information that need to be filled regarding the rearing system and nutrient utilization.
The nutritional requirements and feed efficiency can change during the fish growth cycle, mainly due to the different rates of growth and metabolism found throughout the life cycle (Einen and Roem, 1997; Azevedo et al., 2004). Bermudes et al. (2010) showed that in barramundi (Lates calcarifer) juveniles, larger fish lost more energy through nitrogen excretion when compared to smaller fish. Dabrowski (1986) commented that fish in the initial phase of development might have higher nutrient requirements to support elevated growth rate compared to fish in later stages of development.
The adequate amount of nutrients in the diet and feeding management are essential areas where operating costs can be decreased in fish farming operations (Food..., 2006). Therefore, this study aimed to evaluate the effect of different levels of protein and energy on performance and nutrient utilization in juveniles of the surubim hybrid, Pseudoplatystoma spp.
MATERIALS AND METHODS
In order to evaluate the effect of protein and energy in surubim juveniles, two experiments were carried through, one to evaluate different energy levels and another one where the effect of graded levels of protein were tested. The research project for both experiments was sent to the Ethics in Animal Research Committee of the Federal University of Minas Gerais and was approved with the following administrative process numbers 86/2009 and 87/2009. The first experiment was performed for 45 days. All of the procedures were developed at the Aquaculture Laboratory of the Federal University of Minas Gerais (LAQUA). A total of 240 hybrid surubim
juveniles (Pseudoplatystoma coruscans x P. reticulatum) with a mean body weight of 89.2±4.8g, were distributed in 20 400-L circular tanks (12 juveniles/tank) in a recirculating aquaculture system, with a water-flow rate of 400L/hour in each tank. This system had a stone-sand filter, biological filter, pumps and heaters with electronic control (28±1oC), and aeration was supplied for each tank (6.0±0.7mg/L). The pH was measured daily at 0800h, using a portable electronic pH device (Russel – RL06OP). The pH values ranged between 7.2 and 7.5. The nitrite levels were measured weekly using HACH kits (DREL 2010), and the values stayed below 110mg/L. The fish were hand fed twice a day (at 1200 and 0430 h) until apparent satiation, and all uneaten feed was collected 10 min after feeding. This experiment was conducted in a completely randomized design with five treatments and four replicates. Five isonitrogenous diets were formulated to contain increasing levels of gross energy as follows: 18.1, 18.8, 19.6, 20.5 and 21.3 MJ/kg. The ingredient inclusion and the analyzed composition of the diets are presented in Tab. 1. Digestible energy (DE) levels were estimated using the apparent digestibility coefficients of foods obtained by Gonçalves and Carneiro (2003), Teixeira (2008) and Teixeira et al. (2010).
The ingredients in the formulated diets were mixed and pelleted in a commercial meat grinder to a diameter of 3mm. Next, the pellets were air dried for 48 h at 55oC and stored in sealed plastic bags at -18oC until the beginning of the trial.
The second experiment, evaluating the protein levels for surubim juveniles was performed for 40 days, under similar experimental conditions as Experiment 1. One hundred and sixty hybrid surubim juveniles (Pseudoplatystoma coruscans x P. reticulatum), with a mean body weight of 170.0±3.3g, were distributed in 20 400-L circular tanks (eight juveniles/tank) in a recirculating aquaculture system, with a water flow rate of 400 L/hour in each tank. The oxygen concentration and temperature were kept at 5.9±0.9mg.L-1 and 28±1oC, respectively. The nitrite levels were
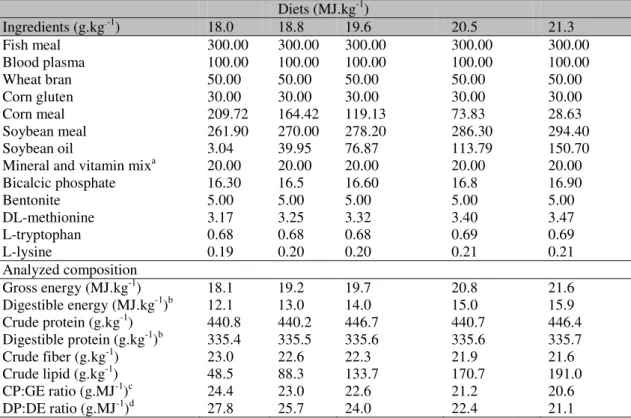
Table 1. Formulation and proximate composition of the experimental diets containing different energy levels.
Diets (MJ.kg-1)
Ingredients (g.kg.-1) 18.0 18.8 19.6 20.5 21.3
Fish meal 300.00 300.00 300.00 300.00 300.00
Blood plasma 100.00 100.00 100.00 100.00 100.00
Wheat bran 50.00 50.00 50.00 50.00 50.00
Corn gluten 30.00 30.00 30.00 30.00 30.00
Corn meal 209.72 164.42 119.13 73.83 28.63
Soybean meal 261.90 270.00 278.20 286.30 294.40
Soybean oil 3.04 39.95 76.87 113.79 150.70
Mineral and vitamin mixa 20.00 20.00 20.00 20.00 20.00
Bicalcic phosphate 16.30 16.5 16.60 16.8 16.90
Bentonite 5.00 5.00 5.00 5.00 5.00
DL-methionine 3.17 3.25 3.32 3.40 3.47
L-tryptophan 0.68 0.68 0.68 0.69 0.69
L-lysine 0.19 0.20 0.20 0.21 0.21
Analyzed composition
Gross energy (MJ.kg-1) 18.1 19.2 19.7 20.8 21.6
Digestible energy (MJ.kg-1)b 12.1 13.0 14.0 15.0 15.9
Crude protein (g.kg-1) 440.8 440.2 446.7 440.7 446.4
Digestible protein (g.kg-1)b 335.4 335.5 335.6 335.6 335.7
Crude fiber (g.kg-1) 23.0 22.6 22.3 21.9 21.6
Crude lipid (g.kg-1) 48.5 88.3 133.7 170.7 191.0
CP:GE ratio (g.MJ-1)c 24.4 23.0 22.6 21.2 20.6
DP:DE ratio (g.MJ-1)d 27.8 25.7 24.0 22.4 21.1
aMineral and vitamin mix (units.kg-1): vitamin A, 1,200.000UI; vitamin D3, 200.000UI; vitamin E, 12,000mg;
vitamin K3, 2,400mg; vitamin B1, 4,800mg; vitamin B2, 4,800mg; vitamin B6, 4,000mg; vitamin B12, 4,800mg; folic acid, 1,200mg; calcium pantothenate, 12,000mg; vitamin C, 48,000mg; biotin, 48mg; choline, 65,000mg; nicotinic acid, 24,000mg; Fe, 10,000mg; Cu, 600mg; Mn, 4,000mg; Zn, 6,000mg; I, 20mg; Co, 2mg, Se, 20mg.
bThe calculations of digestible protein and energy were based on results by Gonçalves and Carneiro (2003), Teixeira
(2008) and Teixeira et al. (2010).
cCP – crude protein; GE – gross energy. dDP - digestible protein; DE – digestible energy.
The experiment was conducted in a completely randomized design with five treatments and four replicates, where each diet was designed as one treatment. Five diets were formulated to be isoenergetic and with different levels of crude protein as follows: 360, 400, 440, 480 and 520g/kg. The digestible protein in each formulated diet was calculated following the digestibility results derived by Gonçalves and Carneiro (2003) and Teixeira (2008), Teixeira et al. (2010).
The ingredients were mixed and pelleted in a commercial meat grinder to a 3mm diameter.
Next, the pellets were air dried for 48 h at 55oC
and stored in sealed plastic bags at -18oC until
use. The formulation and analyzed composition of the diets are presented in Tab. 2.
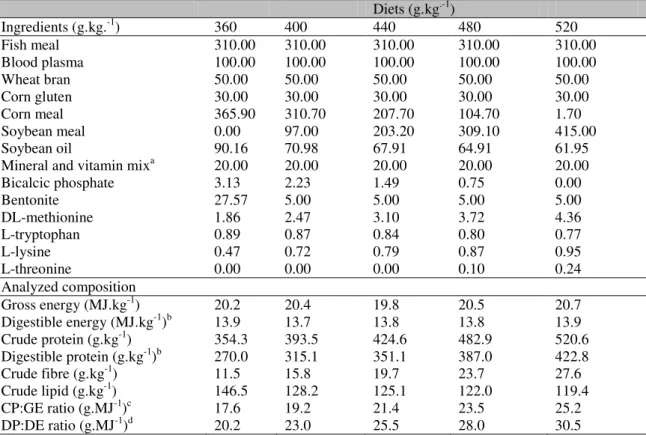
Table 2. Formulation and proximate composition of the experimental diets containing different protein levels
Diets (g.kg.-1)
Ingredients (g.kg.-1) 360 400 440 480 520
Fish meal 310.00 310.00 310.00 310.00 310.00
Blood plasma 100.00 100.00 100.00 100.00 100.00
Wheat bran 50.00 50.00 50.00 50.00 50.00
Corn gluten 30.00 30.00 30.00 30.00 30.00
Corn meal 365.90 310.70 207.70 104.70 1.70
Soybean meal 0.00 97.00 203.20 309.10 415.00
Soybean oil 90.16 70.98 67.91 64.91 61.95
Mineral and vitamin mixa 20.00 20.00 20.00 20.00 20.00
Bicalcic phosphate 3.13 2.23 1.49 0.75 0.00
Bentonite 27.57 5.00 5.00 5.00 5.00
DL-methionine 1.86 2.47 3.10 3.72 4.36
L-tryptophan 0.89 0.87 0.84 0.80 0.77
L-lysine 0.47 0.72 0.79 0.87 0.95
L-threonine 0.00 0.00 0.00 0.10 0.24
Analyzed composition
Gross energy (MJ.kg-1) 20.2 20.4 19.8 20.5 20.7
Digestible energy (MJ.kg-1)b 13.9 13.7 13.8 13.8 13.9
Crude protein (g.kg-1) 354.3 393.5 424.6 482.9 520.6
Digestible protein (g.kg-1)b 270.0 315.1 351.1 387.0 422.8
Crude fibre (g.kg-1) 11.5 15.8 19.7 23.7 27.6
Crude lipid (g.kg-1) 146.5 128.2 125.1 122.0 119.4
CP:GE ratio (g.MJ-1)c 17.6 19.2 21.4 23.5 25.2
DP:DE ratio (g.MJ-1)d 20.2 23.0 25.5 28.0 30.5
aMineral and vitamin mix (units.kg-1): vitamin A, 1,200.000UI; vitamin D3, 200.000UI; vitamin E, 12,000mg;
vitamin K3, 2,400mg; vitamin B1, 4,800mg; vitamin B2, 4,800mg; vitamin B6, 4,000mg; vitamin B12, 4,800mg; folic acid, 1,200mg; calcium pantothenate, 12,000mg; vitamin C, 48,000mg; biotin, 48mg; choline, 65,000mg; nicotinic acid, 24,000mg; Fe, 10,000mg; Cu, 600mg; Mn, 4,000mg; Zn, 6,000mg; I, 20mg; Co, 2mg, Se, 20mg.
bThe calculations of digestible protein and energy were based on results by Gonçalves and Carneiro (2003), Teixeira
(2008) and Teixeira et al. (2010).
cCP – crude protein; GE – gross energy. dDP - digestible protein; DE – digestible energy.
The results of carcass composition (dry matter, protein, lipids and energy) were used to determine the use in the surubim juveniles. The following parameters were considered: protein gain (PG) = (final body weight x final body protein) – (initial body weight x initial body protein)/day; protein efficiency rate (PER) = WG/total protein intake (g); protein productive value (PPV) = (final body weight x final body protein) – (initial body weight x initial body protein)/total protein intake (g); energy gain (EG) = (final body weight x final body energy) - (initial body weight x initial body energy)/day; energy efficiency rate (EER): WG/total energy intake (MJ).
The data were subjected to one-way analysis of variance (ANOVA) using the SAEG 9.1
program. The normality and homoscedasticity of the variances were checked previously. Multiple regression analysis equations were used to identify the adequate levels of energy and protein in surubim juveniles.
RESULTS
The increasing levels of energy provided an increase in energy gain that could be explained by a linear function (P<0.05). Among these
results, the weight and protein gain showed that the adequate energy level was 20.3 and 19.7 MJ/kg, respectively (Fig. 1).
Figure 1. Weight gain (A) and protein gain (B) in surubim juveniles fed diets containing different energy levels.
The parameters of body composition (protein, lipids and energy) showed a linear function (P<0.05). The whole-body protein decreased with the increase in diet energy level, and the lipids and energy showed an opposite trend (P<0.05) (Tab. 3).
The increase of energy in the diets provided alterations in nutrient utilization. In fact, the protein gain showed a similar trend that could be
explained by a quadratic function (P<0.05) (Tab. 3). The better energy level for protein gain was found to be 19.7 MJ/kg (Fig.1).
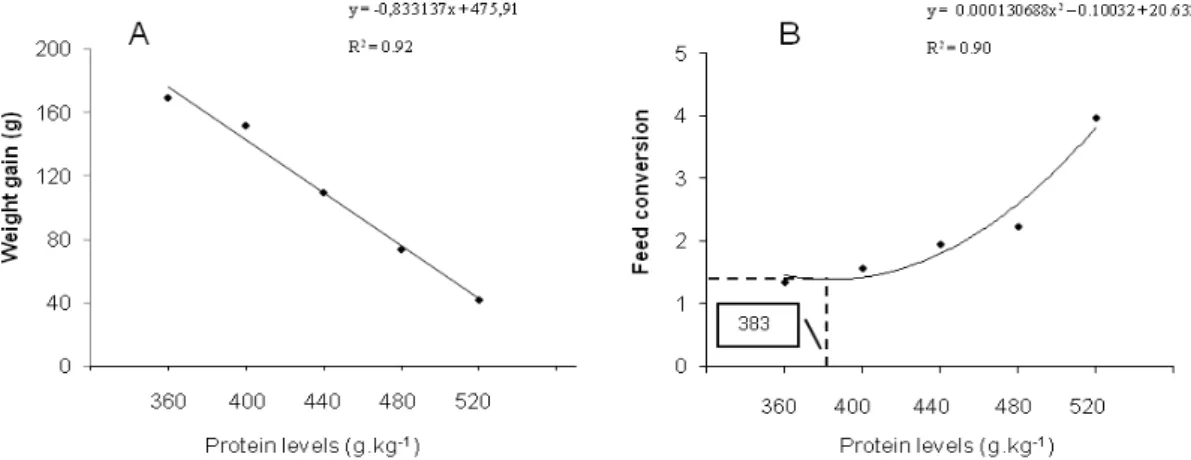
In Experiment 2, all of the analyzed parameters provided a linear function with the exception of feed conversion. This parameter showed a quadratic function (P<0.05) and showed that the best protein level was 383.8g/kg (Fig. 2).
Figure 2. Weight gain (A) and feed conversion (B) in surubim juveniles fed diets containing different protein levels.
Contrary to the observations in the experiment on different energy levels, an increasing amount of protein in the diet (360-520g/kg of the diet) provided an increase in protein in the whole-body for the juveniles and a decrease in lipids and energy (P<0.05) (Table 4).
results decreased with the increase of protein levels from 360 to 520g/kg in the diets. The increase of protein in the experimental diets did
not improve the nutrient utilization in surubim juveniles.
Table 3. Growth performance, body composition and nutrient utilization in surubim juveniles fed diets containing different energy levels
Parameters Energy levels (MJ.kg-1)
Initial 18.1 19.2 19.7 20.8 21.6 R2 Equation
Initial body
weight (g) 87.31 ns Final body
weight (g)* 141.466.13 161.569.99 166.727.17 165.8613.87 159.916.33 0.99 y = -5.36x
2 + 218.09 – 2047.98 Daily weight
gain (g)** 0.98 y = -0.11x
2 + 4.66x
-45.45 Daily feed
intake (g) 2.29 0.28 2.10 0.12 2.48 0.13 2.53 0.09 2.18 0.20 ns Feed
conversion ns
Body composition1 Protein1** 59.43
2.58 57.09 3.88 57.88 0.35 54.11 0.97 52.89 1.01 48.95 2.01 0.99
y = 4.37639.00x –
416216.00 Lipid1** 17.99
1.49 15.01 0.55 15.15 0.87 22.61 0.99 27.14 2.04
31.31
0.88 y = 5.05x – 78.21
Energy
(MJ)** 18.12 2.04 17.98 0.83 18.49 076 20.24 0.96 20.55 0.45 21.91 0.89 y = 1.12x – 2.47
Nutrient utilization Protein
efficiency rate
1.19
0.11 1.72 0.21 1.56 0.21 1.51 0.18 1.59 0.12 ns Protein
productive value
45.34 5.59
41.64 2.45
49.95 2.58
50.14
1.84 43.76 3.97 0.89 ns Energy gain*
6.65 30.18 4.45 y = 5.62x – 77.33 Energy
efficiency rate
ns
1 Dry basis (%); ns: no significant; Means (n=4) S.D.
*Significance denoted as: P0.05; **Significance denoted as: P0.01;
DISCUSSION
In this study, the most favorable level for surubim to achieve the greatest weight gain was 20.3 MJ.kg-1 (4856kcal/kg). A high energy diet for the carnivorous fish species has been shown to be efficient to improve nutrient utilization (Martino et al., 2000). The majority of this high energy level comes from lipids and protein, due to the poor efficiency in utilizing carbohydrates (Fu and Xie, 2004). However, there is a limit to the increase in energy in the formulated diet, because the excess can lead to lipid deposition and decrease nitrogen retention in the fish body
Table 4. Growth performance, body composition and nutrient utilization of surubim juveniles fed diets containing different protein levels
Protein levels (g.kg-1)
Parameters Initial 360 400 440 480 520 R2 Equation
Initial body
weight (g) ns Final body
weight (g)** 340.1523.19 320.7616.33 280.985.61 244.2414.09 210.6610.21 0.99 y = -0.84x + 648.40 Daily weight
gain (g)** 4.240.46 3.790.48 2.740.17 1.840.27 1.050.26 0.98 y = -0.02 + 11.90 Daily feed
intake (g)* 5.680.13 5.930.49 5.330.24 4.040.15 4.090.76 0.74 y = -0.01x + 10.61
Body composition Protein1** 54.18
3.76 37.531.61 42.661.47 44.681.60 48.691.59
53.35
0.98 y = 0.09x + 3.97
Lipid1** 22.24
6.72 33.121.65 30.671.10 26.581.40 23.751.55 0.92 y = -0.11x + 78.42 Energy
(MJ)** 19.841.62
21.620.48
21.24 0.18
19.95 0.20
19.85
0.37 0.91 y = -0.01x + 27.66
Nutrient utilization
Protein gain* 88.07
21.30 113.32 26.19 81.68 5.19 65.92 3.29 52.44 19.26 0.55 y = -0.30 + 210.83 Protein
efficiency rate**
2.11
0.23 1.62 0.09 1.21 0.04 0.95 0.17 0.49 0.04 0.98 y = -97.67x + 5.57 Energy
gain** 103.32 15.36
64.27 4.48
37.23 4.68
20.93
7.01 0.98 y = -0.54x + 301.96 Energy
efficiency rate**
0.96 y = -0.014x + 8.98
Productive
protein value 0.78 y = -0.13x + 95.95 1 Dry basis (%);
ns: no significant; Means (n=4) S.D.
*Significance denoted as: P0.05; **Significance denoted as: P0.01.
This study presents new results regarding the effect of different levels of protein on the performance of surubim juveniles. The surubim fed diets containing minor protein levels (360-400g/kg) improved protein gain and protein efficiency retention in the carcass. The adequate protein level for weight gain in this study was lower than those used by other researchers, such as Martino et al. (2002, 2002a and 2005), Aslan et al. (2008, 2009) and Noff et al. (2009). These studies used practical and purified dietary formulations with protein levels varying from 454 to 668g/kg of the diet. The NRC (National..., 1993) reported a range from 400 to 550g/kg of diet for carnivorous fish species, which is higher than those suggested in this study and by Lundstedt et al. (2004). The latter recommended diets for surubim with a crude protein content ranging from 300 to 400g of diet, determined through enzyme assay. Actually, the range of
protein levels (360 to 400g/kg) proposed by this study fits the range suggested by Lundstedt et al. (2004), which used juveniles with initial mean body weight of 68g.
indispensable amino acids deficient in plant protein. This approach probably decreased the effect of amino acid imbalance in diets. The partial replacement of fish meal with plant protein with inclusion of synthetic amino acids, to keep a well-balanced amino acid profile in diets, was already carried out with success for fish growth (Hardy, 2010).
The use of plant protein, more precisely soybean meal, in dietary formulations is limiting due to the anti-nutritional factors present in these ingredients (Escaffre et al., 1997). The anti-nutrients or their metabolic products can interfere in food utilization and affect the health and production of animals (Francis et al., 2001). Therefore, the elevated inclusion of soybean meal in diets with the highest levels of protein, may have affected the performance of the surubim juveniles. For rainbow trout the growth rate was reduced significantly when soybean meal was added in diets (Dabrowski et al. 1989). Thus, future studies should to be carried out in order to evaluate the growth and physiology of surubim juveniles fed with plant protein sources, more precisely to investigate the effects of amino acid imbalance and anti-nutritional factors.
CONCLUSIONS
The energy and protein levels in diets affect the performance and nutrient utilization in surubim juveniles. The dietary energy levels between 19.7 and 20.3 MJ/kg and protein levels between 360 and 400g/kg are adequate for growth performance and better nutrient utilization in surubim juveniles.
ACKNOWLEDGMENTS
We wish to thank FAPEMIG, CNPq, CAPES and Ministry of Fisheries and Aquaculture – MPA, for providing stipends and financial support for this project.
REFERENCES
ARSLAN, M.; DABROWSKI, K.; PORTELLA, M.C. Growth, fat content and fatty acid profile of South American catfish, surubim (Pseudoplatystoma fasciatum) juveniles fed live, commercial and formulated diets. J. Appl. Ichthyol., v.25, p.73-78, 2009.
ARSLAN, M.; RINCHARD, J.; DABROWSKI, K. et al. Effects of different dietary lipid sources on the survival, growth, and fatty acid composition of South American catfish, Pseudoplatystoma fasciatum, surubim juveniles. J. World Aquac. Soc., v.39, p.51-61, 2008. AZEVEDO, P.A.; LEESON, S.; CHO, C.Y. et al. Growth, nitrogen and energy utilization of juveniles from four salmonid species: diet, species and size effects. Aquaculture, v.234, p.393-414, 2004.
BERMUDES, M.; GLENCROSS, B.; AUSTEN, K. et al. The effects of temperature and size on the growth, energy budget and waste outputs of barramundi (Lates calcarifer). Aquaculture, v.306, p.160-166, 2010.
BUITRAGO-SUÁREZ, U.; BROOKS, M.B. Taxonomy of the catfish genus Pseudoplatystoma Bleeker (Siluriformes: Pimelodidae) with recognition of eight species. Zootaxa, v.1512, p.1-38, 2007.
DABROWSKI, K. Ontogenetical aspect of nutritional requirements in fish. Comp. Biochem. Physiol., v.85a, p.639-655, 1986.
DABROWSKI, K.; POCZYNSKI, P.; KÖCK, G. et al. Effect of partially or totally replacing fish meal protein by soybean meal protein on growth, food utilization and proteolytic enzyme activities in rainbow trout (Salmo gairdneri). New in vivo test for exocrine pancreatic secretion. Aquaculture, v.77, p.29-49, 1989.
EINEN, O.; ROEM, A.J. Dietary protein/energy ratios for Atlantic salmon in relation to fish size: growth, feed utilization and slaughter quality. Aquacul. Nutrit., v.3, p.115-126, 1997.
ESCAFFRE, A.M.; ZAMBONINO INFANTE, J.L.; CAHU, C.L. et al. Nutritional value of soy protein concentrate for larvae of common carp C Cyprinus carpio) based on growth performance and digestive enzyme activities. Aquaculture, v.153, p.63-80, 1997.
FRANCIS, G.; MAKKAR, H.P.S.; BECKER, K. Antinutritional factors present in plant-derived alternate fish feed ingredients and their effects in fish. Aquaculture. v.199, p.197-227, 2001. FU, S.J.; XIE, X.J. Nutritional homeostasis in carnivorous southern catfish (Silurus meridionalis): is there a mechanism for increased energy expenditure during carbohydrate overfeeding? Comparative Biochemistry and Physiology Part A: Molecular & Integrative Physiology, v.139, p.359-363, 2004.
GATLIN D.M.; BARROWS F.T.; BROWN P. et al. Expanding the utilization of sustainable plant products in aquafeeds: a review. Aquatic Research, v.38, p.551-579, 2007.
GONÇALVES, E.G.; CARNEIRO, D.J. Coeficiente de digestibilidade aparente da proteína e energia de alguns ingredientes utilizados em para o pintado (Pseudoplatystoma coruscans). Rev. Bras. Zootec., v.32, p.779-786, 2003.
HARDY, R.W. Utilization of plant proteins in fish diets: effects of global demand and supplies of fishmeal. Aquacul. Resea., v.41, p.770-776, 2010.
KAUSHIK, S.; SEILIEZ, I. Protein and amino acid nutrition and metabolism in fish: current knowledge and future needs. Aquacul. Resea., v.41, p.322-332, 2010.
LUNDSTEDT, L.M.; MELO, J.F.B.; MORAES, G. Digestive enzymes and metabolic profile of Pseudoplatystoma corruscans (Teleostei: Siluriformes) in response to diet composition. Comparative Biochemistry and Physiology Part B: Biochemistry and Molecular Biology. v.137, p.331-339, 2004.
MARTINO, R.C.; CYRINO, J.E.P.; PORTZ, L. et al. Effect of dietary lipid level on nutritional performance of the surubim, Pseudoplatystoma coruscans. Aquaculture, v.209, p.209-218, 2002. MARTINO, R.C.; CYRINO, J.E.P.; PORTZ, L. et al. Performance and fatty acid composition of surubim (Pseudoplatystoma coruscans) fed diets with animal and plant lipids. Aquaculture. v.209, p.233-246, 2002a.
MARTINO, R.C.; CYRINO, J.E.P.; PORTZ, L. et al. Performance, carcass composition and nutrient utilization of surubim Pseudoplatystoma coruscans (Agassiz) fed diets with varying carbohydrate and lipid levels. Aquac. Nut., v.11, p.131-137, 2005.
NATIONAL Research Council – NRC. Nutrient Requirements of Warmwater Fishes and Shellfishes, National Academy Press, Washington, DC, USA, 1993, 114p.
NOFFS, M.D.; MARTINO, R.C.; TRUGO, L.C. et al. Dietary fish oil replacement with lard and soybean oil affects triacylglycerol and phospholipid muscle and liver docosahexaenoic acid content but not in the brain and eyes of surubim juveniles Pseudoplatystoma sp. Fish Physiol. Biochem., v.35, p.399-412, 2009. TEIXEIRA, E.A. Avaliação de alimentos e exigências de energia e proteína para juvenis de surubim (Pseudoplatystoma sp.). 2008. 111p. Tese (Doutorado em Zootecnia) Escola de Veterinária, Universidade Federal de Minas Gerais, Belo Horizonte, MG.