Exploring alternative oxidase (AOX)
as a functional marker candidate for
efficient somatic embryogenesis in
Daucus carota L.
António Miguel da Costa Magriço e Frederico
Tese apresentada à Universidade de Évora para obtenção do Grau de Doutor em Ciências Agrárias Especialidade: Biotecnologia
ORIENTADOR (A/ES):Professor Doutor Augusto António Vieira Peixe
Professor Doutor Manuel Pedro Salema Fevereiro Doutora Elena Baena-González
Nome: António Miguel da Costa Magriço e Frederico Endereço electrónico: [email protected]
Telefone: 00351 - 927572460
Cartão de Cidadão: 11161262 - 4ZY8
Título: Exploring alternative oxidase (AOX) as a functional marker candidate for efficient somatic embryogenesis in Daucus carota L.
Orientadores: Prof. Dr. Augusto Peixe; Prof. Dr. Pedro Fevereiro; Dra. Elena Baena-González
Ano de conclusão: 2017
Designação do Doutoramento: Doutoramento em Ciências Agrárias - Biotecnologia
É AUTORIZADA A REPRODUÇÃO PARCIAL DESTA TESE. APENAS PARA EFEITOS DE INVESTIGAÇÃO, MEDIANTE DECLARAÇÃO ESCRITA DO INTERESSADO, QUE A TAL SE COMPROMETE.
IFFA/UE, 24/03/2017 Assinatura:
Competitiveness Factors - COMPETE, the European Commission - Marie Curie Excellence Chairs (MEXC-CT-2004-006669), national funds through FCT - Foundation for Science and Technology under the Strategic Project PEst-C/AGR/UI0115/2011, Project: PTDC/EBB-BIO/099268/2008 and an individual fellowship to AMF - SFRH/BD/64987/2009.
…A hidden connection is stronger
than an obvious one…
Heraclitus of Ephesus 535 BC - 475 BC
In memory of my ascendants: António Magriço Maria Jesus António Frederico Carmina Mendes Manuel Frederico
At the final stage of this thesis, I could not leave without acknowledging the ones that directly or indirectly contributed to the final achievements and its conclusion. In particular, I would like to acknowledge to:
- My initial supervisors, Prof. Dr. Birgit Arnholdt-Schmitt and Dr. Hélia Cardoso, from whom I learned a lot. I deeply regret the situation that, in the end, would not allow us to pursue this project together. Nevertheless, I would like to express here my deepest acknowledgement to both;
- My current supervisors, Prof. Dr. Pedro Fevereiro, Dr. Elena Baena-González and Prof. Dr. Augusto Peixe, who embraced the challenge to carry through a thesis in the context of an uncommon situation. I deeply acknowledge your courage, words, and all the advices and help throughout the thesis writing process;
- The board of governance of the University of Évora with the support rendered during the complex process of supervision change;
- The IIFA and ICAAM former and present directors and staff, by the support and encouragement throughout the thesis development difficult process. I deeply acknowledge all your efforts;
- My former Molecular and Plant Breeding and Biotechnology Laboratories colleagues. Somehow, all of you contributed in a special way to the development of the present thesis;
- The ICAAM laboratories staff, without whose help, throughout the scientific work development and throughout the fun and party moments, the development of the present thesis would have been impossible;
- Virginia Sobral, a special person, with special feelings. Without whom, nothing of this would become reality;
encouraging words in the moments when the emotional strength vanished;
- My friends, without their help, I could never have achieved this goal;
- My brothers, Manuel and José, safety shoulders and examples of courage and strength;
- And finally, my mother, Maria, I deeply thank all your words, given in the good and bad moments. Somehow, they transformed me, and granted me the strength to undergo this complex task.
Exploração da oxidase alternativa como marcador funcional inovador para a embriogénese somática eficaz em Daucus carota L..
A embriogénese somática é o mais conhecido exemplo de reprogramação celular.
Daucus carota L. foi a primeira espécie onde a totipotência foi comprovada, através
da embriogénese somática. No entanto, mesmo em Daucus, considerada como modelo e facilmente induzível, existe uma influência genética na capacidade das células para serem reprogramadas. Neste sentido, a identificação de marcadores para a ‘fácil reprogramação’ pode ajudar ao desenvolvimento de marcadores funcionais para a eficiente propagação in vitro de genótipos recalcitrantes. Tendo como objetivo explorar esta questão e usando a oxidase alternativa como o gene candidato a marcador funcional, 28 genótipos de Daucus foram induzidos a realizar embriogénese somática indireta. Desses, 25 responderam ao processo, produzindo 139 linhas celulares. A eficiência embriogénica das linhas foi avaliada utilizando um método de fenotipagem em dois passos, concebido para a seleção dos fenótipos estáveis. Após o primeiro passo de fenotipagem, 41 linhas com eficiência embriogénica estável foram avaliadas e caracterizadas em relação à diversidade genética utilizando o método cTBP. Destas, 22 foram selecionados para o segundo passo de fenotipagem. Finalmente, 8 linhas celulares foram identificadas, como altamente estáveis para as eficiências embriogénicas extremas. Quatro eram muito eficientes ou muito eficientes / eficientes, e as restantes não-embriogénicas. Estas foram estabelecidas como a coleção base utilizada para uma avaliação mais aprofundada, tanto em relação à ploidia, como na investigação da oxidase alternativa. Foi detectada poliploidia em três das linhas celulares, independentemente da sua capacidade embriogénica. No entanto, considerando a mais recente informação, em que se refere a poliploidia como uma importante fonte de variabilidade para a tolerância ao stress geral, a sua utilização no presente estudo foi considerada. Os três genes da oxidase alternativa foram amplificados a partir da coleção base e explorados tendo em vista a identificação de posições polimórficas associadas com os fenótipos definidos. No total, 290 sequências foram amplificadas, das quais 47 foram identificadas como polimórficas. Destas, 11 foram identificadas como oxidase alternativa 1, 22 como 2a e 14 como 2b, sendo que a
permitiram a identificação de qualquer grupo de sequências associado a qualquer um dos fenótipos em estudo. No entanto, a procura por elementos de regulação realizada nas zonas codificantes em cada um dos genes, detetou três elementos nas sequências do gene 2b, que estavam associados maioritariamente a linhas embriogénicas. De igual forma, também os resultados do intrão 1 no gene 2b obtidos a partir do IMeter, apontam este como possível regulador das atividades do gene nessas linhas. Embora limitadas, tais observações apontam para o 2b, como sendo o gene envolvido na capacidade das células de Daucus para desenvolver embriões. No entanto, e dadas as limitações, tal indicação requer uma investigação mais aprofundada.
Palavras-Chave: Daucus; Embriogénese somática; Linha celular; Oxidase alternativa; Local polimórfico
The somatic embryogenesis (SE) process is the most prominent example of cell reprogramming. Daucus carota L. is the first species where totipotency through SE was proven. However, even in an easily inducible plant like Daucus, the reprogramming capacity of cells is largely influenced by their genotype. In this view, the identification of markers for ‘easy-reprogramming’, is expected to help develop functional markers for efficient biotechnological propagation of recalcitrant genotypes. Aiming to explore this issue using alternative oxidase (AOX) as the functional marker gene candidate, 28 Daucus accessions were induced to perform SE. Of those, 25 were responsive, producing 139 true-to-type cell lines. SE efficiencies were evaluated throughout a two-step phenotyping method planned for the selection of stable phenotypes. After the first phenotyping step, 41 cell lines with stable SE efficiency, were further analysed and characterized concerning genetic diversity, using the cTBP method. From these, 22 were selected for the second phenotyping step. Eight cell lines were identified at the end as highly stable for extreme SE efficiencies. Four were very efficient or very efficient / efficient, and the other four were non-embryogenic. Those were established as the basic collection used for further poidy assessment and molecular analyses of AOX. Polyploidy was detected in three of the cell lines, independently of their embryogenic capacity. However, attending the recent studies reporting polyploidy as an important source of variability for general stress tolerance, it was determined to proceed including them. The three AOXs were amplified from the collection and explored in view of the identification of polymorphic positions associated with the detected SE phenotype. In total, 290 sequences were amplified, from which, 47 were identified as polymorphic. From those, 11 were identified as AOX1, 22 as 2a and 14 as 2b, being AOX2a the main source of sequence variability. General phylogenetic analysis did not allow the identification of any group of sequences associated with any SE phenotype. Nevertheless, the search for regulatory elements performed for each gene coding region, detected three elements in the AOX2b sequences which were enriched in the embryogenic lines. In the same way, also IMEter results obtained from AOX2b intron 1 sequences, reveal these as likely candidates to regulate gene activities. Such observations, point to AOX2b, as a gene involved in the capacity of the Daucus cell's
required to better substantiate this conclusion.
Key-Words: Daucus; Somatic embryogenesis; Cell line; Alternative oxidase; Polymorphic site
- % - Percentage; - (NH4)2SO4 - Ammonium sulfate; - °C - Degrees Celsius; - µl - Microliter; - µM - Micromolar; - 1C - Content of DNA; - 2,4-D - 2,4-diclorophenoxyacetic acid; - 2n - Diploid number; - A - Adenine;
- A1 - HVA1 motif element from barley GCCGAC gene; - ABA - Abscisic acid;
- ABRE - ABA response element; - ADP - Adenosine diphosphate;
- AFLP - Amplified fragment length polymorphism;
- AOX - Alternative oxidase;
- ATP - Adenosine triphosphate; - AUS - Australia;
- B5 - Gamborg basal 5 medium;
- BBM - BABY BOOM;
- BPC1 - Basic pentacysteine 1;
- BLAST - Basic local alignment search tool; - bp - Base pair;
- C - Cytosine;
- C10H12N2NaFeO8 - Ethylenediaminetetraacetic acid ferric sodium salt;
- C12H17ClN4OS.HCl - Thiamine hydrochloride;
- C6H12O6 - Myo-inositol;
- C6H5NO2 - Nicotinic acid;
- C8H11NO3.HCl - Pyridoxine hydrochloride;
- Ca2+ - Calcium ion;
- CaCl2.2H2O - Calcium chloride dihydrate;
- cm - Centimeter;
- CuSO4 .5H2O - Copper (II) sulfate pentahydrate;
- CysI - Cysteine I;
- DAPI - 4',6-diamidino-2-phenylindole; - DArT - Diversity arrays technology; - Dc or D. c. - Daucus carota;
- DEU - Deutschland;
- DNA - Deoxyribonucleic acid; - DNK - Denmark;
- DSE - Direct SE; - E - Efficient;
- EcoRI - Escherichia coli restriction endonuclease enzyme 1; - Em - Early methionine;
- Em1b - Early methionine 1b;
- EPIC - Exon-primed intron-crossing; - F1 - F1 hybrid cultivar;
- FRA - France;
- G - G box (found in the section 3 and Appendix 9, do not confuse with guanine); - G - Guanine (found in the section 1 and Appendices 3, 7 and 9, do not confuse with G box);
- g/l - Gram per liter; - GA - Gibberellic acid; - GA5 - GA motif 5 element; - GBR - Great Britain; - gDNA - Genomic DNA; - h - Hour;
- H+ - Oxidized hydrogen; - H2O2 - Hydrogen peroxide;
- H3BO3 - Boric acid;
- HRIGRU - Horticulture Research International - Genetic Resources Unit; - HSP - Heat shock protein;
- HUN - Hungary;
- I - Inefficient;
- InDels - Insertions and deletions;
- IPK - Institute of Plant Genetics and Crop Plant Research; - IPTG - Isopropyl β-D-1-thiogalactopyranoside;
- ISE - Indirect SE; - ISR - Israel; - ITA - Italy;
- JBUL - Lisbon University Botanical Garden;
- JIM8 - John Innes Monoclonal Antibody 8;
- JKI - Julius Kühn - Institut - Federal Research Centre for Cultivated Plants; - JPN - Japan;
- kb - kilobase;
- kg/cm2 - Kilograms per square centimeter; - KI - Potassium iodide;
- KNO3 - Potassium nitrate;
- l - Liter;
- L - Long AOX2a type; - LB - Luria Bertani;
- LEA - Late embryogenesis abundant proteins;
- LEC - LEAFY COTYLEDON;
- M - Molarity;
- MAFFT - Multiple alignment using fast fourier transform; - MAR - Morocco;
- Mbp - Mega base pairs;
- mg/ml - Milligrams per milliliter;
- MgSO4.7H2O - Magnesium sulfate heptahydrate;
- Mha - Mega hectare; - ml - Milliliters;
- mm - Milimeters; - mM - Millimolar;
- MnSO4.H2O - Manganese (II) sulfate monohydrate;
- MSA - Mitosis-specific activator; - mTP - Mitochondrial targeting peptide;
- NADP - Nicotinamide adenine dinucleotide phosphate; - NaH2PO4 .2H2O - Sodium dihydrogen phosphate;
- NCBI - National center for biotechnology information; - NDH - Non-phosphorylating NAD(P)H dehyidrogenase; - NE - Non-embryogenic;
- ng/ml - Nanogram per milliliter; - ng/μl - Nanogram per microliter; - NGB - Nordic Gene Bank; - NLD - Netherlands;
- nm - Nanometers;
- nsSNP - Non-synonymous SNP; - Ø - Diameter;
- O - Oxygen;
- OP - Open pollinated cultivar; - ORF - Open reading frame;
- PCR - Polymerase chain reaction; - pg - Picogram;
- PGR - Plant growth regulator; - pH - Power of hydrogen; - Pi - Inorganic phosphorus;
- POP - Population;
- PPi - Inorganic pyrophosphatase;
- PRT - Portugal;
- psi - Pound per square inch;
- PSLUR - Plant Science Laboratories, The University of Reading; - Q - Ubiquinone;
- RAPD - Random Amplified Polymorphism DNA; - RFLP - Restriction fragment length polymorphism; - RNA - Ribonucleic acid;
- S - Short AOX2a type; - SA - Salicylic acid;
- SE - Somatic embryogenesis;
- SNP - Single nucleotide polymorphism; - SPP - Single plant progeny;
- sSNP - Synonymous SNP; - SSR - Simple sequence repeat; - Subsp. - Subspecies;
- T - Thymine;
- T0 - Inoculation time point;
- T15 - Observation and documentation point after 15 days; - T30- Observation and documentation point after 30 days; - T45 - Observation and documentation point after 45 days; - T60 - Observation and documentation point after 15 days; - TP - Targeting peptide;
- TRX h - Thioredoxin h; - TUR - Turkey;
- UCP - Uncoupling protein;
- UPGMA - Unweighted pair group method with arithmetic average; - URY - Uruguay;
- UTR - Untranslated region; - UV - Ultraviolet; - V - Volt; - v - Volume; - VE
-
Very efficient; - VI - Very inefficient; - W - W box element; - w - Weight;- X-Gal - 5-Bromo-4-chloro-3-indolyl β-D-galactopyranoside; - ZnSO4.7H2O - Zinc sulfate heptahydrate;
- λDNA - Lambda DNA;
Resumo XI
Abstract XIII
Abbreviations, acronyms, symbols and molecular formulas XV
Index XXI
Index of figures XXV
Index of tables XXXIII
1 - State of the art 1
1.1 - Daucus carota L.: Classification, botany and agro-biotechnological
relevance 3
1.2 - Somatic embryogenesis: Changed fate under stress 7 1.3 - Alternative oxidase: Recycling pump and much more 14 1.4 - Exploring Daucus AOX polymorphisms in the view of functional marker
development 18
1.5 - Goals 24
2 - Plant material and methods 25
2.1 - Plant material 27
2.2 - Methods 29
2.2.3 - Cell lines genetic diversity 33
2.2.4 - Cell lines ploidy 34
2.2.5 - Amplification of AOX1, 2a and 2b in cell lines 34
2.2.6 - Sequencing and bioinformatic analyses 36
2.2.7 - In silico analysis of AOX: Functional sites, subcellular localization and
regulatory elements 37
3 - Results 41
3.1 - Mericarp germination, calli development and cell line establishment 43
3.2 - Phenotyping cell line SE efficiency 46
3.2.1 - First phenotyping set for SE efficiency 47
3.2.2 - Cell lines genetic diversity 49
3.2.3 - Second phenotyping set for SE efficiency 53
3.2.4 - Cell lines selection for extreme embryogenic behavior 55
3.2.5 - Cell lines ploidy determination 58
3.3 - AOX genes in the selected cell lines 59
3.3.1 - Amplified AOX1 characterization 60
3.3.2 - Amplified AOX2a characterization 61
3.4.1 - Analysis of AOX coding region 65
3.4.2 - Analysis of AOX non-coding region 74
4 - Discussion 85 5 - Conclusions 97 6 - Bibliographic references 101 Appendices 149 Appendix 1 151 Appendix 2 155 Appendix 3 157 Appendix 4 161 Appendix 5 165 Appendix 6 169 Appendix 7 171 Appendix 8 177 Appendix 9 179
Figure 1.1 - Developmental stages of somatic embryos. Adapted from Frederico
et al. (2009a). 8
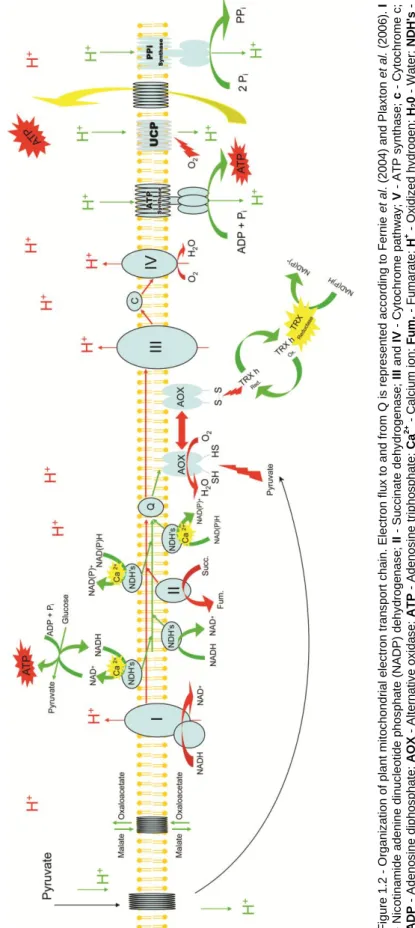
Figure 1.2 - Organization of plant mitochondrial electron transport chain. Electron flux to and from Q is represented according to Fernie et al. (2004) and Plaxton et al. (2006). I - Nicotinamide adenine dinucleotide phosphate (NADP) dehydrogenase; II - Succinate dehydrogenase; III and IV - Cytochrome pathway; V - ATP synthase; c - Cytochrome c; ADP - Adenosine diphosphate; AOX - Alternative oxidase; ATP - Adenosine triphosphate; Ca2+ - Calcium ion; Fum. - Fumarate; H+ - Oxidized hydrogen; H20 - Water; NDH's
- Non-phosphorylating NAD(P)H dehyidrogenases; Pi - Inorganic
phosphorus; PPi - Inorganic pyrophosphatase; PPI - Inorganic
pyrophosphatase synthase; Q - Ubiquinone; S and SH - Reduced and oxidized disulfide bonds; Succ. - Succinate; TRX h - Thioredoxin h; UCP -
Uncoupling protein. 15
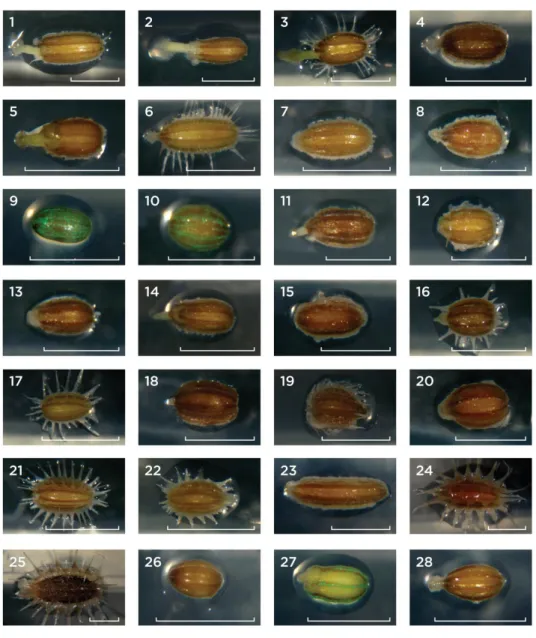
Figure 2.1 - Daucus mericarps used as initial explants to induce calli development during the ISE approach (for detailed description and accession
numbers see Table 2.1). Bar - 4 mm. 27
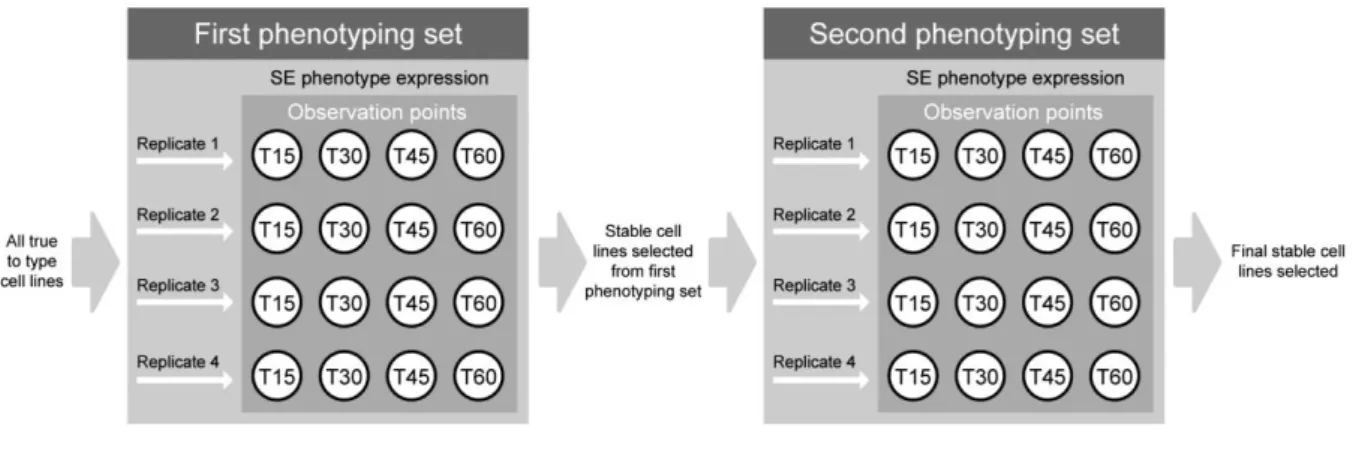
Figure 2.2 - Schematic representation of the experimental design for both phenotyping sets performed to select Daucus cell lines with stable SE efficiency phenotype. Replicates - 1 to 4 were performed asynchronously in time to improve SE phenotype stability selection over time; T15, T30, T45
and T60 - Observation and documentation time points, corresponding to 15th, 30th, 45th and 60th day after SE expression start. 31
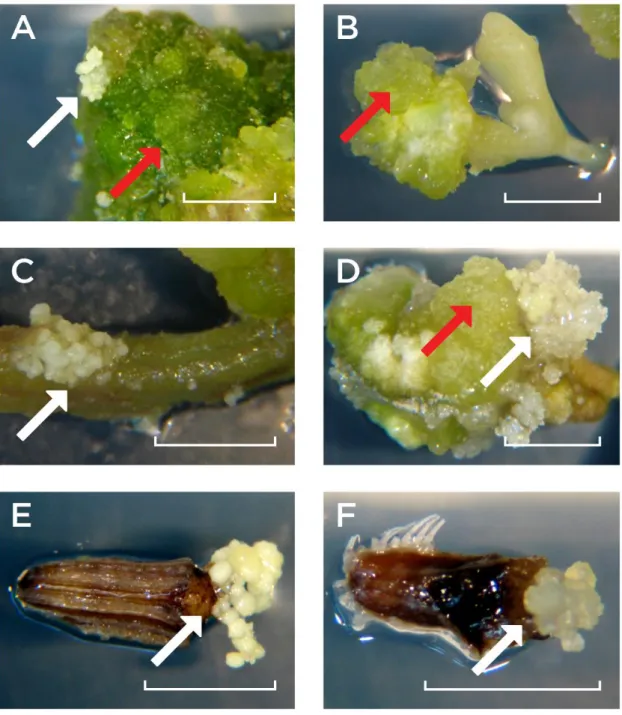
Figure 3.1 - Calli development on seedling tissues (A, B, C and D) and mericarp internal tissues (E and F) during the induction phase. Arrows - Calli with typical embryogenic (white) or non-embryogenic (red) characteristics in
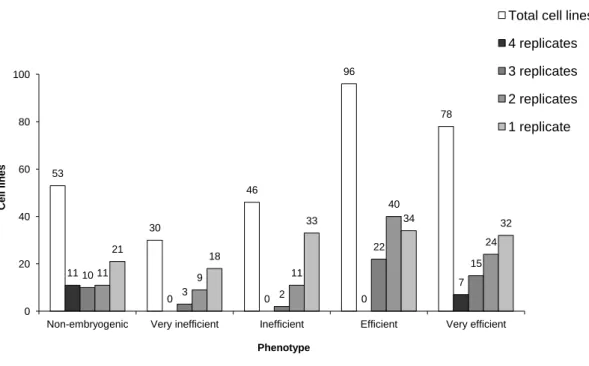
obtained from the first phenotyping experiment set. The experiment (four replicates) was carried out on gelled medium B5– during a 60 day period and
evaluation and documentation were performed at four different time points (T15, T30, T45 and T60) after SE induction. The original data used for generating the graph are provided in Appendix 1. Grey bars - Total number of cell lines showing an embryogenic phenotype in four (dark grey), three (mid-dark-grey), two (mid-light-grey) or one (light grey) replicates; White
bars - Total number of cell lines detected per embryogenic phenotype,
independently of the number of replicates. 48
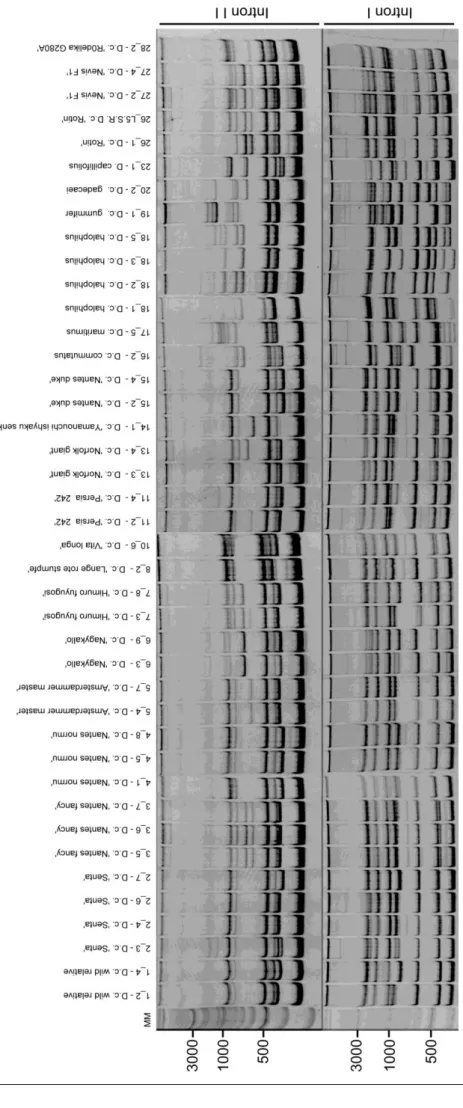
Figure 3.3 - cTBP ILP patterns characterizing the 41 cell lines evaluated. MM - Molecular marker - GeneRuler™ DNA Ladder Mix (100 - 10000 bp). 51
Figure 3.4 - Dendrogram representing the genetic distance of the 41 cell lines selected at the end of the first phenotyping set assessed using the cTBP method. The dendrogram was obtained in the FreeTree software (Hampl et
al., 2001) and is drawn to scale, using the UPGMA method (Sokal and
Michener, 1958; Murtagh, 1984). Bootstrapping (Efron, 1979) was performed with 1000 replicates. Arrows - Cell lines selected for the second phenotyping
set; D. c. - Daucus carota; subsp. - Subspecies. 52
Figure 3.5 - Graphical representation of cell lines SE efficiency phenotypes obtained from the second phenotyping experiment set. The experiment (four replicates) was carried out on gelled medium B5– during a 60 day period and
evaluation and documentation were performed at four different time points (T15, T30, T45 and T60) after SE induction. The original data used for generating the graph are provided in Appendix 1. Grey bars - Total number of cell lines showing an embryogenic phenotype in four (dark grey), three (mid-dark-grey), two (mid-light-grey) and one (light grey) replicates; White
bars - Total number of cell lines detected per embryogenic phenotype,
selected at the end of both SE phenotyping experiment sets. Selection was performed using data presented in Appendix 1 and considering the qualitative scale presented in Appendix 2. For each cell line selected, representative images were used to illustrate the number of embryonic structures at the four observation points (T15, T30, T45 and T60). Representative images were also used to illustrate inoculation (T0) and the overview at the end of the experiment. Cell line - Very efficient (VE): 8_2 - D.
c. ‘Lange rote stumpfe 1’ and 20_2 - D. c. gadecaei; Very efficient (VE) /
Efficient (E): 26_L5.S.R. - D. c. ’Rotin’ and 27_2 - D. c. ‘Nevis F1’; Bar - T0,
T15, T30, T45 and T60 - 4 mm and Overview - 1 cm. 56
Figure 3.7 - Cell lines with highly stable non-embryogenic phenotype, selected at the end of both SE phenotyping sets. Selection was performed using data presented in Appendix 1 and considering the qualitative scale presented in Appendix 2. For each cell line selected, representative images were used to illustrate embryonic structures at the four observation points (T15, T30, T45 and T60). Representative images were also used to illustrate inoculation (T0) and the overview at the end of the experiment. Cell line - 2_4 - D. c. ‘Senta’, 4_5 - D. c. ‘Nantes normu’, 18_1 - D. c. halophilus, 19_1 - D. c. gummifer;
Bar - T0, T15, T30, T45 and T60 - 4 mm and Overview - 1 cm. 57
Figure 3.8 - Clustering analyses of the 11 AOX1 nucleotide sequences identified in the 8 selected cell lines with extreme embryogenic behaviors. The clustering analyses were inferred using the Neighbor-Joining method (Saitou and Nei, 1987). The bootstrap consensus tree inferred from 1000 replicates (Felsenstein, 1985) is taken to represent the analyses. Branches corresponding to partitions reproduced in less than 50 % bootstrap replicates are collapsed. The percentage of replicate trees in which the associated taxa clustered together in the bootstrap test (1000 replicates) are shown above the branches. The tree is drawn to scale, with branch lengths in the same units as those of the analyses used to infer the phylogenetic tree. The clustering analyses distances were computed using the Maximum Composite Likelihood method (Tamura et al., 2004) and are in the units of the number of
sequence pair. There were a total of 1949 positions in the final dataset. Clustering analyses were conducted in MEGA5 (Tamura et al., 2011). Cell
line - 2_4 - D. c. ‘Senta’; 4_5 - D. c. ‘Nantes normu’; 8_2 - D. c. ‘Lange rote
stumpfe‘; 18_1 - D. c. halophilus; 19_1 - D. c. gummifer; 20_2 - D. c.
gadecaei; 26_L5.S.R. - D. c. ’Rotin’; 27_2 - D. c. ‘Nevis F1’. 60
Figure 3.9 - Clustering analyses of the 22 AOX2a nucleotide sequences identified in the 8 selected cell lines with extreme embryogenic behaviors. The clustering analyses were inferred using the Neighbor-Joining method (Saitou and Nei, 1987). The bootstrap consensus tree inferred from 1000 replicates (Felsenstein, 1985) is taken to represent the analyses. Branches corresponding to partitions reproduced in less than 50 % bootstrap replicates are collapsed. The percentage of replicate trees in which the associated taxa clustered together in the bootstrap test (1000 replicates) are shown next to the branches. The tree is drawn to scale, with branch lengths in the same units as those of the analyses used to infer the phylogenetic tree. The clustering analyses distances were computed using the Maximum Composite Likelihood method (Tamura et al., 2004) and are in the units of the number of base substitutions per site. All ambiguous positions were removed for each sequence pair. There were a total of 5385 positions in the final dataset. Clustering analyses were conducted in MEGA5 (Tamura et al., 2011). Cell
line - 2_4 - D. c. ‘Senta’; 4_5 - D. c. ‘Nantes normu’; 8_2 - D. c. ‘Lange rote
stumpfe‘; 18_1 - D. c. halophilus; 19_1 - D. c. gummifer; 20_2 - D. c.
gadecaei; 26_L5.S.R. - D. c. ’Rotin’; 27_2 - D. c. ‘Nevis F1’. 62
Figure 3.10 - Clustering analyses of the 14 AOX2b nucleotide sequences identified in the 8 selected cell lines with extreme embryogenic behaviors. The clustering analyses were inferred using the Neighbor-Joining method (Saitou and Nei, 1987). The bootstrap consensus tree inferred from 1000 replicates (Felsenstein, 1985) is taken to represent the analyses. Branches corresponding to partitions reproduced in less than 50 % bootstrap replicates are collapsed. The percentage of replicate trees in which the associated taxa clustered together in the bootstrap test (1000 replicates) are shown above
units as those of the analyses used to infer the phylogenetic tree. The clustering analysis distances were computed using the Maximum Composite Likelihood method (Tamura et al., 2004) and are in the units of the number of base substitutions per site. All ambiguous positions were removed for each sequence pair. There were a total of 2423 positions in the final dataset. Clustering analyses were conducted in MEGA5 (Tamura et al., 2011). Cell
line - 2_4 - D. c. ‘Senta’; 4_5 - D. c. ‘Nantes normu’; 8_2 - D. c. ‘Lange rote
stumpfe‘; 18_1 - D. c. halophilus; 19_1 - D. c. gummifer; 20_2 - D. c.
gadecaei; 26_L5.S.R. - D. c. ’Rotin’; 27_2 - D. c. ‘Nevis F1’. 64
Figure 3.11 - Clustering analyses of 47 AOX1, 2a and 2b open reading frames nucleotide sequences identified in the 8 selected cell lines with extreme embryogenic behaviors. The clustering analyses was inferred using the Neighbor-Joining method (Saitou and Nei, 1987). The bootstrap consensus tree inferred from 1000 replicates (Felsenstein,1985) is taken to represent the analyses. Branches corresponding to partitions reproduced in less than 50 % bootstrap replicates are collapsed. The percentage of replicate trees in which the associated taxa clustered together in the bootstrap test (1000 replicates) are shown next to the branches. The tree is drawn to scale, with branch lengths in the same units as those of the analyses used to infer the phylogenetic tree. The clustering analyses distances were computed using the Maximum Composite Likelihood method (Tamura et al., 2004) and are in the units of the number of base substitutions per site. All ambiguous positions were removed for each sequence pair. There were a total of 1020 positions in the final dataset. Clustering analyses were conducted in MEGA5 (Tamura
et al., 2011). Cell line - 2_4 - D. c. ‘Senta’; 4_5 - D. c. ‘Nantes normu’; 8_2 -
D. c. ‘Lange rote stumpfe‘; 18_1 - D. c. halophilus; 19_1 - D. c. gummifer;
20_2 - D. c. gadecaei; 26_L5.S.R. - D. c. ’Rotin’; 27_2 - D. c. ‘Nevis F1’. 66
Figure 3.12 - Clustering analyses of 47 AOX1, 2a and 2b amino acid sequences identified in the 8 selected cell lines with extreme embryogenic behaviors. The clustering analyses were inferred using the Neighbor-Joining method (Saitou and Nei, 1987). The bootstrap consensus tree inferred from 1000
corresponding to partitions reproduced in less than 50 % bootstrap replicates are collapsed. The percentage of replicate trees in which the associated taxa clustered together in the bootstrap test (1000 replicates) are shown next to the branches. The tree is drawn to scale, with branch lengths in the same units as those of the analyses used to infer the phylogenetic tree. The clustering analyses were computed using the Poisson correction method (Zuckerkandl and Pauling, 1965) and are in the units of the number of amino acid substitutions per site. All ambiguous positions were removed for each sequence pair. There were a total of 346 positions in the final dataset. Clustering analyses were conducted in MEGA5 (Tamura et al., 2011). Cell
line - 2_4 - D. c. ‘Senta’; 4_5 - D. c. ‘Nantes normu’; 8_2 - D. c. ‘Lange rote
stumpfe‘; 18_1 - D. c. halophilus; 19_1 - D. c. gummifer; 20_2 - D. c.
gadecaei; 26_L5.S.R. - D. c. ’Rotin’; 27_2 - D. c. ‘Nevis F1’. 67
Figure 3.13 - Clustering analyses of the intron 1 from the 47 AOX1, 2a and 2b nucleotide sequences identified in the 8 cell lines. The clustering analyses were performed using the Neighbor-Joining method (Saitou and Nei, 1987). The bootstrap consensus tree inferred from 1000 replicates (Felsenstein, 1985) is taken to represent the analyses. Branches corresponding to partitions reproduced in less than 50 % bootstrap replicates are collapsed. The percentage of replicate trees in which the associated taxa clustered together in the bootstrap test (1000 replicates) are shown next to the branches. The tree is drawn to scale, with branch lengths in the same units as those of the analyses used to infer the phylogenetic tree. The clustering analyses distances were computed using the Maximum Composite Likelihood method (Tamura et al., 2004) and are in the units of the number of base substitutions per site. All ambiguous positions were removed for each sequence pair. There were a total of 2476 positions in the final dataset. Clustering analyses were conducted in MEGA5 (Tamura et al., 2011). Cell
line - 2_4 - D. c. ‘Senta’; 4_5 - D. c. ‘Nantes normu’; 8_2 - D. c. ‘Lange rote
stumpfe‘; 18_1 - D. c. halophilus; 19_1 - D. c. gummifer; 20_2 - D. c.
nucleotide sequences identified in the 8 cell lines. The clustering analyses were performed using the Neighbor-Joining method (Saitou and Nei, 1987). The bootstrap consensus tree inferred from 1000 replicates is taken to represent the analyses (Felsenstein, 1985). Branches corresponding to partitions reproduced in less than 50 % bootstrap replicates are collapsed. The percentage of replicate trees in which the associated taxa clustered together in the bootstrap test (1000 replicates) are shown next to the branches. The tree is drawn to scale, with branch lengths in the same units as those of the analyses used to infer the phylogenetic tree. The clustering analyses distances were computed using the Maximum Composite Likelihood method (Tamura et al., 2004) and are in the units of the number of base substitutions per site. All ambiguous positions were removed for each sequence pair. There were a total of 960 positions in the final dataset. Clustering analyses were conducted in MEGA5 (Tamura et al., 2011). Cell
line - 2_4 - D. c. ‘Senta’; 4_5 - D. c. ‘Nantes normu’; 8_2 - D. c. ‘Lange rote
stumpfe‘; 18_1 - D. c. halophilus; 19_1 - D. c. gummifer; 20_2 - D. c.
gadecaei; 26_L5.S.R. - D. c. ’Rotin’; 27_2 - D. c. ‘Nevis F1’. 76
Figure 3.15 - Clustering analyses of the intron 3 from the 39 AOX2a and 2b nucleotide sequences identified in the 8 cell lines. The clustering analyses were performed using the Neighbor-Joining method (Saitou and Nei, 1987). The bootstrap consensus tree inferred from 1000 replicates is taken to represent the analyses (Felsenstein, 1985). Branches corresponding to partitions reproduced in less than 50 % bootstrap replicates are collapsed. The percentage of replicate trees in which the associated taxa clustered together in the bootstrap test (1000 replicates) are shown next to the branches. The tree is drawn to scale, with branch lengths in the same units as those of the analyses used to infer the phylogenetic tree. The clustering analyses distances were computed using the Maximum Composite Likelihood method (Tamura et al., 2004) and are in the units of the number of base substitutions per site. All ambiguous positions were removed for each sequence pair. There were a total of 1318 positions in the final dataset. Clustering analyses were conducted in MEGA5 (Tamura et al., 2011). Cell
stumpfe‘; 18_1 - D. c. halophilus; 19_1 - D. c. gummifer; 20_2 - D. c.
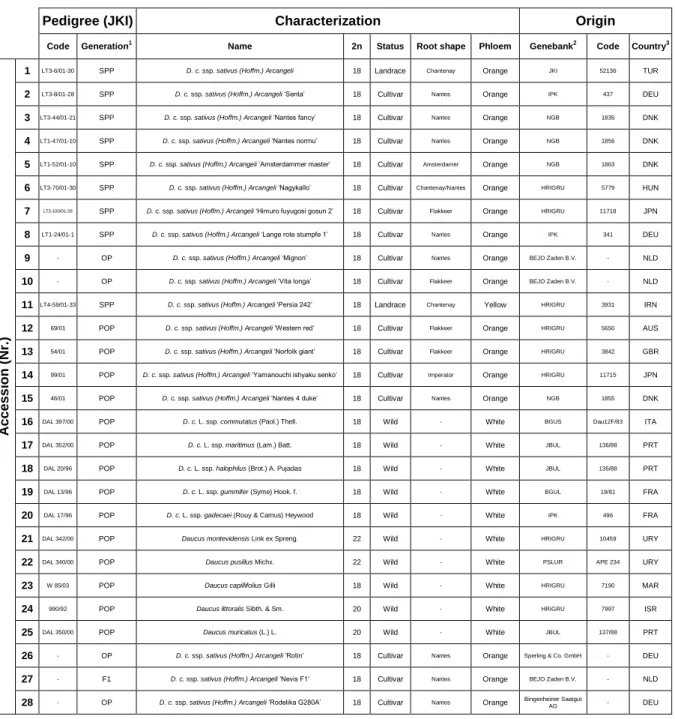
Table 2.1 - Description and characterization of the 28 Daucus accessions used to induce calli development during the ISE approach. D. c. - Daucus carota;
Nr. - Accession number. 28
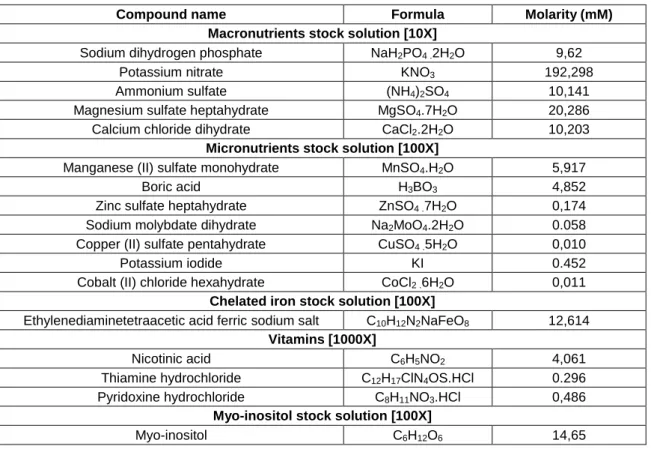
Table 2.2 - List of compounds and their concentrations required to prepare modified B5 stock solutions. Molarity refers to one liter of stock solution. 29
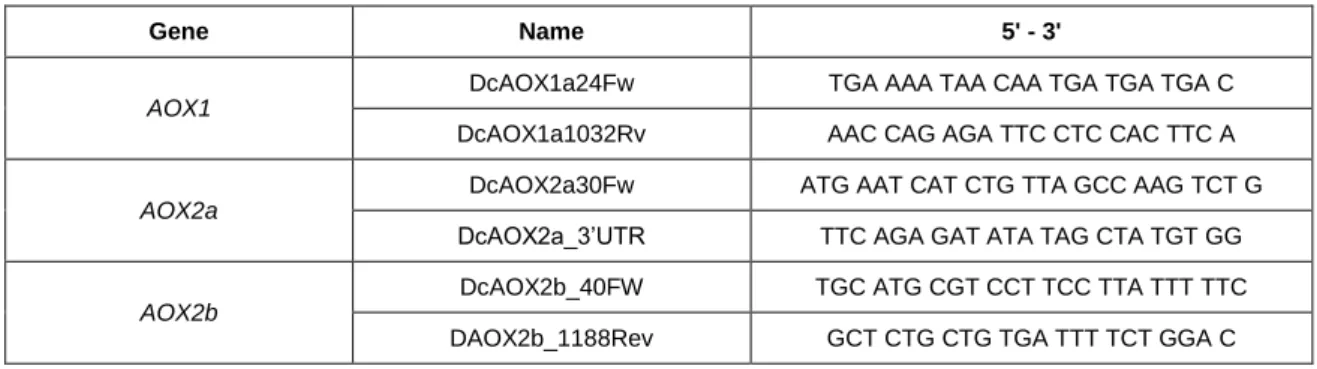
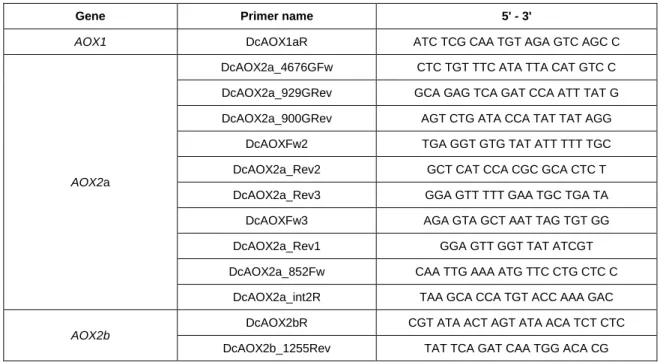
Table 2.3 - Characterization of primers used for Daucus AOX genes amplification. Dc - Daucus carota; Fw, FW - Forward; Number - Primer position in the sequence; Rv, Rev - Reverse; UTR - Untranslated region. 35
Table 2.4 - Characterization of primers used for AOX genes sequencing. Dc -
Daucus carota; Fw - Forward; G - Genomic; int - internal; Number - Primer
position in the sequence; R, Rev - Reverse. 36
Table 3.1 - Global overview of the experiments performed to induce calli development from the 28 Daucus accessions evaluated (see Table 2.1). Data represents the number (Nr.) of mericarps inoculated per accession, the number of germinated mericarps and the germination percentage (%). Also shown are the number of true-to-type cell lines isolated by genotype and the number of cell lines used per SE phenotyping set (1st and 2nd). The final number of cell lines selected is also indicated (see section 3.2). D. c. -
Daucus carota; * - Mericarps germinated after 30 days. 44
Table 3.2 - Results from flow cytometry analyses performed using the eight selected cell lines considering both phenotyping sets. The presented results concerns the relative DNA amount determined for each control leaf (2n) and related cell line, cell line ploidy level and percentage of cells present in each line with double amount of DNA (cells in the G2/M phase transition). Original peak data used for generation of this table is provided in Appendix 6. Cell
gadecaei; 26_L5.S.R. - D. c. ’Rotin’; 27_2 - D. c. ‘Nevis F1’. 58
Table 3.3 - Cell lines selected for extreme embryogenic efficiency phenotypes (VE, VE/E and NE). Cell line - 2_4 - D. c. ‘Senta’; 4_5 - D. c. ‘Nantes normu’; 8_2 - D. c. ‘Lange rote stumpfe‘; 18_1 - D. c. halophilus; 19_1 - D. c.
gummifer; 20_2 - D. c. gadecaei; 26_L5.S.R. - D. c. ’Rotin’; 27_2 - D. c.
‘Nevis F1’. 59
Table 3.4 - Distribution of mutations (nsSNPs, sSNPs and InDels) across
AOX1, 2a and 2b exons. Full data used to construct the table are provided in
the Appendix 7. * - AOX1 does not have exon 4. 68
Table 3.5 - Enrichment of putative regulatory elements in the identified AOX1,
2a and 2b ORF nucleotide sequences from the eight selected cell lines
assessed using Nsite-PL and ScanWM-P software. bp - Base pair; Cell line - 2_4 - D. c. ‘Senta’; 4_5 - D. c. ‘Nantes normu’; 8_2 - D. c. ‘Lange rote stumpfe‘; 18_1 - D. c. halophilus; 19_1 - D. c. gummifer; 20_2 - D. c.
gadecaei; 26_L5.S.R. - D. c. ’Rotin’; 27_2 - D. c. ‘Nevis F1’; Clone - Code
identifying the bacterial clone and from which the sequence code was attributed; Grey cells - Sequences with different levels of identified regulatory elements/weight matrixes/motifs enrichment; Nr. - Number. 70
Table 3.6 - Subcellular localization of the identified AOX amino acid sequences according to the results obtained on the TargetP 1.1 Server. aa - Amino acid;
Cell line - 2_4 - D. c. ‘Senta’; 4_5 - D. c. ‘Nantes normu’; 8_2 - D. c. ‘Lange
rote stumpfe‘; 18_1 - D. c. halophilus; 19_1 - D. c. gummifer; 20_2 - D. c.
gadecaei; 26_L5.S.R. - D. c. ’Rotin’; 27_2 - D. c. ‘Nevis F1’; Clone - Code
identifying the bacterial clone and from which the sequence code was attributed; mTP - Mitochondrial targeting peptide score; TP - Targeting
peptide pre-sequence length. 72
Table 3.7 - Putative functional residue sites of the aligned AOXs amino acid sequences identified using the SH method. The positions indicated in the
AOX1 subgroup.; B - AOX2 subgroup; The ‘Consensus’ columns give all residue types present in subgroups A and B, respectively, in order of decreasing frequency and in lowercase when the frequency is less than half of the highest; Position - Residue position in the alignment; Rank - number
of neighboring sites below the cutoff. 73
Table 3.8 - Enrichment of putative regulatory elements in the identified AOX1,
2a and 2b highly polymorphic intron 1 from the 8 selected cell lines assessed
using Nsite-PL and ScanWM-P software. Cell line - 2_4 - D. c. ‘Senta’; 4_5 -
D. c. ‘Nantes normu’; 8_2 - D. c. ‘Lange rote stumpfe‘; 18_1 - D. c.
halophilus; 19_1 - D. c. gummifer; 20_2 - D. c. gadecaei; 26_L5.S.R. - D. c.
’Rotin’; 27_2 - D. c. ‘Nevis F1’; Clone - Code identifying the bacterial clone and from which the sequence code was attributed; Grey cells - Sequences with different levels of identified regulatory elements/weight matrices/motifs
enrichment within accessions; Nr. - Number. 79
Table 3.9 - Assessment of mediated-enhancement by AOX1, 2a and 2b intron 1 sequences using IMEter V2.1 (see section 2.2.7). Cell line - 2_4 - D. c. ‘Senta’; 4_5 - D. c. ‘Nantes normu’; 8_2 - D. c. ‘Lange rote stumpfe‘; 18_1 -
D. c. halophilus; 19_1 - D. c. gummifer; 20_2 - D. c. gadecaei; 26_L5.S.R. -
D. c. ’Rotin’; 27_2 - D. c. ‘Nevis F1’; Clone - Code identifying the bacterial
clone and from which the sequence code was attributed; Grey cells -
1 - State of the art
1.1 - Daucus carota L.: Classification, botany and agro-biotechnological relevance
The species Daucus carota L. (D. c.) is a member of the Daucus genus, which belongs to the Apiaceae (Umbelliferae) family. In the last century the genus was described and revised several times (Heywood, 1968 and 1982; Sáenz-Laín, 1981). In addition, several molecular and morphological phylogenetic studies were performed (Lee and Downie, 1999 and 2000; Lee et al., 2001; Spalik and Downie, 2007; for a review see Grzebelus et al., 2011). These works revealed that the genus is not monophyletic as its inclusive branch of Daucinae (named Daucus senso lato clade) includes four subclades with only two of them traditionally placed in the genus. These are, namely: Daucus I and II subclades comprising in total, around 21 - 24 species (Spalik and Downie, 2007). The Daucus I subclade includes the wild ancestor of the cultivated Daucus with all of its subspecies, as well as the several Mediterranean members and some species that were traditionally placed in other genera. The Daucus II subclade comprises the remaining members of Daucus including its American and Australian representatives (Spalik and Downie, 2007).
All Daucus identified so far, are diploid out-crossing species, with a diploid value (2n) of 20 or 22 chromossomes being found in the majority of them (Iovene et al., 2008). Exceptions were found in the species D. carota, D. capillifolius, D. sahariensis and D.
syrticus, with a 2n value of 18 and for D. glochidiatus, the most divergent one, with
44 of 2n value (Imani et al., 2001; Iovene et al., 2008; Iovene et al., 2011). The haploid genome size of Daucus had been estimated at 473 Mbp (Arumuganathan and Earle, 1991; Bennett and Leitch, 1995), with a deoxyribonucleic acid (DNA) content value (1C), ranging from 1 to 4,7 pg, depending on the species (Bennett and Smitt, 1976; Grzebelus et al., 2011).
However, due to the referred polyphyly, the current classification system of Daucus is untenable (Vivek and Simon, 1999). Grzebelus et al. (2011) expressed the need for additional data from molecular and morphological markers in order to develop a more workable classification system. In this view, the works developed by Shim and
Jørgensen (2000), using amplified fragment length polymorphism (AFLP), or Bradeen et al. (2002), using several molecular markers and the ones developed by Baranski et al. (2012), using simple sequence repeat (SSR) and Iorizzo et al. (2013) using single nucleotide polymorphism (SNP) diversity, represent a step forward in the elucidation of Daucus domestication and breeding history, which still remains mostly unclear. More recently, Grzebelus et al. (2014), developed a diversity arrays technology (DArT) platform for wild and cultivated Daucus and used it to investigate genetic diversity and to develop a saturated genetic linkage map using 94 cultivated and 65 wild accessions. As a result, accessions were attributed to three separate groups (wild, Eastern cultivated and Western cultivated) and 27 markers were identified by showing signatures for selection. They showed a directional shift in frequency from the wild to the cultivated, likely reflecting diversifying selection imposed in the course of domestication. This provides a powerful background for further research on the history of Daucus domestication.
Daucus members are usually herbaceous biennials, rarely annuals, growing from
slender to very stout taproots (IPGRI, 1998). The leaves are pinnatisect, the inflorescence is a compound umbel and the fruit is a schizocarp splitting into two one-seeded mericarps. The fruit is oblong to ovoid, dorsally compressed, with prominent longitudinal projections. Primary ribs are present on each mericarp, situated above vascular bundles, as well as two secondary ribs, situated between the primary ones. Primary ribs are covered with two to four rows of unbranched, semi-erect or spreading hairs. On each secondary rib there is a row of spines, which can be glochidiate or simple at the apex (Grzebelus et al., 2011).
The cultivated Daucus is reputed to have its primary origins in Afghanistan and Central Asia, with the Himalayan-Hindu Kush region being the origin of Eastern cultivars and the Anatolian region of Asia Minor being the center of diversity for Western ones (Soufflet-Freslon et al., 2013). D. carota, including wild and cultivated forms, has wide phenotypic and molecular variation (Hauser and Bjorn, 2001; Hauser, 2002). Early selection probably focused on biggest, smooth storage and a reduced tendency for early flowering (Stolarczyky and Janick, 2011). The broad variation in cultivated Daucus suggests that widespread introgression of wild germplasm has likely occurred into cultivated forms (Simon, 2000; Hauser and Bjorn,
2001; Hauser, 2002). After domestication and dissemination throughout Eurasia, the next known major change on cultivated Daucus was the shift in storage root color from yellow and purple to orange in the late 16th and early 17th centuries (Banga, 1957a, 1957b and 1963; Stein and Nothanagel, 1995; Hauser et al., 2004; Umehara
et al., 2005; Rong et al., 2010).
The development of Daucus cultivars through traditional breeding methods has been a major effort since the 1980's and resulted in significant improvements concerning yield and quality (Simon, 1984; Ammirato, 1986; Peterson and Simon, 1986). The species broad germplasm base has been used regularly in modern Daucus breeding. From there, important agronomic traits were introduced into the modern Daucus cultivars, such as cytoplasmic male sterility, elevated carotene content and resistance to several diseases and pests (Simon, 2000). According to Punja et al. (2007), root shape, length and color, smooth skin, flavor, early maturity, and resistance to various diseases were and continue to be agronomic traits with high priorities in Daucus breeding. However, most of these improvements require long-term efforts due to the multigenic control of these traits (Rong et al., 2010). Currently, much of Daucus production comprises F1 hybrids (Luby and Goldman, 2016),
produced using a system of cytoplasmic male sterility that makes crossing of inbred lines achievable and economically viable (Allard, 1960; Peterson and Simon, 1986; St. Pierre and Bayer, 1991; Stein and Nothanagel, 1995, Simon, 2000). At present, no transgenic Daucus cultivars are available in the market (Punja et al., 2007). In spite of this, the recovery of transgenic Daucus plants has already been reported from several laboratories (Takaichi and Oeda, 2000; Peters et al., 2011; Ahn et al., 2012).
Members of the Daucus genus are the most widely grown crops of the family
Apiaceae, cultivated on 1,2 Mha globally (FAO, 2011). Daucus cultivars are widely
grown worldwide for their edible taproots (Punja et al., 2007). Daucus taproots are marketed as fresh whole or baby size, and are used after processing in canned foods, soups or juice, and in frozen products. Nutritionally, Daucus are highly rich in β-carotene (provitamin A), as well as vitamin B1 and C, and are a good source of
In the biotechnological field, the species gained its honor place with the pioneering works of Steward et al. (1958) and Reinert (1958), where Daucus was used to demonstrate totipotency of plant cells. Currently, Daucus is used as a model species for tissue culture, and extensive work has been conducted in several areas, including somatic embryogenesis (SE), bioreactor scale-up of suspension cultures, protoplast culture, somaclonal variation and pharmacological research (Ammirato, 1986 and 1987; Zimmerman, 1993; Komamine et al., 2005; Shaaltiel et al., 2007; Peters et al., 2011; Rosales-Mendoza and Tello-Olea, 2015).
1.2 - Somatic embryogenesis: Changing fate under stress
The most extreme example of flexibility in plant development is the capacity of several cell types, in addition to the zygote, to initiate embryonic development (Veit, 2006; Sablowski, 2007; Capron et al., 2009). In vitro or in vivo SE represents this remarkable developmental process, organized in a sequence of stereotypical morphological transformations, enabling non-zygotic plant cells (somatic cells), including haploid cells, to differentiate into somatic embryos and regenerate complete plants, bypassing the fusion of gametes (Rose et al., 2010; Nic-Can et al., 2015). SE follows a unique development pathway, during which cells have to dedifferentiate, activate cell division, and reprogram their physiology, metabolism and gene expression patterns (Yang and Zhang, 2010; Joshi and Kumar, 2013) and represents the maximum expression of cell totipotency (Gutiérrez-Mora et al., 2012). Likewise their zygotic counterpart, somatic embryos pass through four general sequential developmental stages, namely: globular, heart, torpedo and cotyledonary (Figure 1.1) (Yeung, 1995; Dodeman et al., 1997). SE excels beyond other forms of regeneration such as organogenesis in that within a single step it produces a vascular system, functional meristem and a root/shoot axis (Bassuner et al., 2007). Somatic embryos can be differentiated either directly, from the explants without an intervening callus phase, or indirectly, after a callus phase, referred to as direct SE (DSE) and indirect SE (ISE), respectively (Sharp et al., 1980; Quiroz-Figueiroa et al., 2006). Uni- or multicellular pathways have been identified as the origin of somatic embryos in both, ISE or DSE (Quiroz-Figueiroa et al., 2006).
SE has been a very valuable tool for achieving a wide range of purposes, from the basic biochemical, physiological and morphological studies, to the development of technologies with a high degree of practical applications. The investigation of initial events of plant embryogenesis (Zimmerman, 1993; Yu et al., 2006), the mass production of plants (Bonga et al., 2010; Ji et al., 2011; Nic-Can et al., 2015), synthetic seeds (Kumar, 2000; Reddy et al., 2012), polyploids production (Lee et al., 2009a; Sun et al., 2011; Delporte et al., 2012; Koniecznz et al., 2012), protoplast source (Jiang et al., 2013), gene transfer for crop improvement (Santos et al., 2002; Kamle et al., 2011; Delporte et al., 2013), secondary metabolite production (Vanisree
screening tests (Chen and Punja, 2002; Pérez-Clemente and Gómez-Cadenas, 2012), are a few technological examples where SE has been widely applied.
re 1 .1 D e v e lop men ta l s ta g e s o f s o ma ti c e mbr y o s . A d a p te d f ro m Fr e d e ric o e t a l. (2009 a).
Since the prediction of cell totipotency by Haberlandt in the early 1900's and the pioneering works from Reinert (1958) and Steward et al. (1958), much progress in SE understanding has been made, using the Daucus model system. Since these first studies, the number of higher plant species from which somatic embryos could be obtained and regenerated, has continuously increased. The phenomenon has been documented in a large number of gymnosperm and angiosperm species (Raemakers
et al., 1995; George et al., 2008). Some species, however, are more recalcitrant than
others regarding both, the initiation of embryogenic cultures and the regeneration of plants (Rao, 1996; Li et al., 2006; Nic-Can et al., 2015). The successful induction of somatic embryos and subsequent recovery of viable plants is not routine or efficient for the majority of species (Merkle et al., 1995) and the mechanisms involved in the induction and establisment of SE remains mostly unknown (Jiménez, 2001).
Determining specific physical (species, explants origin and environmental conditions) and chemical factors, such as culture media, type/concentration of plant growth regulators (PGRs) and nitrogen/carbon source, that switch on the development of the embryogenic pathway remains a key step in embryogenic induction (Elmeer, 2013). Early research on SE mostly focused on PGRs (Jiménez, 2001; Raghavan, 2004), and a repertoire of strategies has been developed to regenerate many species via SE using PGRs as inducers (Yang and Zhang, 2010). Finding the right conditions to induce SE in different species and cultivars has been mostly based on trial and error experiments (Jacobsen, 1991; Henry et al., 1994), by analyzing the effect of different culture conditions and media and modifying especially the type and levels of PGRs (Jiménez, 2001). Auxins and cytokinins have been considered to be the most important PGRs in relation to cell division and differentiation, as well as in the induction of SE (Fehér et al., 2003). The auxin analog herbicide 2,4-diclorophenoxyacetic acid (2,4-D), has been widely used, especially in the latter process (Dudits et al., 1991; Yeung, 1995; Fehér et al., 2002). A large amount of in
vitro SE systems rely on the use of exogenous 2,4-D as an inducer (Nomura and
Komamine, 1995; Pedrosa and Vasil, 1996; Meneses et al., 2005; Sharma et al., 2005; Lee et al., 2009b; Sharifi et al., 2012 and references therein). However, embryo development in somatic tissues has been reported in the absence of PGRs, as well as in the presence of other PGRs, such as cytokinins (Eudes et al., 2003; Gaj, 2004; Jia et al., 2008), gibberellic acid (GA) (Swain et al., 1997; Hay et al., 2002;
Wang et al., 2004; Nasim et al., 2010) or abscisic acid (ABA) (Nishiwaki et al., 2000; Ikeda et al., 2004 and 2006; Kikuchi et al., 2006; Rai et al., 2011; Jin et al., 2014). SE can also be promoted by non-hormonal inducers, such as high sucrose concentration, or osmotic stress (Kamada et al., 1993; Ikeda et al., 2004), heavy metal ions (Kiyosue et al., 1990; Pasternak et al., 2002), high temperature (Kamada
et al., 1989; Kikuchi et al., 2006; Fu et al., 2008; Aslam et al., 2011) and light (Torné et al., 2001; Germanà et al., 2005). It has been proposed that PGRs and stress play
a central role in mediating the signal transduction cascade leading to the reprogramming of gene expression, followed by a series of cell divisions that induce either unorganized callus growth, or polarized growth, leading to SE (Dudits et al., 1991). These findings have prompted the question of whether SE is a stress response of plants to survive extreme in vitro environmental conditions (Fehér et al., 2002, Ikeda et al., 2004; Karami and Saidi, 2010; Zavattieri et al., 2010; De-la-Peña
et al., 2015). In fact, several reports support this point of view. Jin and co-workers
(2014) used sodium chloride (NaCl) and ABA stress treatments in Gossypium
hirsutum to regulate the balance between proliferation and differentiation that
determines SE development. Potters et al. (2007), Potters et al. (2009) and lately Grafi et al. (2011), proposed that a common response of plant cells to sub-lethal stress is cellular dedifferentiation, whereby cells first acquire a stem-like state before assuming a new fate, which represents the first steps of embryogenic commitment and lately the acquisition of an embryogenic state leading to the SE pathway development (Verdeil et al., 2007; Zavattieri et al., 2010). The cell state shift from somatic into a embryogenic state is accompanied by the synthesis of ribonucleic acid (RNA) and DNA, a change in pH, an increase in the rate of oxygen uptake, elevated enzyme activity (mainly kinase), migration of nuclei towards the cell wall, changes in the cytoskeleton, active conversion of adenosine triphosphate (ATP) to adenosine diphosphate (ADP), inactivation of cytosolic factors and maturation promotion factor (Karami et al., 2009; Kurczyńska et al., 2012). These SE committed cells are usually isodiametric, rich in cytoplasm and starch, with callose depositions, being separated from the rest of the cells after severed plasmodesmata process (Suprasanna and Bapat, 2005).
Most of the success achieved so far in understanding the mechanisms that govern the efficient regeneration of plants through SE has been accomplished with model
plant species, such as Daucus (Vries et al., 1988; Lin et al., 1996; Imani et al., 2002; Fujimura, 2014), Medicago (Fowler et al., 1998; Fehér et al., 2002) and Arabidopsis (Ikeda-Iwai et al., 2003; Raghavan, 2006). However, the transfer of these new technologies to major crop species has been slow and difficult (Vasil, 1987; Raghavan, 2004). In this way, independently of the nature of the external stimulus, the establishment of SE necessarily involves profound changes at the molecular level, such as the coordinated expression of different sets of genes that drive the switch from vegetative grown to embryogenic development (Rose and Nolan, 2006). Thus, the identification of the genes that trigger key phases of SE, i. e. cell dedifferentiation, cell cycle reentry and establishment of a new embryogenic fate, has been highly desirable (Thomas and Jiménez, 2005; Fehér, 2008).
Since there are no universal cytological markers by which somatic embryogenic cells can be distinguished from non-embryogenic ones, the interest of biologists has long turned to invisible molecular markers, seeking to identify genes regulating SE-triggered changes (Elhiti et al., 2013). The identification and characterization of gene markers for SE offer the possibility of determining the embryogenic potential of somatic cells before any morphological changes appear and to provide information on molecular regulation of early SE (Mahdavi-Darvari et al., 2015). With the advent of genomics, numerous studies have been conducted to identify genes responsible for the various stages of SE (Chugh and Khurana, 2002; Suprasanna and Bapat, 2005; Chugh and Eudes, 2007), using model plant species and others. Since the beginning the Daucus system has been and continues to be widely used (Bayliss, 1976; Chibbar et al., 1988; Coutos-Thevenot et al., 1990; De Jong et al., 1993; Dyachok et
al., 2000; Imani et al., 2001; Li and Kurata, 2005; Imani et al., 2006; Frederico et al.,
2009a; Peters et al., 2011).
The idea that PGRs may be perceived as a stress condition resulted from work on
Daucus cells, where two heat shock protein (HSP) genes were found to be
auxin-responsive during somatic embryo development (Coca et al., 1994; Kitamiya et al., 2000). Cell tracking has been successfully applied to evaluate and mark the fate of embryogenic cells using the John Innes Monoclonal Antibody 8 (JIM8) reactive cell wall epitope (Pennell et al., 1992; Pennell et al., 1995, McCabe et al., 1997), and to elucidate the signaling pathways by which plant cells remodel their gene expression
program (Souter and Linsey, 2000; Jiménez and Thomas, 2006). The identification of hormone-inducible genes has also yielded clues how regulation of gene expression is controlled during embryogenic development. The characterization of signaling component genes, such as SOMATIC EMBRYOGENESIS RECEPTOR-LIKE
KINASE (SERK) (Schmidt et al., 1997), has generated great interest in the switching
of several signaling cascades during SE, uncovering transcription factors such as
BABY BOOM (BBM), LEAFY COTYLEDON (LEC1 and 2) as potential regulators of
SE development (Yang and Zhang, 2010).
Although much is already known, it remains unclear what underlies the differences in SE-mediated regeneration efficiency observed amongst different genotypes within the same species and the even more drastic differences between species (Ochatt et
al., 2010). The observation that different genetic mutations induce similar
embryogenic phenotypes in postembryonic plants, reflects the complexity of SE and the possible existence of overlapping pathways triggering the SE developmental process, under the local tissue/cellular conditions and appropriated hormonal balance (Thomas and Jiménez, 2005). This variability in competence for in vitro regeneration via SE has handicapped and delayed the exploitation of biotechnology approaches for breeding in many species and still is the main research subject in several laboratories (Ochatt et al., 2010). When different genotypes are used, differential responses are observed even in Daucus, one of the most extensively studied species concerning SE (Wilde et al., 1988; Imani et al., 2001; Frederico et al., 2009a). However, the molecular basis underlying these differential responses remain unknown (Karami et al., 2009).
Efforts to overcome this situation were made by comparing embryogenic and non-embryogenic cells at multiple levels, such as at the morphological, genomic and proteomic (Sharifi et al., 2012; Nic-Can et al., 2015). At the morphological level embryogenic calli were described as presenting nodular features, with a friable and smooth surface (Yang and Zhang, 2010), being highly variable in color depending on the species, ranging from brown in Coffea arabica (Quiroz-Figueroa et al., 2006) to translucent in Crocus sativus (Sharifi et al., 2012) or yellow/light yellow in Gossypium
hirsutum (Han et al., 2009) and Daucus (Frederico et al., 2009a). In contrast,
presenting a rough surface and being usually hard or spongy, with dark colors (green to brown).
On the other hand, the determination of calli embryogenic efficiency for regeneration was mostly performed by methodologies based on embryo counting amongst genotypes in order to select the most efficient for further evaluation (Lin et al., 1996; Han et al., 2011). This approach is usually highly time consuming and tedious, may thus be the reason why SE efficiency evaluations only consider a few genotypes and even a lower number of calli cell lines, without considering the differences within accessions (Han et al., 2011). This limited the achievement of a global overview and broad conclusions in relation to the differential SE response (Sujatha, 2011), when genomic and proteomic studies are performed to identify the factors leading to embryogenic progression or repression (Zeng et al., 2007; Yang and Zhang, 2010). According to Ochatt et al. (2010) and Elmeer (2013), the identification and characterization of the embryogenic capacity of a specific species/genotype/accession, will increase the accuracy of the acquired conclusions and will lead to a better understanding of the differential SE efficiency responses. On the other hand, the use of germplasm from model species, with well defined SE protocols and an 'easy-to induce' capacity, such as in the case of Daucus, is expected to increase the possibility of success in the search for factors leading to an improved embryogenic efficiency for plant regeneration, especially in the recalcitrant ones.
1.3 - Alternative oxidase: Recycling pump and much more
Plant alternative oxidase (AOX) is a multigene family encoded in the nucleus by two discrete subfamilies (AOX1 and AOX2), and was firstly discovered in angiosperms upon examination of the phenomenon of cyanide-resistant respiration (Bendall and Bonner, 1971). Family members have been identified in all higher plants investigated to date and also in some algae, fungi (Scheckhuber et al., 2011), eubacteria and protists (Whelan et al., 1996; Baurain et al., 2003; Stenmark and Nordlund 2003; Venter et al., 2004; McDonald and Vanlerberghe, 2006). The presence of AOX was also revealed in animal kingdom phyla, including mollusca, nematoda and chordate (McDonald. and Vanlerberghe, 2004 and 2006; McDonald, 2008; McDonald et al., 2009).
AOX is localized to the inner mitochondrial membrane (Figure 1.2) and is a member of the diiron carboxylate group of proteins, characterized by an active site that includes two iron atoms coordinated by several highly conserved glutamate and histidine residues (Berthold and Stenmark, 2003). AOX is of research interest for studying the phenomenon of retrograde signaling between the mitochondrion and the nucleus and due to its role in the acclimation of plants to a variety of environmental stressors (Gray et al., 2004; McDonald, 2008; Giraud et al., 2009). The role of mitochondria as a physical platform for biochemical networks, signal perception and signal transduction, was proven to be crucial for the maintenance of homeostasis in plants (Raghavendra and Padmasree, 2003; Fernie et al., 2004; Amirsadeghi et al., 2007; Noctor et al., 2007; Rhoads and Subbaiah, 2007; Sweetlove et al., 2007). As part of a global mitochondrial response, Rasmusson et al. (2009), Vanlerberghe et al. (2009) and recently Chocobar-Ponce et al. (2014), suggested the enrollment of AOX in counteracting deleterious short-term metabolic fluctuations, especially under stress conditions by acting as a stress-signaling pathway from the mitochondrion that controls cellular responses to adverse conditions.
AOX catalyzes the oxidation of ubiquinol and reduction of oxygen to water. Hence, the electron transport chain is branched, such that electrons in the ubiquinone pool are passed to oxygen (O2) via either the cytochrome pathway (using complex III,
non-energy conserving and while its physiological role is still a matter of debate, a developing idea from plant studies is that it may act to dampen the rate of electron transport chain-generated reactive oxygen species (Finnegan et al., 2004).
Figu re 1 .2 Or g a n iz a tion o f p lan t mi to c h o n d rial e lec tr o n t ra n s p o rt c h a in. E lec tr o n f lu x t o a n d f ro m Q is r e p re s e n te d a c c o rd ing t o Fer n ie e t a l. ( 2 0 0 4 ) a n d P lax to n e t a l. ( 2 0 0 6 ). I - N ic o tina m ide a d e n ine d inu c leo ti d e p h o s p h a te ( N A D P ) d e h y d ro g e n a s e ; II S u c c ina te d e h y d ro g e n a s e ; II I and IV C y to c h ro me p a th w a y ; V A T P s y n th a s e ; c C y to c h ro me c ; ADP A d e n o s ine d iph o s p h a te ; A OX A lt e rn a tiv e o x ida s e ; A TP A d e n o s ine t riph o s p h a te ; Ca 2+ C a lc ium ion ; Fu m . - Fu mar a te ; H + O x idiz e d h y d ro g e n ; H2 0 W a te r; N D H 's -N o n -p h o s p h o ry lat ing N A D (P )H d e h y idr o g e n a s e s ; Pi I n o rg a n ic p h o s p h o ru s ; PP i I n o rg a n ic p y ro p h o s p h a ta s e ; P P I - In o rg a n ic p y ro p h o s p h a ta s e s y n th a s e ; Q -U b iqu ino n e ; S and SH R e d u c e d a n d o x idi z e d d is u lf ide b o n d s ; S ucc . - S u c c ina te ; TR X h T h ior e d o x in h ; UCP U n c o u p lin g p ro te in.