F
ACULTY OFE
NGINEERING OFU
NIVERSITY OFP
ORTOA Cyber-Physical System for Dynamic
Building Evacuation
Luis Pinto
Integrated Master in Electrotecnical Engineering and Computers Supervisor: João Barros (PhD)
Co-supervisor: Fausto Vieira (PhD) Co-supervisor: Pedro Santos (PhD Researcher)
c
Abstract
In emergency situations with buildings on fire, evacuation is usually based on signs or guidance arrows installed across the building that indicate preferable exit paths. These types of evacuation systems are static in the sense that they do not provide real-time communication about the best exit route out of the building based upon the fire’s current location.
This work explores the practicality and feasibility of a dynamic building evacuation system capable of detecting and tracking the fire and that also gives adequate instructions to occupants to exit the building, deflecting them from hazardous zones and routing them to the nearest exit. To support the operation of such system, a new paradigm in environmental data acquisition, that has emerged in recent years, is used: Wireless Sensor Networks (WSN).
WSNs are made of small, cheap, self-powered devices (sensors), capable of radio communi-cation and equipped with various sensors capable of measuring different types of data from the environment. Our proposal is to have these small devices scattered throughout the building and constantly sensing the environment. If a fire spot is detected, the sensors would spread this infor-mation across the network, compute the best routes out of the building, and actuate over luminous signs to indicate people the path to follow.
However, the efficient and reliable operation of such a system faces significant and innovative engineering challenges. Three main aspects can be highlighted: (1) With respect to the deployment of the sensors, what is the optimum placement of the devices that ensures good coverage? How are the sensors receiving information about the building topology? (2) During normal operation circumstances, how frequently can messages be exchanged without depleting the battery too fast or facing too many congestions? (3) And finally, during emergencies, what are the best algorithms to compute the routes to occupants leaving the building? What happens if one of the sensors becomes damaged or runs out of batteries?
This dissertation presents several contributions for a system that aims at implementing all the aforementioned functionalities and solves the challenges presented. On a theoretical level, an analysis of the problem yielded a model that was used to extract a set of deployment rules for the motes, which is believed to be a novel result. Also, a new and intuitive method of deploying the system in the building is presented that allows the network to learn the physical topology of the building during allocation of the devices.
On an implementation level, the main outcome was a software package for TelosB motes, written in NesC for the TinyOS operating system, that implements the necessary information dissemination and route computing algorithms. Moreover, auxiliary circuitry intended to actuate as dynamic evacuation signs was designed and manufactured, and finally, MATLAB software was developed to help the management and visualization of the motes’ distribution.
To evaluate the system performance, simulations were performed. A number of metrics were defined to assess the compliance of the system to the demands of the operation requirements. A hardware prototype demonstration will also be presented.
Acknowledgments
I would like to thank:
Foundation for Science and Technology and Vital Responder project for the financial support of this work and my advisor, João Barros, for inviting me in the first place to be part of a wonderful work group at IT-Porto.
Pedro Santos for his inspiring ideas, tireless patience and guidance since the beginning of the project.
Professor Anthony Rowe from CMU for a new line of research that will hopefully continue. Traian Abrudan for his major contribution and effort in the hardware project and Sérgio Crisós-tomo for its expertise on wireless networks.
My friends Eduardo Mota and João Martins for all the laughs. Mafalda for everything I wouldn’t have without her.
At last, my parents for their eternal love and making sure my happiness is a constant in my life.
Luis Pinto
“Safety doesn’t happen by accident.”
Author Unknown
Contents
1 Introduction 1
1.1 Motivation . . . 1
1.2 Research Objectives / Proposed Solution . . . 2
1.3 Challenges and Contributions . . . 3
1.4 Outline . . . 4
2 State of the Art 5 2.1 WSN - Wireless Sensor Network . . . 5
2.1.1 Potentialities and types of WSN . . . 6
2.1.2 Hardware . . . 6
2.1.3 Deployment Issues . . . 7
2.1.4 Energy Issues . . . 7
2.2 Routing Protocols in WSNs . . . 8
2.2.1 Routing protocols accordingly to network structure . . . 8
2.2.2 Routing protocols accordingly to route’s finding . . . 9
2.2.3 Other Considerations . . . 10
2.3 Algorithms for Evacuation . . . 10
2.3.1 Related Work and Hazardous Models . . . 10
2.3.2 Deployment, Actuators and Other Considerations . . . 11
3 Theoretical Framework 13 3.1 Graph Model . . . 13
3.2 T-graph . . . 14
3.3 D-graph . . . 14
3.4 Routing Algorithm with Safety/Distance Constraints . . . 15
4 Motes Operational Software 17 4.1 Logical Architecture . . . 17 4.2 System Operation . . . 21 4.2.1 Deployment . . . 21 4.2.2 Run-time Operation . . . 24 4.2.3 Fire Event . . . 25 4.3 Software Implementation . . . 26 5 Signalization System 29 5.1 Specification . . . 29
5.2 Explanation and Resource Consumption Analysis . . . 30
5.3 Hardware . . . 31 vii
viii CONTENTS 6 D-Graph Visualization Algorithm 33
6.1 Existing Algorithms . . . 33
6.2 D-graph Visualization Constraints . . . 34
6.3 Computing Nodes’ Positions . . . 34
6.3.1 Stress Algorithm . . . 35
6.3.2 Bubble Algorithm . . . 35
6.3.3 Erase-Intersections Algorithm . . . 36
6.3.4 Orientation Algorithm . . . 37
6.3.5 Summing Forces . . . 37
6.4 3D Visualization of the Floor Plan . . . 37
6.5 Matlab Implementation . . . 38
7 System Performance Evaluation - Validation 41 7.1 Conditions . . . 41 7.2 Results . . . 43 7.2.1 Coverage . . . 43 7.2.2 Latency . . . 45 7.2.3 Information Lifetime . . . 46 7.2.4 Congestion . . . 48 8 Conclusions and Future Work 51
List of Figures
1.1 Examples of static signs found inside buildings . . . 2
1.2 Pictogram of the evacuation system . . . 3
2.1 A 10-node-WSN . . . 5
2.2 A diagram with inner modules of a mote . . . 6
3.1 Visual Representation of a Graph . . . 13
3.2 Floor-map of a building and its constituent parts . . . 14
3.3 Example of a T-graph . . . 14
3.4 Sensors placement example . . . 15
4.1 Simplified diagram describing system’s functions . . . 18
4.2 Leaky Bucket analogy . . . 19
4.3 Leaky Bucket algorithm which has been implemented . . . 20
4.4 Example of user’s movement to set up D-links . . . 23
4.5 Time-line of the K-mote operation while setting up a D-link . . . 24
4.6 Inner structure of a line of the topology table . . . 24
4.7 Main software components of the code . . . 26
5.1 The four possible signs . . . 30
5.2 PCB showing a right-pointing arrow with green LEDs . . . 31
5.3 All the four different signs . . . 31
5.4 AA rechargeable battery . . . 32
5.5 Circuit schematic . . . 32
5.6 Double layer board draw of the signalization device . . . 32
6.1 Two different representations of the same graph . . . 33
6.2 Rotation on X axis . . . 38
6.3 Rotation on Y axis . . . 38
6.4 Rotation on Z axis . . . 38
6.5 Original graph to estimate . . . 39
6.6 Stress Algorithm alone . . . 39
6.7 Stress and Bubble Algorithms running simultaneously . . . 39
6.8 Stress, Bubble and Intersections Algorithms running simultaneously . . . 39
7.1 Test-bed utilized for the set of tests . . . 42
7.2 Radio connectivity topology of the test-bed . . . 42
7.3 Process to measure delivery vs coverage . . . 44
7.4 Table - Percentage of delivered messages organized by coverage group . . . 44 ix
x LIST OF FIGURES
7.5 Graph - Percentage of delivered messages organized by coverage level . . . 45
7.6 Table - Latency of messages by source node . . . 46
7.7 Graph - Latency of messages by source node . . . 46
7.8 Table - Average lifetime of a link-state message on a node . . . 47
7.9 Graph - Average lifetime of a link-state message on a node . . . 47
7.10 Table - Categorization of buffer occupancy . . . 48
List of Tables
2.1 Difference between reactive and proactive protocols . . . 9 3.1 Description of all the possible node states . . . 16 5.1 Arrows and Motes needed for each type of location . . . 31
Acronyms
ADC Analog to Digital Converter BJT Bipolar Junction Transistor
CMOS Complementary Metal-Oxide-Semiconductor CPS Cyber-physical System
DAC Digital to Analog Converter DIP Dual Inline Package
DG Defines Graph
DSDV Destination-Sequenced Distance Vector GUI Graphics User Interface
LED Light-Emitting Diode LB Leaky Bucket
MC Message Control
MDS Multidimensional Scaling PNP P-doped transistor RoD Rules of Deployment RP Routing Protocol
RSSI Received Signal Strength Indicator SPI Serial Peripheral Interface bus X+ It means: X or more
WSN Wireless Sensor Network
Chapter 1
Introduction
This Dissertation, entitled "A Cyber-Physical System for Dynamic Building Evacuation", serves the purpose of documenting the work developed in the last four months. It was written in the context of the curricular unit "MSc Dissertation" which takes place in the second semester of the fifth year (2010/11) of the Master Program in Electrical and Computers Engineering at FEUP.
At Institute of Telecommunications of Porto, and within the scope of the Vital Responder CMU project, it was explored how a Wireles Sensor Network featuring a tight coordination be-tween computational and physical elements, can enhance the available information about haz-ardous events inside buildings and also help first-responders in their rescue missions.
This chapter contains an explanatory overview of the whole project, defending its importance and which are the major contributions achieved.
1.1
Motivation
Fires take almost four thousand lives in USA each year, of which three percent of casualties are inside public or commercial proprieties according to the National Fire Data Center report [1]. With dark smoke, visibility dwindles fast as the fire progresses and the task of finding the shortest and safest paths to the exit becomes increasingly harder. Firefighters’ golden rule is "Try to get yourself out fast"[2], because every wasted second looking for a path to the exit can be the difference between life and death.
The increased use of smoke detection and alarm systems led to a huge reduction in the number of reported fires, as they fasten detection of fires and consequent extinguishing. Generally, they consist of smoke detectors connected to a central panel that triggers an alarm and provides some status information. Lights and/or sirens alert building occupants and luminous exit signs over doorways, in corridors and hallways (figure 1.1) guide occupants to the nearest exit. Some more complete systems can include backup batteries to operate during a power failure.
However, these system are static in the sense that they will always point to the same corridors, stairs or exit doors, independently of the fire position. In this context, if the system is inadvertently
2 Introduction
Figure 1.1: Examples of static signs found inside buildings
guiding someone directly to a fire spot, it is likely to put that person in real danger. Furthermore, current systems do not offer firefighter crews precise location of the fire in real time.
1.2
Research Objectives / Proposed Solution
Speeding the evacuation of buildings may save lives and at the same time help firefighters to put out fires sooner. This can be done with an emergency system that guides building occupants through the closest and simultaneously safest path. Centralized systems are fragile and unreliable because the failure of a single point can undermine the operation of the entire system. Distributed systems promise a much better solution: many smart sensors are connected across a building so that even when large areas are damaged, all the remaining nodes continue to function as expected. Distributed systems capable of sensing the environment are called Sensor Networks.
Nowadays, with the development of cheap electronics, wireless has been included on these systems and Wireless Sensor Networks (WSN) were born as a new paradigm of environmental data acquisition. A WSN is a network constituted by small, cheap, self-powered devices (also known as motes), capable of exchanging information among themselves using radio communications and enhanced with sensors and other general attached devices.
This project envisions the use of WSNs inside buildings (like hospitals, museums and malls) as a valid mean to obtain a distributed and dynamic evacuation system. If one pictures motes with visual signs and temperature sensors, scattered among a building (cf: figure 1.2), it is expected to accomplish the following:
• Gather reliable information about the location of the fire and how is it evolving;
• Give correct instructions to occupants inside on how to evacuate a building fast and safely; • Create a visual live map for firefighters in order to easily see the location of hazardous zones. A system with such a coordination between computational and physical elements is catego-rized as a cyber-physical system (CPS). This category of systems can also be referred as embedded systems. [3]
1.3 Challenges and Contributions 3
Figure 1.2: Pictogram of a evacuation system based on wireless sensors and guiding signs
1.3
Challenges and Contributions
This project presents considerable challenges which are listed next. It is also mentioned some of the main contributions made.
Radio Communications The biggest challenge is to achieve a reliable dissemination system: information has to reach all the network, departing from any point in it. Congestion and interferences on radio packets are possible and should be expected [4]. Traditional reliability mechanisms such as sequence numbers and timestamps were implemented and twitched for this particular setting; to manage the sending of outbound messages, a Leaky-Bucket scheme was implemented.
Battery Lifetime Radio chip in motes is usually the largest battery-consuming component, and protocols should take this into account to maximize battery life. The total number of sent messages is reduced to the minimum indispensable by achieving an equilibrium between event-triggered and periodic messages.
Deployment Motes are unable to locate themselves on a building. However, this information is vital to compute best routes to the exit. This project contributed with a new idea to inject information in the network about the topology of the building (floor plans) on-the-fly. It is a flexible and fast way, requiring one person and some few instructions to install and become fully operational.
Signs The challenge is in achieving a complete, inequivocous and easy-to-read specification of guiding signs and their placement. This project presents such a dynamic signaling system
4 Introduction that aims to clear and configurable enough to be used in numerous locations. Furthermore, a list of rules for node placement takes into account the best locations to place signs. Floor-plan after deployment In this project, it was idealized and partially developed a method
that returns the floor-plan of the building after the WSN deployment. This system comprises the capability to draw a visual representation of the building and match respective motes positions on the map. In the future versions, the live state of the building can be visualized and monitored at any time.
1.4
Outline
This document is structured by chapters. In Chapter 2, one can find the state-of-the-art WSN ap-plications in general and some existing building evacuation apap-plications in particular. Chapter 3 gives the reader the theoretical framework that underlines the whole project. Then, Chapter 4 de-scribes the software part of the system, that composes the core of the mote’s operation. Chapter 5 depicts the specification of the signalling system that was developed for giving indications to peo-ple. Next, Chapter 6 shows how an auxiliary visual interface can be built, creating the possibility to see the actual state of the building anytime, anywhere. Chapter 7 presents some performance results derived from simulations on a network with seven nodes. Finally, there are some general conclusions to be drawn, in Chapter 8.
Chapter 2
State of the Art
2.1
WSN - Wireless Sensor Network
A wireless sensor network (WSN) refers to spatially distributed autonomous sensors capable of monitoring physical or environmental conditions, such as temperature, sound, light, vibration, pressure, motion or pollutants and exchange that information across the network. Its elements consist of small nodes with sensing capabilities, weak computational power and wireless commu-nication interfaces, commonly designated as motes [5].
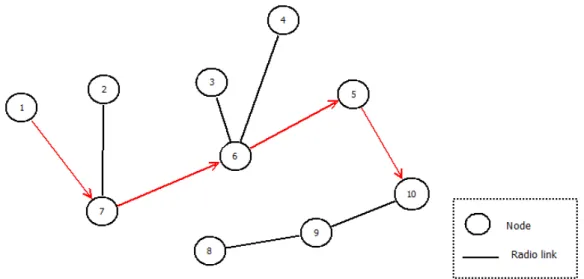
In figure 2.1, it is possible to visualize an example of WSN made of 10 nodes where radio links are represented by lines and nodes by numbered circles. In this example, it is demonstrated how a packet generated on node number 1 can reach its destination node (10), by being retransmitted successively on nodes 7, 6 and 5.
The desirable characteristics of a WSN are scalability, low power consumption over the long term, adaptability to environment changes, fast, reliable and accurate data acquisition, low cost to purchase and install, and need for little maintenance.
Figure 2.1: 10-node-WSN sending a message from node 1 to node 10
6 State of the Art
2.1.1 Potentialities and types of WSN
Due to recent technological advances in manufacturing these portable elements, it is now feasible to deploy thousands of sensors that easily sense and survey a wide area of space in a matter of seconds. Sensors integrated into structures, machinery and the environment, allied with an efficient delivery of sensed information could provide tremendous benefits to society. Wireless Sensor Networks (WSN) is a new concept that embodies this new paradigm of pervasive sensing. Fixed or movable, WSNs are used for several reasons: to perform data acquisition in inhos-pitable terrains, to monitor state of a building, check consumption and control house appliances or even to share information between people on meetings [6]. Its constituent devices, called motes, are to be scattered across an area of interest, measure ambient conditions of the surroundings, process that information, and then communicate with its neighbours or to a base-station wirelessly [7] [8].
2.1.2 Hardware
Motes exist for a few years and manufacturers made them low power devices with sensing and various radio chips. Figure 2.2 depicts the general internal structure of a mote. The core of the mote is a processing element, to which some sensors, a transceiver and some memory can be attached according to the needs. Usually, there is a power source for autonomous operation.
Figure 2.2: A diagram with inner modules of a mote
Any type of sensor can be attached to a mote depending on the desired application. From temperature and light sensors to accelerometers and compasses, or even smoke, vibration and movement detectors could be use to make sensing just depending on the end-use application.
At the same time, motes can actuate on the environment without disregarding their constrained energy sources. By means of lights, sounds, etc. they can interact with people or anything that the application demands.
Some examples of commercial/academic motes are:
Libelium Waspmote [9]: a modular open source device that can have Bluetooth, GPS, GPRS and Zigbee (7km range max). It can include sensors of gases, temperature, weight, light, accelerometers and many more.
2.1 WSN - Wireless Sensor Network 7 Crossbow Telosb [10]: an open source platform, low-power wireless sensor module designed to enable cutting-edge experimentation for the research community. The TelosB bundles all the essentials for lab studies into a single platform including: USB programming capability, an IEEE 802.15.4 compliant, high data rate radio with integrated antenna, a low-power MCU with extended memory and an optional sensor suite. (SPI port, DACs and ADCs).
Cricket [11]: goes even further with a location aware version of the popular MICA2 low-power Processor/Radio module. The Cricket Mote includes all this and also an ultrasound trans-mitter and receiver. This device uses the combination of RF and ultrasound technologies to establish differential time of arrival and hence linear range estimates.
CyLab’s Firefly[12]: these motes include several sensors, that can be expanded using their inter-faces (I2C for instance). To manage several task at the same time there is a tiny real-time operating system named nano-RK.
2.1.3 Deployment Issues
Motes’ deployment is a crucial part of the WSN application lifetime. Generally, literature presents two approaches:
Random fashion Motes are dropped arbitrarily on a wide area. Manual Deployment Motes are planted on specific and known spots.
The target application is the main factor for choosing one or another. Suppose an application that requires knowledge of physical topology of the network: if one wants to know the coordinates of the hottest point of a certain outdoor area, one has to know in advance the location (or its estimative) of all the motes. On the other hand, there are applications where motes’ positions are unnecessary, like sweeping a whole valley with motes to measure its average temperature and report that value to a base-station. Thus, to deploy a WSN it is important to balance advantages and drawbacks of each type and decide which makes more sense.
2.1.4 Energy Issues
Sensor nodes are constrained in energy supply, computation and bandwidth. One of the most important considerations regarding Wireless Sensor Network is power consumption, which must be minimized. By far, the largest percentage power consumption is attributable to the radio chip.
Thus, normal routing techniques, which do not take into major consideration energy consump-tion, cannot be used. If so, the lifetime of a WSN would be shorten by energy inefficiencies. It is highly desirable to find methods for energy-efficient route discovery and forwarding data among motes so that the lifetime of the network is maximized. [7]
There are a number of strategies that can be used to reduce the average supply current of the radio, including:
8 State of the Art 1. Reduce the amount of data transmitted through data compression and reduction.
2. Lower the transceiver duty cycle and frequency of data transmissions.
3. Reduce the frame overhead. Traditional protocols may not be applied to WSNs due to high overhead.
4. Implement strict power management mechanisms (power-down and sleep modes).
5. Implement an event-driven transmission strategy; only transmit data when a sensor event occurs.
2.2
Routing Protocols in WSNs
There are numerous techniques to exchange data in a WSN. The state-of-the-art routing protocols for WSNs were analyzed for two main reasons. First, to assess which protocol could be used for this project. Second, it became clear from the beginning that finding the best routes to building exits is a problem intrinsically similar to finding optimal routes of information in a computer or sensor network. Both problems involve points where people/information will be redirected. Each point of the network tries to send people/information as efficiently as possible to the destination point. Therefore, this section will survey current literature on routing protocols and how well they can suit this project purposes.
Literature categorizes protocols accordingly to two different angles: "Network Structure" or "Method for Finding Routes".
2.2.1 Routing protocols accordingly to network structure
Network Structure is a parameter quite often cited on surveys [13] [6] [14] on the subject; accord-ing to this criteria, wireless networks can be:
Flat: if all motes are equal to each other. No mote is more important than another.
Position-aware: if nodes are able to localize themselves and use that information differently with the routing protocol.
Hierarchical or Cluster-based: if some nodes are more important than others, i.e., able to com-municate further, compute faster or simply have a different role (rotative or not).
For our application in particular, all motes have similar roles and be considered as important as its neighbors. So, the protocol can be perfectly flat. However, it is not excluded the possibility of using clusters and cluster-heads to group motes by floors or increase power radio emission (RSSI) on nodes that are broadcasting fire alarms. It could speed up and simplify the exchange of messages at the same time as increase reliability.
2.2 Routing Protocols in WSNs 9 There are several examples in the literature of flat structured networks. Energy Aware Routing protocol [5] focus on the network lifetime. COUGAR[15] and ACQUIRE[16] (which stands for Active Query Forwarding In Sensor Networks) look at the network as a huge distributed databases, and use declarative queries. Direct diffusion [17] and Rumor Routing [18] use a paradigm to com-bine data coming from different sources eliminating redundancy; Rumor Routing is more focused when geographic routing is not feasible. Finally, SPIN [19] [20] flooding the entire network with information assuming that all nodes in the network are potential base-stations. So, any node can query any other for information.
2.2.2 Routing protocols accordingly to route’s finding
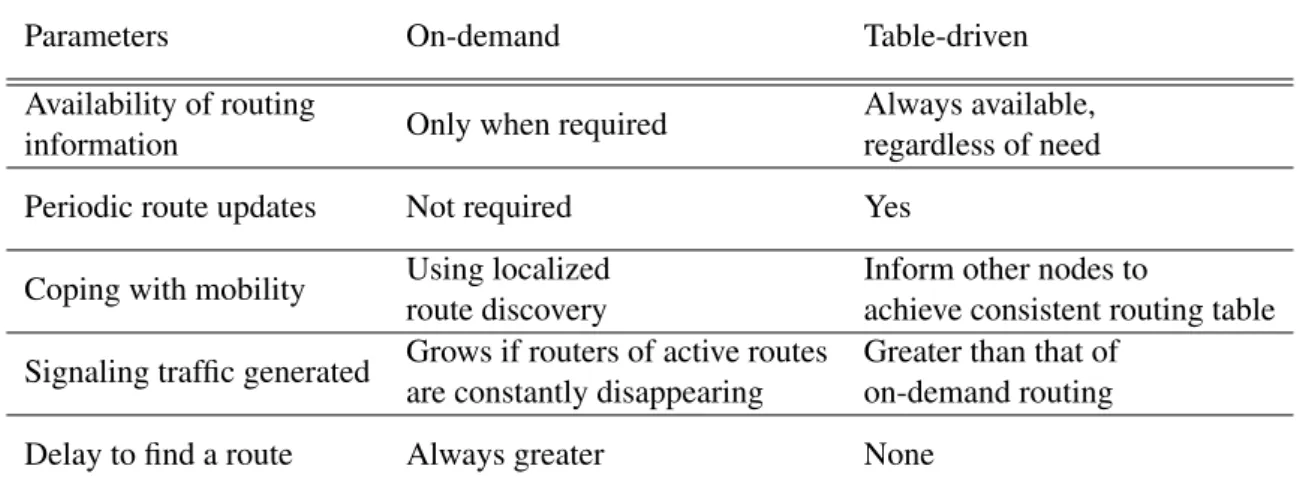
For this project, a categorization based on methods to find new routes is more relevant, as it is the core objective of the application. Royer et Al [6] classified them into 3 different categories, depending on how the source finds a route to the destination: proactive, reactive, and hybrid protocols. In proactive protocols (table-driven) all routes are computed before they are need, while in reactive protocols (on-demand) routes are computed on demand. Hybrid protocols use a combination of both.
The main differences could be depicted on the following table:
Parameters On-demand Table-driven Availability of routing
Only when required Always available, information regardless of need Periodic route updates Not required Yes
Coping with mobility Using localized Inform other nodes to
route discovery achieve consistent routing table Signaling traffic generated Grows if routers of active routes Greater than that of
are constantly disappearing on-demand routing Delay to find a route Always greater None
Table 2.1: Difference between reactive and proactive protocols
From the above information, it is clear WSNs use proactive or reactive protocols, depending whether is preferable to have table driven routing protocol or an on-demand protocol. The former is faster to converge but requires a constant verification of links, and by consequence more energy is likely to be wasted. The latter takes more time to converge routes and augments the probability of radio collisions and congestion during simultaneously demands for new routes, which will delay even more the communication which is unlikely to be tolerable in a hard real time application for instance.
The factors that depend on the choice of one or another are mainly: energy source capacity, movement of motes, needed rate of new routes, available memory and computational power. For
10 State of the Art an emergency building evacuation protocol, which can be considered a hard-real-time paradigm, it is quite clear that a reactive protocol gives less guarantees of delivering information in real-time. It is preferable to use more space memory and energy to assure that every node knows always the entire network; this way, there is no need for queries of information from neighbors.
The following list is for the best known proactive routing protocols [6]. Destination-Sequenced Distance-Vector Routing (DSDV) [21] is based on the classical Bellman-Ford routing mechanism[22]. Cluster-head Gateway Switch Routing (CGSR) [23] implements a non-flat topology. In Wireless Routing Protocol (WRP) [24], each mote is responsible for maintaining 4 tables: distance table, routing table, link-cost table and message retransmission list table. The list can continue with minor adaptations of the protocols which Al-Karaki et Al. [13] extensively expound.
2.2.3 Other Considerations
By way of a conclusion, Li et Al [4] show some general important lessons learned that should be attended during a future implementation of any protocol:
Data loss It is not rare due to network congestion and interference.
Asymmetric connection In general, transmission range in one direction may be quite different from the opposite direction.
Congestion It is likely to happen when message rate is high, aggravated when two neighbors nodes try to send a message at the same time.
Random conditions Nodes that should be several hops away occasionally come into direct con-tact range; so, many radio links are expected to be transitory which ought be taken into account.
2.3
Algorithms for Evacuation
There is some work done in literature related with building evacuation. The main difference between works is the model used for such emergency scenarios.
2.3.1 Related Work and Hazardous Models
Barnes et al [25] present a distributed algorithm to direct people to an exit in emergency scenar-ios across any type of floor plant. They present a model which includes data about how fast a hazardous condition will spread (hazard weight) and how fast people can run (navigation weight) between two nodes. This way, the safest path is the path with the highest safety metric (margin of time that an evacuee has to reach each node before the node becomes hazardous), calculated using breadth first search. The guiding emergency algorithm is reactive: it calculates where to guide people each time a node receives a new message.
2.3 Algorithms for Evacuation 11 In their working example with 64 nodes, with motes separated 10 cm from each other, they do not consider the possibility of node failures or even broken radio links, there are references of the possibility of using relay nodes, whose objective is to route messages between two sensor nodes incapable of communicate directly.
Christakos [26] also uses a ad hoc network, simulated on TOSSIM, as a decentralized system to find the best path to an exit in a situation where paths may be blocked, i.e., when its physical topology changes. It implements a Geographical-DSDV, a protocol for routing people, not packets, based on pure DSDV. A sensor node makes decisions based on any additional data received from other neighbours. This way, a node is only aware of its neighbours’ estimated distance to the exit, and with this data a mote is able to estimate its own distance to the exit. During simulations it is proven that the number of messages per node needed to recover from a detected physical blockage (which is likely to happen during an emergency) does not increase even with an increase of the number of motes on the network (<6 messages/node).
It is not clear how many exits Christakos’ model can include or even how these reactive algo-rithms behave (time of convergence, number of messages exchanged) with cyclic paths, shower alarms (multiple and simultaneous alarm events), as they represent real worst case scenarios. In addiction, in [25] is explicit that calculating a hazard height is not crystal clear.
Li et Al [4] analyses a navigation system with 50 motes where dangerous areas are represented as obstacles and potential fields are utilized to find the best path to a determined goal, avoiding obstacles. Sensors are placed in a grid where sensors detecting danger create a repulsive potential and the goal (exit) creates a attractive potential. To calculate the safest path, one has to calculate the gradient of the total potential which is the artificial force acting on the object (e.g.,a person). The direction of this force is the current best direction of motion.
In a building scenario (indoors) the idea of potentials could be harder to implement due to walls, floors and ceilings exist. Thus, there is no reference how Li et Al [4] model could include these elements. This is fundamentally different from the [26] and [25] approach: use a graph to model the floor plan of the building.
2.3.2 Deployment, Actuators and Other Considerations
In most cases, motes (real or simulated) have their code compiled with all the information regard-ing the plant of the buildregard-ing. So, even before their deployment, there is a "predetermined model of the building"[25] or "knowledge of the geographical layout to each sensor" [26]. It was not found any specification or rules about how to deploy the network neither considerations about how this could affect a real emergency scenario.
Regarding actuators, suggestions to use lighted signs, floor lights or even earpieces for blind ones arise [25], but no real implementation was found in [4] [25] [26]. Rules of ideal places to deploy actuators, how they affect network’s life time and how to ensure two distinct signals
12 State of the Art don’t give confusing or labyrinthine indications are challenging questions that may have to be self-answered during the project.
Finally, Christakos [26] remembers that too many pedestrians can crowd an exit/corridor, which was solved during simulations by admitting that nodes can detect large groups of people (>10) and with that information recalculate a new path for others arriving to that spot.
Chapter 3
Theoretical Framework
In this chapter, the theoretical models that form the foundation of the system are addressed. A graph model is used to describe the building, as well as a stress metric is defined to support the use of an enhanced routing protocol.
3.1
Graph Model
At some point, there is the need to hand on the floor-plan to the system; otherwise, it is impossible to compute the best routes to the exit knowing the building topology. This floor-plan does not need to be exhaustive - basically, it must include three key-informations:
1. Exit points;
2. How rooms, corridors and halls are connected; 3. Distances between them.
Therefore, the building’s floor-plan can be reduced to a graph. A graph is a mathematical structure made of points (nodes or vertices) connected to other points (its neighbors). These con-nections are usually called edges or links. Figure 3.1 illustrates an example of a graph with 6 nodes and 7 links.
Figure 3.1: Visual Representation of a Graph
For the sake of simplicity, one can assume there are no loops, i.e., a node can’t be connected to itself; so, a link has always two different nodes on its tips. Furthermore, it is considered as a dead-end a node that has only one neighbor (cf. node 6 in figure 3.1).
14 Theoretical Framework
3.2
T-graph
To represent a floor plan with a graph, some considerations are needed first. A floor plan has rooms, halls, corridors and intersections between [rooms-corridors] and [corridor-corridor]; an intersection is a place in space where someone can chose at least two new different paths to follow. To illustrate this, figure 3.2 represents an example of a simplified floor-plan of a fictitious building.
Figure 3.2: Floor-map of a building and its constituent parts. White: rooms, Blue: corridors; Red: intersections
The resulting graph is called the Topology Graph (T-graph). Its vertices match up intersections in red, as well as the center of each room. Its edges connect two vertices in the same corridor that are next to each other. In this manner, the defined links represent a simplistic but complete set of all the walkable paths present inside the building. It is also necessary to know the length of the edges: the system can only compute a path to the closest exit with this metric. Figure 3.3 continues the previous example.
Figure 3.3: Example of a T-graph based on Figure 3.2
3.3
D-graph
The above defined T-graph is a abstract representation of the floor-plan. So, it includes all the vital information about the floor to compute possible escape routes. However, the placement of the motes is not defined yet; the T-graph should be translated to a "Deployment Graph" (or "D-graph"), to fill the gap between theoretical model and physical reality.
In this new graph, vertices represent motes, and links can represent walkable paths between two motes, where occupants may move freely.
3.4 Routing Algorithm with Safety/Distance Constraints 15 As it is usually considered, each one of the links comprises an associated cost. For this ap-plication, this cost is a way to represent the hassle of going through that link. Initially, it can be defined as its length in meters. During operation, it may change in order to find the best route to the exit. Next section will explain in detail how costs and routes are found.
Before, a set of guideline rules about how motes should be placed is needed. Those are the Rules of Deployment (RoD). Therefore, motes are:
1. On corridors: glued to the wall, as many motes as possible distanced by at least 5 meters; 2. Above fire-doors: one in each side of it;
3. In the center of rooms and halls;
4. On intersections: motes on the ceiling, facing the beginning of each outgoing corridor. Figure 3.4 depicts a example which includes all of these cases. Orange circles are motes and linking them are edges representing walkable paths.
Figure 3.4: Sensors placement example
3.4
Routing Algorithm with Safety/Distance Constraints
A building and its current state can be fully characterized by knowing its D-graph where all edges have a length and state.
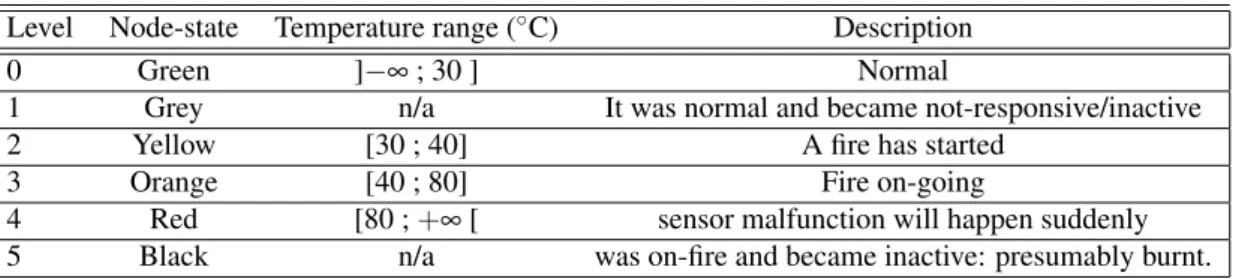
There are six possible states, which are listed in table 3.1; furthermore, this metric applies for both nodes and links:
Node-state It is a number between 0 and 5, indicating the level of danger a node is experiencing. Link-state It is the estimated danger experienced by one link, and is defined has the worst state
between nodes that form that link.
The exit path computing algorithm is done by calculating the “safest and shortest” path. To clarify this concept, the definitions of “safe” and “short” are explained:
16 Theoretical Framework Table 3.1: Description of all the possible node states
Level Node-state Temperature range (◦C) Description
0 Green ]−∞ ; 30 ] Normal
1 Grey n/a It was normal and became not-responsive/inactive
2 Yellow [30 ; 40] A fire has started
3 Orange [40 ; 80] Fire on-going
4 Red [80 ; +∞ [ sensor malfunction will happen suddenly
5 Black n/a was on-fire and became inactive: presumably burnt.
Shortest path Path (or set of paths) with the lowest cost between one mote and an exit, where cost is the sum of lengths of the set of D-links included in the path.
Safest path Path (or set of paths) with the lowest cost between one mote and an exit, where cost is the maximum color-level of the set of D-links included in the path.
It is clear that the shortest path and the safest path may hardly coincide. Therefore, it is necessary to reach a compromise between both to find the best route that can lead occupants to the exit.
This compromise is reached by admitting that safeness is more important than shortness. Upon this, the exit path computation algorithm starts by considering only edges with state equal to GREEN. All others are discarded. Then, it is found the shortest path to the exit . If doing so, no routes to the exit are found, all edges with state equal to YELLOW are now considered too. The algorithm continues to consider all the subsequent states till at least one solution appears.
Summing up, the algorithm does the following: BEGIN FOR (STATE=GREEN to BLACK)
BEGIN FOR a=0 to N:
IF (linkstate[a] > STATE ) linkcost[a]= +∞ ; END FOR
Find the shortest path.
IF (there is one solution) BREAK ; END FOR
Chapter 4
Motes Operational Software
This chapter is intended to describe the software package that was conceived for the motes. First, its logical structure is presented, and afterwards the system operation is discussed. Finally, it is addressed how the conceptualized system was implemented in a specific technology (TelosB running TinyOS).
4.1
Logical Architecture
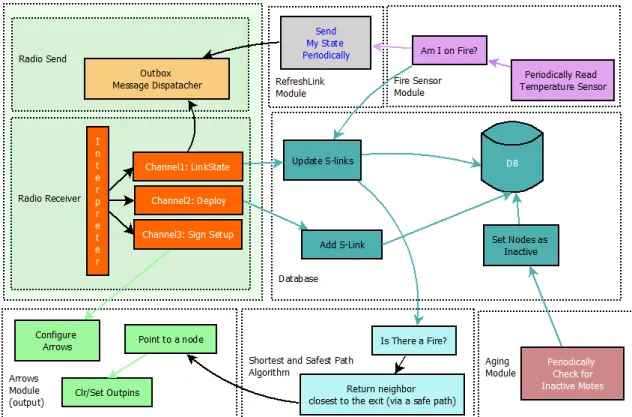
This section describes the logical organization of the software package. Figure 4.1 illustrates the general functioning of the system. Each one of the 8 colors modules represent a sub-function that the system needs to achieve its global behavior. These are:
Database Database to save D-graph information;
RefreshLink Module responsible for sending periodic hello messages throughout the network; Aging Module Module to find inactive nodes;
Radio Receiver Message receiver-interpreter; Radio Send Outbox to dispatch messages;
Shortest and Safest Path Algorithm Algorithm to calculate best routes to the exit; Arrows Module Output pin controller, responsible for commanding external hardware; Fire Sensor A fire detector based on temperature readings.
The software logical modules will be now presented, so that their goal and some specific implementation details can be discussed. The explanation of some modules was aggregated due to the very similar or intertwined operation.
18 Motes Operational Software
Figure 4.1: Simplified diagram describing system’s functions Database
The Database stores all of the network topology. It is used by almost every other module: the Shortest and Safest Path Algorithm module accesses the Database to know the state of the links; the Radio Receive module updates the Database every time a new link-state message arrives; the Radio Send sends data about the node that is fetched from the Database; and the Aging module uses the Database to identify nodes that might have become inactive.
RefreshLink and Aging Modules
A node is inactive if it does not contact the rest of the network for a long time. This can happen due to battery depletion, a sudden hazardous event that destroyed the mote, or some other event. Therefore, it is important to have a tool to detect inactive nodes.
This is solved with D-link states being periodically sent over the network to refresh previous information. To disseminate all the link-states of the table to all nodes, each node sends their own line of the table with a fixed period. This is the task of the RefreshLink module. The period is adjustable, and a trade-off between latency and radio usage must be weighed. In this application, two different periods are used: 30 seconds, if a node is GREEN; 2 seconds if a node is sensing a fire.
If some node is destroyed or is malfunctioning, other nodes will be aware indirectly: the Aging module checks the Database for nodes from which periodic link-state messages have not
4.1 Logical Architecture 19 been received lately. Messages include Periodicity and Time-stamp to allow the determination of how old the message is and if it is in an abnormal situation. When this happens, nodes set a local flag to inform that a certain node is inactive (GREY). If this node was detecting a fire before becoming inactive, it is assumed that this node is now burnt (BLACK).
Radio Receive
Each time a message is received, it is always verified if it is new or old: sequence numbers are included in all messages to ease this process. If the received message has a sequence number greater than the current sequence number, the message is considered. Otherwise, it is discarded. Radio Send (Outbox / Leaky Bucket)
Each node is able to receive and send messages. Each time a new message arrives to a node, it broadcast that message again, relying on pure flooding. However, a node may receive bursts of messages at a higher rate it can forward. For this reason, it is important to implement a buffer that can save received messages and wait for the best opportunity to forward them later.
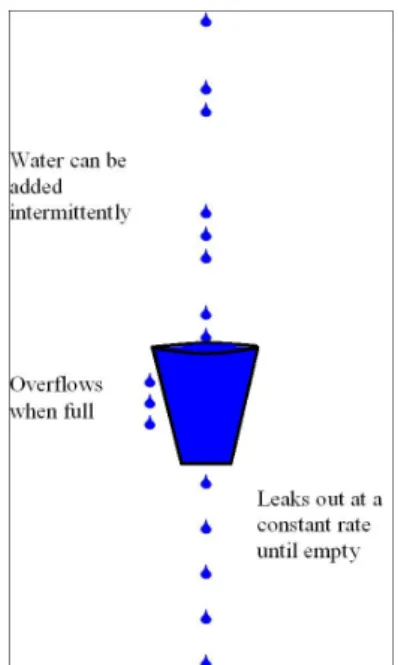
With this in mind, a variant of the Leaky Bucket (LB) algorithm was implemented to manage burst of information on the network. Its general behavior is based on the analogy of a bucket that has a hole in the bottom through which any water it contains will leak away at a constant rate, until or unless it is empty (figure 4.2).
Figure 4.2: Leaky Bucket analogy
Water can be added intermittently, i.e. in bursts. However, if too much water is added at once, the water will exceed the capacity of the bucket, which will overflow. When it happens, drops of water are lost.
20 Motes Operational Software The LB algorithm for the building evacuation application can be depicted by the following picture (4.3):
Figure 4.3: Leaky Bucket algorithm which has been implemented
Each time a new message arrives (cf. previous section), the LB adds the message source ID to the queue’s tail if and only if the ID is not there already. For this reason, queue only needs to be as long as the number of nodes on the network. This queue acts as a resource locking mechanism. At the same time, a copy of the received message is stored in one of the buffers. There are also as many buffers as nodes on the network. There is no reason to have bigger queues or buffers because if there is the case were two different messages from the same source are received, it does not make sense to send both: the validity of a message ends instantly since the moment a new one is available.
A parallel mechanism is responsible for sending buffered messages. It starts with the message owned by the node ID in the first position of the queue. After sending one message, the message
4.2 System Operation 21 is deleted from the buffer and its ID is erased from the queue. Then, LB backs off for a period of 100ms plus a pseudo-random generated number of [0-101]ms, before processing the next mes-sage on the queue. These numbers were chosen empirically to decrease the probability of radio collisions due to two neighbor motes sending messages at the same time.
Shortest and Safest Path Algorithm
As it was explained back in section 3.4, to find the best route we must consider that edges may be into six different states. The algorithm chosen to find the shortest path was the Dijkstra’s algorithm. After Edsger Dijkstra, this algorithm is a graph search algorithm that solves the single-source shortest path problem for a graph with nonnegative edge path costs, producing a shortest path tree. In this application, the algorithm explained in section 3.4 was implemented where "infinity" is 9999.
Arrows and FireSensor Modules
These two modules actuate over pins of the micro-controller, and periodically request data tem-perature from the sensor, respectively. Both are updated once per second.
4.2
System Operation
Now that the overall logical structure of the system has been presented, the three distinct stages of operation can be presented. These are the sequential steps that are expected to happen during the entire lifetime of the system:
Deployment Motes are physically positioned in the building regarding RoD (cf. section 3.3). Mandatory setup is performed in which D-links are created and signs are configured; Run-Time Operation Information about the D-links starts to be periodically exchanged between
the motes acting as a continuous health check-up system, carrying real time information about the state of system and periodically checking whether nodes are inactive or not; Fire Event Motes will determine the best route to the exit, by computing the algorithm described
on section 3.4. Each time they receive a link that includes information about an ongoing fire, visual signs are commanded accordingly.
These stages will now be described in more detail.
4.2.1 Deployment
This section explains how the deployment and configuration stage occur. The system would not function if this stage did not exist because best routes to the exit can only be correctly computed if the following information is known:
22 Motes Operational Software • Which nodes are exits of the building;
• Between which nodes exist walkable paths; • Physical distances between neighboring nodes.
Moreover, nodes have to command visual signs. So during Deployment, it is necessary to configure them in order for the mote to point towards the correct direction, during a fire event;
This project followed a strategy where configurations are done during or slightly after the positioning of the motes. This algorithm innovates by configuring a D-graph such that:
• Does not require knowledge of the building’s floor plan, nor external computers. • It is flexible, allowing to add or remove links at any time.
• Does not require different signalization hardware because signs can also be dynamically configured via software.
However, configuration requires an auxiliary mote (called K-Mote). This element allows con-figuration of the D-links and associated signs. In terms of hardware, K-mote is a mote like any other, differing only in its code. It contains two user buttons (Button1and Button2), plus a Reset
button.
In the user point of view, these are the steps to be followed in the deployment and configuration stage to create new D-links:
1. Start the deployment of motes, following [RoD];1
2. While doing it, press motes’ Button1to flag the mote as exit-node of the building; to remove
this flag, press it again.
3. To create a link between mote A and B: 3.1 Come near Mote-A (less than 1m away);
3.2 Handling K-mote, press K-mote’s Button1. K-mote’s blue-LED should start blinking;
3.3 Then, walk to Mote-B (less than 1m away);
3.4 Press K-mote’s Button1 (again) to create the first link; The elapsed time between the
first click and the second corresponds to the link length.
3.5 Now, to associate that link with a sign, press K-mote’s Button2a few times;
3.6 Four different signs light up: choose the one that better points towards Mote-A2 4. Repeat this process from #3 to generate other links.
1Cf. section 3.3.
4.2 System Operation 23 Figure 4.4 represents the physical movement of the user on the floor and its respective inputs while setting up topology links in a typical setup example.
Figure 4.4: Example of user’s movement to set up D-links
This process requires motes to detect the RSSI signal from the K-mote. Messages are only considered if the RSSI is above some threshold. It was carefully chosen to represent an approx-imated 1-meter distance; this way, motes further away from the K-mote are able to disregard overheard messages. The algorithm of setup of D-links can be depicted in the time diagram of figure 4.5 where K-mote and two network motes interact.
Following the deployment stage, information about the D-links needs to be scattered through-out the network because each node has D-link information that other nodes do not. To compute the best route out, the Dijkstra algorithm is used, which requires knowledge of all the network topology. Hence, there is the need to spread the information of each link across all the network. This is guaranteed by the following stage.
24 Motes Operational Software
Figure 4.5: Time-line of the K-mote operation while setting up a D-link
4.2.2 Run-time Operation
Run-time operation is responsible for disseminating information across the network, so that even-tually the topology information converges between motes. This code will run since the mote is booted; thus, Deployment and Run-time can and may run in parallel. The entire topology and the state of the system is stored into one single table. Each line of the table has information regarding one single mote, and the structure of a line is the following (figure 4.6):
Figure 4.6: Inner structure of a line of the topology table: green fields are global, blue are local Part of the table has information that Defines the Graph [DG] (ex: node ID, neighbors ID’s, distances, etc.) and other part is concerned with Message Control [MC]. The correct exchange of DG information among a distributed system implies that the system must transmit also some extra bytes of MC information among the sensors to guarantee that messages are sent and received as required, thus ensuring that the image of the network tends to be the same everywhere at all times.
The following list describes each one of the fields in detail, where Z is the size of the array: Source ID of a node;
4.2 System Operation 25 Neighbor[Z] ID’s of its neighbors;
Distance[Z] Respective distances between Source-Neighbor[Z];
Node-State Fire level of node [source]: Green, Yellow, Orange, Red, Grey or Black; Link-State[Z] Fire level regarding link: source-neighbor[Z];
Type Exit or Normal;
SeqNumber Unique number that is stamped on a message. A greater number means a newer message;
Periodicity Expected period of time to receive a new line [source], generated by node [source]; Timestamp Time when a new line [source] was inserted into the system.
Message Control (MC) implements mechanisms to assure reliable information dissemination. MC is designed to ensure old messages are only replaced by newer versions of the same messages. Furthermore, using Periodicity and Time-stamp, it is possible to find inactive nodes in the network: analyzing when a new message is expected to come, and consequently determine whether a mote is inactive or not.
4.2.3 Fire Event
During a fire event, the closest mote to the fire will start to sense a quick increase in its temperature value. This will trigger the mote to send a message to everyone stating its new state: Yellow, Orange or Red, accordingly with table 3.1.
This message is spread in the network following the same mechanism as any other Linkstate message (cf. section 4.1). As long the message is inserted into the Outbox, is sent as soon as possible.
However, the message can be inserted into the Outbox by two different situations:
• Synchronously - Periodically, each two seconds during any fire state (instead of thirty sec-onds);
• Asynchronously - Each time the mote changes its node-state (Green<->Yellow, Yellow<->Orange, Orange<->Red)
The periodicity of the messages changes back to thirty seconds if the temperature comes back to normal values. Independently of the mote that first senses a fire, as long as any mote detects there is a fire going on the system, the "Shortest and Safest Path" algorithm runs and it is deter-mined which of its neighbors is included on that route to the exit.
26 Motes Operational Software
4.3
Software Implementation
The chosen technology was the NesC programming language, which is compiled using the TinyOS programming environment. NesC is essentially C with some additional language features for components and concurrency [27]. The code is packed into “components”, which can be seen as somewhat similar to Classes in C++. Although in software, these components operate seemingly simultaneously, like threads. Their interaction is defined by special files called Interfaces. An Interface lists the functions that a user component can request to a server component (commands), as well as the interrupts the server module can trigger when the requested functions are completed. The software modules will now be presented, as well as their interactions and their relation to the logical architecture. Figure 4.7 shows the software architecture adopted based on the previ-ously presented logical architecture diagram. For each module, the implemented Logical module is indicated.
Figure 4.7: Main software components of the code
The code is divided in modules. Each module can execute several commands and signal events. This application has 7 modules, namely:
MainC Responsible for management functions. It has the boot event where first lines of code are run. Initiates and stops LinkStateC and DeployC modules.
LinkStateC Responsible for relaying received link-state messages and to periodically generate its own. Implements the RefreshLink, the Aging, the Database, the Radio and the Radio Receive modules.
DeployC Responsible for the communication with the K-Mote, exchanges messages to set links, their lenght and configures the ArrowsC module.
ArrowsC Responsible for lighting one of the four signs possible. A pre-configuration is manda-tory. Implements the Arrows module.
FireSensorC Samples the temperature periodically, signaling the presence of a fire and its fire level. Implements the Fire Sensor module.
4.3 Software Implementation 27 DijkstraC Computes the best path to the exit, signaling the closest neighbor included in that path.
Chapter 5
Signalization System
This chapter is dedicated to describing the signaling system: its specification, the reasoning behind the final form, and how it was translated into hardware.
5.1
Specification
The signaling system is the only interface occupants of the building ever see. It needs to meet three requirements:
1. Cover all possible indications to exits from a concrete spot; 2. Inform occupants in a fast and unequivocal manner; 3. Consume the smallest amount of resources possible.
Having in mind these requirements, a specification was found that requires only two pairs of signs to exist:
"Forbidden+GoAhead" These signs can be placed on all places a user can traverse under. This is the case of fire/exit doors and corridors’ extremities;
"Left+Right" These are signs that are to be deployed where people traverse through, such as corridors’ walls.
One can define "GoAhead" sign as complementary of the "Forbidden" sign and "Left" sign as complementary of the "Right" sign. Signs must be configured before being ready to work. A pair [SignX, NodeX] must be chosen during deployment and anytime the mote has to point to nodeX it will light SignX. If it is requested to point to any other node, it will light the complementary sign of SignX.
30 Signalization System
Figure 5.1: The four possible signs that should appear during a fire event (Forbidden, GoAhead, Right and Left)
5.2
Explanation and Resource Consumption Analysis
With these four different signs, it is possible to suggest occupants to follow any desired direction, whether they are on crossroads, corridors, staircases or inside a room.
Crossroads The user enters a crossroad. On top of the beginning of the corridors, there is a "Forbidden+GoAhead" sign. Only one of them will be exhibiting the "GoAhead" sign, while the others will be showing the "Forbidden" sign. This case verifies all the requirements layed out earlier: (1) all possible indications are covered; (2) the information is conveyed to the user easily and unmistakably; (3) resource consumption, while not minimal (all exits must have a set of arrows), is compensated by the fact the signs are extremely generic and can be produced in large scale.
Corridor "Left+Right" signs are deployed along the corridor, on the walls. Requirement (1) is immediately met: only two options exist. Requirement (2) is respected as well: if placed correctly in the corridor, any person leaving a room will immediately see where to go. Finally, requirement (3) is also met: a sign hanging from the ceiling would have to be double-sided. So, "left+right" signs consume less in this scenario.
Staircases On staircase’s walls, "Left+Right" signs can help users to decide if they should go up or down. Furthermore, "Forbidden+GoAhead" sign may be present on top of exiting fire doors to prevent occupants to enter an endangered area. Same requirement justifications apply.
Rooms Not applicable. Rooms must always be evacuated in any circumstance. So, there is no sense to add dynamic signalization there.
Doors For the specific case of doors, the following rule applies: there has to be a set of arrows on both sides of the door, and if the system is active, they must give complementary indications. In this case as well, all three requirements are meet again.
Upon the previous hardware specification, and considering the D-graph model, it can be de-duced how many sets of arrows are needed for a building like FEUP I department. It is assumed each set of arrows corresponds to a mote.
5.3 Hardware 31 Table 5.1: Arrows and Motes needed for each type of location
Location Arrows/Motes
"Forbidden/GoAhead" signs “Directional” signs Corridor 2, at extremities at discretion, along the corridor Crossroads 1, per exit N/A
Staircases (per floor) 1 on fire door 1
Rooms N/A N/A
5.3
Hardware
For this project some hardware was need to be developed, namely the set of visual signs that are the main user interface of the system. The premise was: its interface must have 3 digital input pins and 4 different signs have to light at a time (cf. section 5.1). The final form takes into account: visibility, power consumption, components optimization, type of power supply and price.
Considering the low price and simplicity of using LEDs, it was decided that to use them in our device. A minimum design was thought for a PCB board where different arrangements of a few bi-color LEDs are used to create four signs. Figure 5.2 shows the prototype board where LEDs positions and auxiliary circuitry are visible. The same figure shows some green LEDs forming a right-pointing arrow.
Figure 5.2: PCB showing a right-pointing arrow with green LEDs
Figure 5.3 shows LEDs relative positions and how the bi-color LEDs are combined to form four different signs.
Figure 5.3: All the four different signs
It was also decided that the type power supply should be the same as the motes to optimize resources: two AA rechargeable batteries, circa 2.4V @ 2500mAh. With such a low voltage, it is important to use bi-color LEDs with the lowest forward voltage possible. As a battery powered
32 Signalization System system, low current consumption is also vital to seek. However, luminous intensity cannot be disregarded because it is important to make the signs perfectly visible to the human eye.
Figure 5.4: AA rechargeable battery
Therefore, the chosen LED was the MCL059PURGW, a bi-color, common-cathode, 5mm-diameter GREEN/RED LED with which features luminous intensity of 15mcd, forward voltage of 2V, and forward current of 20mA. To drive 20mA on a LED, Bipolar Junction Transistors can be used as on/off switches. PNP BC557 was chosen as the best option for its low price, low output resistance and also because PNP transistors drive common-cathode diodes on their collector pin with higher voltages (Vbc < Vbe in general). To control the 4 different signs with 3 digital available input pins, a combinational logic circuit was designed. So, the final board includes 14 logic gates encapsulated in 3 CMOS logic gates DIP (instead of TTL, for better efficiency). Its schematic is presented in figure 5.5.
Figure 5.5: Circuit schematic
Using this, 50 prototypes were built and figure 5.6 shows the double-layer board draw file used for manufacturing them.
Chapter 6
D-Graph Visualization Algorithm
The evacuation system is designed to help occupants on their exit path during a fire event. No other information is provided apart from the guiding signs for escape routes. However, visualizing the current internal state of the system could be extremely helpful for firefighters. If they could visualize the affected areas in the interior of the building, this would greatly increase the efficiency of the rescue missions they carry.
6.1
Existing Algorithms
The need to visualize a graph lead to the development of algorithms that are able to compute a visual representation for it. Vertices are usually represented by small circles, and edges by line segments between adjacent vertices.
However, a graphical representation (a graph layout) is not the graph itself (the abstract, non-geometric structure): very different layouts can correspond to the same graph. In the mathematical abstraction, all that matters is which vertices are connected to which others and the weight/length of each edge. In a drawing, however, the arrangement of these vertices and edges impacts under-standability, usability and aesthetics [28]. Figure 6.1 depicts this issue.
Figure 6.1: Example of two different representations of the same graph
The same graph is represented in two complete different vertices arrangements. The second version includes edge intersections, which is intuitively more confusing to understand than the first version, a planar representation.
34 D-Graph Visualization Algorithm Multidimensional Scaling [29] (MDS) is a set of techniques used in information visualization. One of them is called Stress Majorization: it is an optimization strategy in which a stress func-tion is sought to be minimized. The stress funcfunc-tion is a cost funcfunc-tion that measures the squared differences between ideal (m-dimensional) distances and actual distances in r-dimensional space.
A configuration X which minimizes stress gives a plot in which points that are close together correspond to points that are also close together in the original m-dimensional data space. Stress majorization and similiar algorithms have application in the field of graph drawing according to Michailidis[30] and Gansner[31].
6.2
D-graph Visualization Constraints
Each node has a copy of the D-graph, which includes the list of all the D-links and lengths. Once again, this graph does not have shape: it is a pure mathematical representation of the floor-plan. The objective of the graph visualization algorithm is to predict the real shape of the floor-plan using the D-graph information that was given to the system in the deployment stage.
A mathematical graph may be have an infinite number of different representations possible be-cause absolute or relative orientations between D-links are considered to be unknown. Therefore, several joint constraints were used to limit the D-graph representation to a smaller set, namely:
1. Absolute distances between some nodes are known and must be respected. 2. If the distance between two nodes is unknown, it must be the greatest possible. 3. The D-graph is planar and its representation should be planar, too.
4. If a set of absolute link orientations is given, they must be respected it.
5. The D-graph must be represented on a 2D plan; two or more floors are at this point ignored. A D-graph visualization algorithm emerges when all the constraints are enforced by mini-algorithms that constitute the global algorithm. The first constraint explores the idea of Stress Algorithm. The second is a “Bubble Algorithm” that shares a parallel idea with the former. The third is a brute-force algorithm that eliminates intersecting edges whenever they exist. The fourth mini-algorithm drawn from the respective constraint explores the idea on how orientations can help the global procedure in a very efficient way. The last constraint states that all physical quantities such as positions and euclidean distances are evaluated on a two dimensional scale.
The next section explains how each mini-algorithm works. All of them run simultaneously.
6.3
Computing Nodes’ Positions
Ultimately, the algorithm returns approximated nodes’ relative positions. Absolute positions may arise if at least one absolute orientation of some link is inserted into the algorithm. Globally, all
6.3 Computing Nodes’ Positions 35 4 mini-algorithms assume each node is a physical particle with physical quantities, namely: mass (M), friction (µ) and position (~P), velocity (~v) and acting forces (~Fi). Algorithms run iteratively to
compute the current acting forces and positions change accordingly to discrete physical laws: ~ F(u) = n
∑
i=0 ~ Fi(u) ~ v(u + 1) = µ. v(u) +~ ~ F(u) M ! ~P(u + 1) = ~P(u) +v(u + 1)~
Friction is a parameter of the system that may be changed. Mass is proportional to the number of neighbors a node has: this option was considered as a stability key-point. Each time a node in the center of the network changes its position, it has a bigger ripple effect on more nodes than a peripheral node. In other words, the bigger the mass, the less the movement. Initial positions of nodes are randomly assigned.
6.3.1 Stress Algorithm
Stress Algorithm computes the forces which linking nodes are producing to each other similarly to string forces: the acting force is attractive if the string is stretched and it is repulsive when compressed. In this case stretched string means the link actual distance is greater than the desired value; compressed means the opposite. Stability point occurs when both distances are the same. Next equation describes acting forces on node1 and node2, considering there is a D-link between them with desired length d:
∆x = ||(~P(node1) − ~P(node2)|| − d ~r = ~P(node1) − ~P(node2) ||(~P(node1) − ~P(node2)|| ~ F1,2=~r.∆x ~ F2,1= −~r.∆x
This is the acting force on node1 derived from this single link. Node2 will have a symmetrical force. Other links create other forces that are summed up.
6.3.2 Bubble Algorithm
The Bubble Algorithm inflates the graph by creating a expanding or stretching force between any two nodes that have no link between them. This force exists to maximize the probability of the resulting graph is planar. Otherwise, nodes ruled just by stress forces will be placed too close from each other.