A Work Project, presented as part of the requirements for the Award of a Double Master Degree in Management from the NOVA - School of Business and Economics and FGV-
EAESP - Fundação Getulio Vargas.
Self-Initiated Expatriates: Generation Y Personality Traits and the
challenges organizations face to recruit them
Alessandra Sabatelli - 2639
A Project carried out on the Master in Management Program, under the supervision of:
Prof. Rita Campos Cunha (NOVA SBE) Prof. Isabela Curado (FGV-EAESP) Prof. Felipe Zambaldi (FGV-EAESP)
Abstract
The goal of this dissertation is to expand our understanding about generation Y, more specifically, self-initiated expatriated (SIE) - people who spontaneously decide to go abroad and look for new challenges. Those people present a “large but untapped pool of skilled international workforce” (Ceric & Crawford, 2016, p.137) with a high potential impact in terms of business and local growth. Therefore, the purpose was to analyse different personality traits and understand how they affect individuals in their job perspective. In order to respond to this question, a field study was conducted and data was collected from a convenience sample of 366 adults where the majority were postgraduate students with an average age of 25 years who have at least experienced studying abroad. The results of the conducted analysis can be summed up in the finding that it didn’t exist a significant connection between personality traits of Generation Y SIE’s and organizational characteristics. In praxis that means that companies do not appeal individuals with a certain personality of this sample by projecting a certain image and, therefore, an individual approach seems to be more appropriate than group targeting.
Keywords
Table of Content
Acknowledgement 1
1 Introduction 2
2 Personality traits of Generation Y and the challenges organization face 3
2.1 Personality Traits 3
2.2 Generation Y: 5
2.3 Organizational characteristics and attractiveness 7
3 Research Goal 10
4 Methodology 10
4.1 Sample and Data Collection 11
4.2 Measures 12
5 Data Analysis and Findings 14
6 Discussion and Concluding Remarks 23
7 References 26
Tables:
Table 1: TIPI Items adapted from Ehrhart et. al. (2009) 4
Table 2: Reason for Expatriation 12
Table 3: Q12 Rotated Component Matrix Results 16
Table 4: Cluster Analysis Results 18
Graphs: Graph 1: Organizational Cultures by Quinn & Kimberly (1984) 8
Graph 2: Data Analysis 14
Annex: Annex 1: Cronbach’s Alpha for Personality Traits 5 Items (excluded reversed Items) 30
Annex 2: Cronbach’s Alpha for Organizational Characteristics Items, all 18 Items ) 30
Annex 3: Q1 result of factor analysis 30
Annex 4: Q12 Factor Analysis Results 31
Annex 5: Q1 Rotated component matrix results 31
Annex 6: Box Plot for Organizational Characteristic: Membership) 32
Annex 7: Box Plot for Organizational Characteristic: Knowledge Application) 33
Acknowledgement
It is my pleasure to acknowledge those who have supported me during this achievement. I would like to thank my supervisor from NOVA SBE Rita Campos Cunha for challenging me, introducing me with a topic that truly interested me since the Global HR course. I would particularly like to thank my supervisors from FGV- EAESP. Isabela Curado for her support and constructive insights. Her passion and attention was a great inspiration for me while writing this thesis. Furthermore, I have to express my gratitude to professor Felipe Zambaldi from FGV- EAESP who so patiently helped me with the statistical analysis.
1 Introduction
Self-initiated expatriated (SIEs) are talented and mobile individuals, a significant source of knowledge, experience and network capital (Jokinen, Brewster, & Suutari, 2008; Carr, Inkson, & Thorn, 2005) which have high self-reliance, resilience, as well as technical skills that allow them to find appropriate employment in a foreign country (Inkson, Arthur, Pringle, & Barry, 1997).
Usually SIEs are cheaper recruits due to their ability to be locally as well as internationally responsive. Being able to win these talented workers for a company could generate a substantial contribution for developing competitive advantages through strategic human resource management (SHRM) (Delery & Shaw, 2001). Therefore, this project starts with looking into different personality types, matching with what they are actually seeking in a job position. Those attitudes and characteristics behind are important SIEs, as they are more open for geographical relocation and they find an international work engagement on by themselves (Doherty, 2013). Their decisions to relocate may impact the growth and development of cities, companies as well as businesses. Thus, it is important to understand and give significant attention towards attracting skilled employees to certain cities and/or businesses.
The research objective is to understand which specific features potential SIEs, with distinct personality traits, are looking in a job. Through analysing conscious and unconscious factors, it is possible to understand what is important for talents and, consequently, use specific recruiting technics to attract them. Recent meta-analytic studies confirm the increased focus in academic research on business expatriates and their international assignments (cf. Bhaskar-Shrinivas, Harrison, Shaffer and Luk 2005; Hechanova, Beehr and Christiansen 2003). Notwithstanding this recent growth, there is still a dearth of research on SIEs (cf. Inkson, Arthur, Pringle and Barry 1997; Jokinen, Brewster and Suutari 2008; Suutari and Brewster 2000).
More researches have raised the awareness to better understand issues associated with SIEs and their international relocation (Suutari and Brewster 2000; Vance 2005).
2 Personality traits of Generation Y and the challenges organization face
The literature review will start with an introduction into the current state of the literature on personality trait and the introduction of the five factor model (FFM). Going further from the main theory of the FFM it breaks it down to the ten item personality inventory (TIPI), on which this study is based. In addition to the personality traits the review aims to clarify the topic of organizational characteristics, which are an essential part of this study’s research model. Furthermore, the literature review gives an insight into the values and goals of generation Y in the workplace and therefore builds a base for the following analysis.
2.1 Personality Traits
Personality traits as one main aspect of this study are of great importance as they will set the ground for the following cluster analysis and helps to understand the scope of this study. In the following will be outlined how an individual’s personality can be classified within the existing theoretical framework.
One of the most frequently discussed theories in the area of personality research is the Personality Trait Theory. Many professionals and researchers have contributed to theory by using the trait approach to personality, which argues in favour of differences between individuals. As a result of a thorough research on Cattell's (1943) and Eysenck's (1987) personality trait theories, the Big Five theory, also known as the five factor model (FFM) was formulated. Pointed out by a factor analysis, this model shows that there are five core traits, which play together in order to form one’s personality. These include:
§ Extraversion - tendency to be active, sociable, person-oriented, talkative, optimistic, empathetic.
§ Agreeableness - tendency to be good-natured, kind-hearted, helpful, altruistic and trusting.
§ Conscientiousness - tendency to be hardworking, reliable, ambitious, punctual and self-directed.
§ Neuroticism - tendency to become emotionally unstable and may even develop psychological distress
§ Openness to Experience - tendency to be imaginative, curious, creative and may have unconventional beliefs and values.
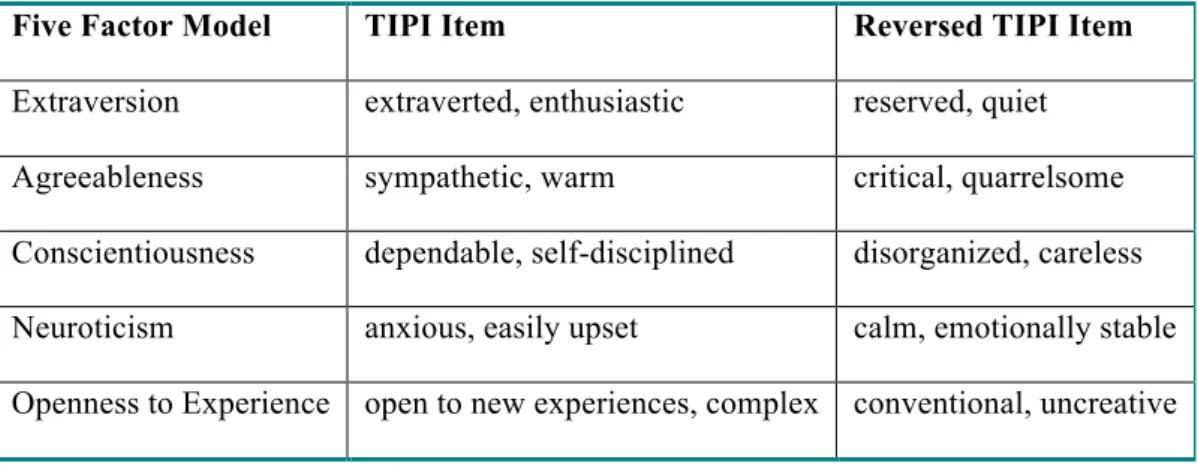
Since personality traits measurement models are very long and time consuming in recent years the science community developed a more time- and cost-efficient model to measure personality. With the common dissemination of the Five Factor Model researchers started to propose shorter scales such as the NEO-FFI (Costa & McCrae, 1992) or BFI (John, Donahue, & Kentle, 1991), which have become especially popular for personality studies. One even shorter proposal to the newly emerging demand the Ten-Item Personality Inventory (TIPI), introduced by Gosling, Rentfrow and Swan (2003). It uses descriptors from several well-known instruments such as Goldberg’s Big Five markers (Goldberg, 1992), the BFI (John et. al., 1991) and Adjective Checklist markets (John & Srivastava, 1999). The TIPI consists of ten items, each represented by two adjectives, two items for each of the five dimensions of the FFM. The scale can be completed in approximately 1 min and the items are measured on a scale from 1 = strongly disagree to 7 = strongly agree (Romero, 2012).
Table 1: TIPI Items adapted from Ehrhart et. al. (2009)
Five Factor Model TIPI Item Reversed TIPI Item
Extraversion extraverted, enthusiastic reserved, quiet
Agreeableness sympathetic, warm critical, quarrelsome
Conscientiousness dependable, self-disciplined disorganized, careless
Neuroticism anxious, easily upset calm, emotionally stable
Ehrhart et. al. (2009) showed in their validity and reliability study of the TIPI that it is indeed a suitable and efficient scale to measure personalities under time and cost limitations. They compared the TIPI to a larger scale mode, the 50-item IPIP FFM (Goldberg et. al., 2006), by utilizing a large and ethnically diverse sample. Their findings indicate that the TIPI compares well with the larger scale IPIP model and therefore is a suitable and valid tool to fit the FFM as well as being supportive and well suitable for research under time and cost limitations. The survey was based on the TIPI.
2.2 Generation Y
In order to understand the generational differences and needs of individuals the following paragraph will introduce the main differences between generation X and Y. As at the current point in time, as well as recent past, generation Y is the dominant generation to enter the job market, it is crucial for recruiters to understand what this newly entering generation is looking for in a company or job.
As any other generation in general demographers note that specific generations share common values and perspectives as well as are shaped by similar cultural, political, and economic experiences (Kotler and Keller 2006). Generation Y or commonly known also as Millennials is the generation, which mainly enters the job market at the moment (Tayler, 2007). Included in the Generation Y (Gen Y) are individuals born between 1977 -1994 (Noble et al., 2009) or as described by Reed (2007) as the last generation to be born completely in the twentieth century. The actual number of individuals counted in the Gen Y in 2009 differ drastically in existing literature and vary between 60 million (Reisenwitz and Iyer, 2009) and 30 million (Levine, 2008). This figure is used in this study only to imply the large part Gen Y plays in the current population. This specific generation today makes up the largest part of entries in organization’s workforces. The process of understanding the ideologies of Gen Y entails the need to consider their distinct cohort experiences. In today’s academic community (Strutton et al. 1997) the
argument that “ethical judgments, decisions, and behaviours tie back to the unique experiences that shape generational cohorts” (Zaptçıoğlu Çelikdemir & Tukel, 2015, p. 528) is largely accepted and repeatedly cited in recent papers.
For organisations and human resource professionals this comes along with a challenge since the characteristics of the previous generation that entered the workforce and Gen Y are different and organisations need to react in order to serve the new needs and demands of the entering generation (Reisenwitz and Iyer, 2009). Nevertheless, the large number of Gen Y individuals are named “the hardest of all to recruit” (“Recruiting and the Job Hunt”, 2008) This further implicates the need of HR professionals to influence organizational values and adapt, in order to make organizations attractive for this upcoming generation as an employer.
Describing the characteristics of Gen Y, Hymowitz (2007) uses the terms less cynical, more optimistic, more idealistic and more inclined to value tradition in comparison with the previous generation X. Furthermore, one of the most commonly used descriptions of Gen Y characteristics, when it comes to employee qualities is the characterization as tech savvy as it is the first of all generation to use email, instant messaging, and cell phones on a constant base since early childhood (Tyler 2007). Following the tech savvy description, they are also often labelled as multimedia and multitasking people (Reisenwitz and Iyer, 2009). When it comes to less technical and more sociological descriptions of Gen Y, Shepherd (2007) states that the individuals of this generation are looking for ability to engage in the community by volunteering activities as part of their work-life balance. The mentioned work-life balance is an important factor, and significantly more important to Gen Y than the previous generations (Reisenwitz and Iyer, 2009). This is further reflected when looking at the loyalty of Gen Y employees, as Durkin (2008) and Hira (2007) explored that Gen Y employees are far less loyal to their employers than previous generations. During further studies it surfaced that Generation Y workers are loyal as long as they can balance work and life goals (Orrell 2009). On top of that,
an important character of their jobs is the ability to gain new learning opportunities and feel as part of the organization’s overall goals (“How Millennial Staff” 2009). In addition to the listed characteristics, Gen Y is known as a risk-averse generation (Beaton 2007/2008) as well as a generation that is looking for a new mix of rewards, such as flexibility and opportunities to engage in socially responsible activities rather than simple salary rewards (Solnet et. al. 2012).
When summarizing all the differences between Gen Y and other generations before in terms of workforce, Solnet & Hood (2008) described Gen Y employees as radically different to previous generations. This description of the Gen Y indicates that their opinions, attitudes and behaviours are essential in shaping an organization and it is crucial for today’s organizations to understand the attitudes and motivators of this new generation of employees (Solnet et. al., 2012).
2.3 Organizational Characteristics and Attractiveness
Organizational attractiveness refers to “the degree to which a person favourably perceives an organization as a place to work” (Rynes et al., 1991, p. 492). Ambler and Barrow (1996) have shown the importance of an organization's image as an employer on the recruitment outcomes. In this regards, the workforce’s perception of employer attractiveness is essential to the success of one’s business in appealing and keeping talents (Williams & Bauer, 1994; Albinger & Freeman, 2000; Berthon et al, 2005). Employer attractiveness in common psychological literature is concentrated on what attracts individuals, or what contributes to the activeness of an employer in terms of certain, often personalized, characteristics (Highhouse et al., 2003; Rentsch & McEwen, 2002; Hoye & Lievens, 2007). Recruitment literature contributes by connecting this approach to the decision of a job applicant in its application (Allen et al, 2007; Hoye & Lievens, 2007). Apart of the differences in the central issues, most researches measure the degree of attractiveness for each person individually (Judge & Cable, 1997; Turban & Greening, 1996). Gen Y’s work-related values and attitudes are associated with human resource management (HRM) strategy, implemented by organizations, and ultimately internal
organizational characteristics, but only if they are aligned with the work values of that specific generation (Solnet et al., 2012). Furthermore, organizational characteristics and HRM strategies have the potential and ability to attract Gen Y employees but only if they are aligned with the work values of that specific generation (Solnet et al., 2012).
Those very organizational characteristics, which are of great importance to the attractiveness of an organization are part of an organization’s culture. A conclusive approach of defining organizational culture was made by Barney (1986), when he described the culture as a “complex set of values, beliefs, assumptions and symbols that define a way in which a firm conducts its business” (p.656). It also defines who its relevant employees are but, more importantly, it defines how an organization interacts with those employees (Louis, 1983). Further literature defines organizational culture according to organizational goals that consists of “all the values, activities, philosophy, ideals, etc of an organization formed” (Nam & Kim, 2016, p.1107). On top of that organizational culture affects the values and the behaviour of every individual engaged with the organization and, therefore, it is of high relevance when it comes to employer attractiveness (Nam & Kim, 2016). Following this description and the attempt to classify aspects of organizational culture into a simplified framework Quinn & Kimberly (1984) laid out a model of organizational culture into four different groups (Fig. 1).
Graph 1: Organizational Cultures by Quinn & Kimberly (1984)
Following the description of Quinn & Kimberly (1984) the first cluster, group culture, is based on internal orientation and values the performance of the collective rather than individual
performance. Additionally, it promotes a collaborative and family-like atmosphere. The second type, hierarchical culture, is as well founded on internal orientation and stresses structure and controllability. Its goal is the organizational stability by structure and control based on hierarchy. It was also discovered that this organizational culture suppresses creativity of its members (Quinn & Kimberly, 1984). In contrast to that stands the third type, development culture, which is grounded on flexibility and openness towards external factors. It promotes an innovation-directed culture with the goal to acquire resources for growth and the development of new business. The last cluster, rational culture, is based on controllability with the aim to achieve rational goals. It emphasizes efficiency and management strongly based on performance. It is seen to be systematic and efficient with the difference of being aware of environmental change and more externally directed than hierarchical culture (Quinn & Kimberly, 1984).
These specific four types of cultures are characterized by specific characteristics which are extensively researched in existing studies. Existing theory defines that job seekers are attracted by a variety of characteristics that mirror the organisational culture. These characteristics of a job and hence the organisation is outlined as: 1) challenging 2) meaningful work 3) training and promotion opportunities 4) employment security 5) friendly colleagues and 6) desirable work environment. Furthermore, there is already existing scientific evidence that supports the theory that organizational characteristics (defined before) have a direct impact on an organization's attractiveness for job seekers (Boswell, Roehling, LePine & Moynihan, 2003; Harris & Fink, 1987; Powell, 1991; Taylor & Bergmann, 1987; Turban, Forret, & Hendrickson,1998).
3 Research Goal
The overall aim of this study is to explore potential connections between an individual's, and more specifically an SIE`s personality traits and his/her preferred organizational characteristics. The study will do so by attempting to answer the following research question:
A SIE of Generation Y matching certain personality traits is looking for which specific features in an organization?
In order to find answers for the formulated research question this study follows a quantitative research approach based on an online survey. Using common theoretical concepts like e.g. the Five factor personality types, this study uses a deductive approach to establish new connections between already existing concepts in the relatively new area of self-initiated expatriation. It is the researcher’s goal to investigate the connections between the different concepts mentioned in existing literature and contribute to theory and practitioners by discovering new connections.
4 Methodology
The following part of this dissertation will explain the selected methodology and research design in order to outline and justify the suitability for this study`s exploratory goal. This paper uses a deductive research approach in order to explore new connections retrieved from existing theory by using collected data. Furthermore, the paper has a strong focus on an explanatory objective in order to find out more about cause and effect – how certain factors come together, interact and form connections. Following the introduction, this paragraph continuous with the definition of the research goal, explaining the sampling and data collection process followed by a description of the conducted data analysis.
4.1 Sample and Data Collection
The survey instrument used in this study is an online questionnaire with a total of n=366 adults participating in this survey. This survey sample is a mixture of a convenient sample (Ritchie & Lewis, 2003) as well as criterion based sampling (Patton, 2002). All the participant need to fulfil the main characteristic in order to be considered for the questionnaire. All people taking part in the survey need to have done at least one experience abroad, which they initiated themselves. This criterion was chosen in order to serve the study`s purpose of investigating the specific group of SIE`s and therefore is essential to the research's validity. Furthermore, the convenience sampling approach eventually defined the scale and scope of this research and a total outcome of n = 366 was seen as sufficient to serve the exploratory purpose of this study. The data collection was initially based in personal contacts as well as spread on several social media pages as well as a university website. On top of that E-mail messages containing the web-link of the online questionnaire were sent to suitable individuals and on top of that the Career Service of Nova SBE shared the web link with Nova´s alumni by E-mail. These activities ensured that the researcher would reach a broad sample as well as achieve sufficient results from the targeted sample. The participants received and answered the survey on Qualtrics, a private research software company enabling users to collect data online and provide an easy way for researchers to conduct online surveys.
Getting further into the details of the sample the data showed that approx. half of the participant were currently employed whereas the other half were unemployed master students at the time of data collection. For the criterion of self-initiated expatriation, it was counted equally whether the participant had an experience abroad while studying or working with the condition that it was self-initiated. The participant’s age averaged at 25 years with an almost equal balance between female and male participants (49.75% female to 50.25% male).
Table 2: Reason for Expatriation
Work experience outside home country and returned (self-initiated decision) 10.5% Currently working outside of home country (self-initiated decision) 21%
Expatriation while studying e.g. exchange semester 68.5%
Furthermore, over half of the participants had a post-graduate degree with a total of 96.5% undergoing or already finished a University degree, what explains the majority of expatriation while studying shown in Table 2.
4.2 Measures
Personality traits: the instrument used to measure the Five personality traits was the TIPI
(Gosling et al., 2003). This measure has ten items: 2 items for each trait, one being the antonym of the other. In this way it provides a conclusive way to assess an individual's personality in the bigger picture of the Five Factor Model. This method was used as a simple as well as cost and time efficient tool to capture the SIE’s personality. The responses of the participants were made through a standard Likert scale of 1-5 (1. Strongly disagree, 2. Moderately disagree, 3. Neither agree nor disagree, 4. Moderately agree, 5. Strongly agree). The question is:
Below is a list of personality traits that may or may not apply to you. On a scale from 1-5, please rate the extent to which the traits apply to you (even if one characteristic is stronger than the other).
§ Extroverted, enthusiastic § Critical, quarrelsome
§ Dependable, self-disciplined § Anxious, easily upset
§ Open to new experiences
§ Reserved, quiet § Sympathetic, warm § Disorganized, careless § Calm, emotionally stable § Conventional, uncreative
As a standard test of reliability, the Cronbach’s Alpha was calculated for the 5 personality traits using the all 10 items of the TIPI scale in SPSS. With a value of 0,254 it is considered to be low regarding internal consistency as shown in Annex 1. Existing literature shows that the TIPI scale is usually low in internal consistency but stronger in content validity considerations and therefore suitable for this research (Gosling, Rentfrow, and Swann Jr., 2003).
Preferred Organizational Characteristics/Company Attractiveness: The participants of the
survey were given a variety of characteristics describing a company's characteristics (Alnıaçık et al., 2012) is needed – see attached paper) and the answers were again collected using a standard Likert scale of 1-5 (1. Strongly disagree, 2. Moderately disagree, 3. Neither agree or disagree, 4. Moderately agree, 5. Strongly agree).
Below are a number of characteristics that may or may not apply to you. On a scale from 1-5, please rate the extent to which the organizational characteristics are important to you.
§ Gaining career-enhancing experience
§ Feeling good about yourself as a result of working for the
organization
§ Acceptance and belonging § Having a good relationship with
superiors
§ The organization value and make use of your creativity
§ Opportunity for promotion § Gaining recognition/appreciation
from management § Job security
§ The organization produces innovative products and service
§ The organization produces high-quality products and services § Opportunity to apply what was
learned at a tertiary institution § The organization is
customer-oriented
§ Having an above average salary § Having an attractive overall
compensation package
§ The organization gives back to society (social causes)
§ Opportunity to teach others what you have learned
§ Having supportive and encouraging colleagues
In order to test the reliability for the organizational characteristics the Cronbach Alpha was calculated for all 18 items and considered strong in terms of internal reliability with a value of 0,824 (Annex 2).
5 Data Analysis and Findings
Different statistical methods were used to detect a potential connection of personality traits and preferred organizational characteristics.
The first step was to transfer the collected data to an excel file in order to facilitate the statistical analysis in SPSS (a software package used for statistical analysis). With the use of SPSS, the gathered data of the survey was analysed regarding a correlation of personality traits and organizational characteristics, using a series of different analysis. The data were analysed by starting with a Factor Analysis, followed by a Rotated Component Matrix for the Personality traits measure (Q1) and the company attractiveness measure (Q12) separately. After the two questions were analysed the outcome in terms of factor groups were then combined in a Cluster Analysis as well as a final Box Plot Analysis. The following graph outlines the order of the statistical analysis and trail of thought of the researcher.
Graph 2: Data Analysis
Starting with Q1 a factor analysis was conducted in order to reduce the large amount of collected information into a model by limiting the dimensions of the observation. In order to
create a clearer and more specific picture of the survey data a factor analysis was preferred due to its different characteristic, compared with a multivariate analysis. The choice of a factor analysis was also based on its characteristic that it groups survey answers that vary together and therefore simplifies the data in a clearer framework. The analysis used in this study focused on the most important factors and therefore factors that did not explain much variance were not included in the final model. In this regard, only the first five factors are selected as significant (Annex 3). Those five factors were than used in the next step of the analysis and are consequently part of this study's analysis.
Following the factor analysis, a rotated component matrix was conducted in order to combine so far undetected characteristics with the five previous selected factors. The aim of this analysis is to give a better understanding in terms of factor features and finally be able to combine characteristics / personality traits of the sample into five different groups. The different groups: 1) Extroversion; 2) Opening; 3) Anxiety; 4) Disinterestedness and 5) Difficulty are further classified and explained in Annex 5.
The obtained five factors of this study’s analysis have clear similarities with the Big Five Factor model mentioned in the theoretical section. In this regards Extraversion corresponds with the “extraversion”, Opening with the “openness to experience”, Anxiety with the “neuroticism”. Furthermore, Disinterestedness corresponds as a reversed item of “Consciousness” and
Difficulty with “agreeableness”. Therefore, the personality items found during this study`s
analysis confirm the dominance of the Big Five Factors from literature in this specific sample.
Moving to Organizational Attractiveness characteristics, the same sequence of tests was conducted as with Q1 before. The factor analysis revealed seven factors that were seen as significant for further tests. Annex 4 shows those seven selected components as significant. Also the rotated component matrix (Table 3) was done in the same steps as exemplified with
Q1 before. Due to the necessity to interpret the data with high quality, this rotated component mix takes only in consideration the selected seven factors of the previous analysis.
As well as for the first questions, the analysis of Q12 resulted in the number of seven different groups of organizational characteristics: 1) Compensation; 2) Membership; 3) Knowledge
Application; 4) Support; 5) Caring; 6) Innovation; 7) Creativity, which are described as
follows.
Table3: Q12 Rotated Component Matrix Results
Component 1 2 3 4 5 6 7 Q12_13 ,872 Q12_14 ,833 Q12_8 ,704 Q12_6 ,570 Q12_4 ,796 Q12_3 ,647 Q12_7 ,621 Q12_1 ,519 Q12_16 ,788 Q12_11 ,786 Q12_19 ,794 Q12_18 ,734 Q12_2 ,759 Q12_15 ,685 Q12_9 ,806 Q12_10 ,696 Q12_5 ,783 Q12_12 ,632
Extraction Method: Principal Component Analysis. Rotation Method: Varimax with Kaiser Normalization.
§ Factor 1_Q12 Compensation describes a more egoistic work environment, which is dominated by factors such as individual salary and job security. In fact, the values .872, .833, .704, .570 correspond to the following answers: “having an above average salary”, “having an attractive overall compensation package”, “job security”, “opportunity for promotion”.
§ Factor 2_Q12 Membership with the following values .796, .647, .621, .519 correspond to the following answers: “having a good relationship with superiors”, “acceptance and belonging”, “gaining recognition/appreciation from management”, “gaining
career-enhancing experience”, hence it describes a work environment that focuses on relationships and integration as well as team spirit.
§ Factor 3_Q12 Knowledge Application describes an organization that embraces a culture of sharing knowledge amongst their employees. In fact, the values .788 and .786 correspond to the following answers: “opportunity to teach others what you have learned” and “opportunity to apply what was learned at a tertiary institution”.
§ Factor 4_Q12 Support describes a work environment that focuses on looking out for each other and aims for a supportive and positive relationship between colleagues, who are willing to share and help each other. In fact, the values .794 and .734 correspond to the following answers: “working in a fun environment” and “having supporting and encouraging colleagues”.
§ Factor 5_Q12 Caring represents an organization, which values the social cause and how their operations can have a better impact on the social environment. In fact, the values .759, .685 correspond to the following answers: “feeling good about yourself as a result of working for the organization”, “the organization gives back to society (social cause)”. § Factor 6_Q12 Innovation indicates that the environment of an organization is dominated by innovative ideas combined with the aim to create high quality services in constant progress. In fact, the values .806 and .696 correspond to the following answers: “the organization produces innovative products and services” and “the organization produces high-quality product and services”.
§ Factor 7_Q12 Creativity describes an organization that wants to make the difference through their new and creative way of thinking. In fact, the values .783 and .632 correspond to the following answers: “the organization values and makes use of your creativity” and “the organization is customer orientated”.
To continue the data analysis, the outcome of the rotated component matrix as well as factor analysis of Q1 and Q12 are then combined in the following cluster and box plot analysis. These two analyses have the aim to find correlation between the identified personality traits and organizational characteristics and serve directly the research question of this study.
The cluster analysis, which goal is to group people within ideal behaviours, was conducted first with the aim to find a connection between the two different factors analysed. In general, a cluster analysis is a tool that tries to discover structures within large amounts of data (Kaufman & Rousseeuw, 2009). In particular, it attempts to identify homogenous groups of cases, e.g.,
characteristics, individuals or certain traits. Because of its explorative nature, it does distinguish differences between dependent and independent variables (Kaufman & Rousseeuw, 2009). In the process of this thesis an initial hierarchical cluster analysis (AHA) with Manhattan Distance and Ward Linkage was conducted in order to choose the number of clusters. With these generated clusters a K-means cluster analysis was used to optimize the outcome and find relevant connections. As the K-mean cluster analysis is a more specific tool designed to assign cases to a fixed number of groups (in this case the personality and organizational factors) it was considered as the suitable analysis to optimize the previous results, generated by the AHA. (Kaufman & Rousseeuw, 2009). Furthermore, the ANOVA table gives a better understanding of the cluster variables. In fact, ANOVA analysis points out the heterogeneity between groups and homogeneity within the groups.
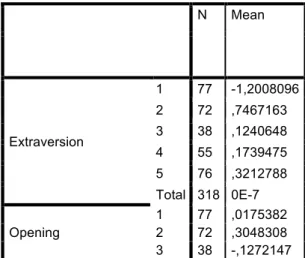
The following tab shows the five obtained clusters with their specific characteristics. The mean column indicates how far above or underneath the average this specific characteristic is in the cluster. Meaning that in cluster one the value mean = -1,2 indicates a strong presence of the reverse characteristic that was tested. Furthermore, table 5 indicates the different personality and organizational factors. In order to identify the significant factors, which form the clusters 1 to5 a level of significance of mean >⎟ 0,7⎟ was chosen.
Table 4: Cluster Analysis Results
N Mean Extraversion 1 77 -1,2008096 2 72 ,7467163 3 38 ,1240648 4 55 ,1739475 5 76 ,3212788 Total 318 0E-7 Opening 1 77 ,0175382 2 72 ,3048308 3 38 -,1272147
4 55 -1,3147474 5 76 ,7085133 Total 318 0E-7 Anxiety 1 77 -,0664041 2 72 ,2185275 3 38 ,2659538 4 55 ,0881677 5 76 -,3365307 Total 318 0E-7 Disinterestedness 1 77 -,2107322 2 72 -,4533172 3 38 1,8054241 4 55 -,4274887 5 76 ,0496182 Total 318 0E-7 Difficulty 1 77 ,3159261 2 72 ,8554692 3 38 ,3363840 4 55 -,5962732 5 76 -,8672060 Total 318 0E-7 Compensation 1 64 -,0497579 2 65 ,0800321 3 30 -,1637458 4 45 ,3028772 5 65 -,1651489 Total 269 0E-7 Membership 1 64 ,0322625 2 65 ,1514423 3 30 -,2286290 4 45 -,0048938 5 65 -,0742994 Total 269 0E-7 Knowledge Application 1 64 -,1750662 2 65 ,2041877 3 30 -,0222789 4 45 ,0357081 5 65 -,0462533 Total 269 0E-7 Support 1 64 -,2000271 2 65 ,2920919 3 30 ,1175519 4 45 -,1108558 5 65 -,0726505 Total 269 0E-7 Caring 1 64 -,0838386 2 65 ,1572302 3 30 ,2969181 4 45 -,2969175 5 65 -,0061623 Total 269 0E-7 Innovation 1 64 ,2354646 2 65 -,0010600 3 30 -,2614922 4 45 -,3632867 5 65 ,1414128 Total 269 0E-7 Creativity 1 64 -,1334653
In the following the final outcome of the cluster analysis is presented, with the five different clusters and their significant factors as identified above.
§ Cluster 1_Introversion: People who are in this cluster are -1,2008096 standard deviation below the mean of the Extroversion factor. Therefore, this cluster tends to be more introverts.
§ Cluster 2_ Entertainment: People who are in this cluster are,7467163 standard deviations above the mean of the Extroversion factor. Therefore, this cluster is more extroverted. Nevertheless, this cluster shows ,8554692 standard deviations above the average of the Difficulty factor and consequently this group tends to be critical and quarrelsome.
§ Cluster 3_ Carelessness: People who are in this cluster are, 1,8054241 standard deviations above the average of the Disinterestedness factor and, therefore, this cluster is more careless.
§ Cluster 4_ Coldness: People who are in this cluster are -1,3147474 standard deviation below the mean of the Opening factor. Therefore, cluster 4 is more closed.
§ Cluster 5_ Easiness: People who are in this cluster are, ,7085133 standard deviations above the average of the Opening factor and therefore cluster five is more outgoing. Moreover, this cluster shows -,8672060 standard deviations below the mean of
Difficulty factor and, consequently, this cluster is easy going.
This outcome implies already that there are no significant values for the analysis of Q12, which are the organizational characteristics. Therefore, the clusters consist of personality traits only, rather than of a combination of personality and organizational factors.
Due to the one-sided outcome of the cluster analysis, which resulted in five different clusters that consist only of personality factors and consequently do not indicate any connection between personality traits and organizational characteristics the researcher decided to conduct a further analysis in order to get a deeper insight in the connection between the different factors
2 65 ,2695836
3 30 -,3594124
4 45 -,1331128
5 65 ,1198660
resulting from Q1 and Q12. In order to achieve the necessary deeper knowledge and insight a Box Plot Analysis was conducted to clarify and maybe detect more hidden connections between the two factors.
A boxplot, also called a box or whisker plot, is a kind of graph used to visualize patterns of quantitative data. A boxplot is a tool used in order to summarize a set of data, which is measured on an interval scale. It is usually used in exploratory data analysis and therefore perfectly suitable for this study’s purpose (Williamson et al.,1989).
After conducting the box plot analysis using the data of the two different factors, personality traits and organizational characteristics, the researcher obtained 12 different box plot charts representing the findings. Analysing the different charts, it became clear that the main findings from the previous cluster analysis could be approved. Again the dominant features of the clusters were found in the personality traits with the same characteristics as previously defined by the cluster analysis. Nevertheless, some additional information was presented by the box plot analysis as introduced as following.
§ Membership:
For the analysis of the environmental responsibility character of an organization the box plot showed that none of the clusters has an above average valuation for this specific characteristic. The mean of all clusters is located either exactly on or very close to the average as already seen in the previous analysis. The further analysis of the box plot with its focus on spread and concentration of the answers shows that in comparison with other organizational characteristics here there is a strong concentration, meaning that there almost do not exist extreme values. Therefore, almost no one values environmental responsibility as a characteristic strongly enough to base a preference on it (Annex 6).
§ Caring:
In the chart of the Caring factor is analysed the importance of the clusters to give back to society by their organization they work for. Here the box plot compliments the previous analysis with the information that in cluster 3 almost no one is more or less than average interested in the character of a potential company to give back to society. Cluster 1, 2 ,4 and 5 have a higher percentage of people that either don’t value or highly value that organizational characteristic, even though the average indicated an indifferent opinion. Cluster 3 sticks out by its high concentration on a slightly valuable position of a company that stands for giving back to society. On the other side in cluster 5 could be identified more extreme outliers than in the other clusters, meaning that people who extremely value or disvalue the character of an organization to give back to society. Compared with the other clusters the box plot for cluster 5 and 3 showed different and an additional information that enables the research to have a deeper understanding of the consistency of the cluster. This additional information was only detected due to the analysis of spread and concentration rather than the single value analysis provided previously (Annex 7).
§ Support:
In the analysis of a preference for a supporting environment within an organization the box plot analysis enabled the researcher to identify a higher concentration in cluster 4 of negative values. The mean is located already negative with a very high concentration of answers at a slightly more negative value. This means that a larger amount of people within cluster 4 are not valuing a supporting environment within an organization as significant to base their preference on. The average implicates already this tendency due to its negativity but the box plot confirms it due to the concentration of the responses (Annex 8).
6 Discussion and Concluding Remarks
This research shows that the sample of generation Y SIE’s can be structured in five different clusters in terms of personality traits. The meaningful finding of this research is that there is no correlation between those personality clusters and organizational characteristics. These two main findings are discussed in detail in the following paragraph along with their impact on current literature and practitioners. As an explorative study with a pilot character the outcomes provide a first insight into a very specific sample of generation Y SIE’s.
Personality Clusters
Even though the main goal of this study was not achieved, it managed to identify patterns in the test pool. Personalities of generation Y individuals, who had at least one self initiated experience abroad can be grouped into five clusters of personality traits. As identified in the study’s analysis the main personality clusters are: Introversion, Entertainment, Carelessness,
Coldness, and Easiness. This may not serve fully as a solution for the research aim but it might
help practitioners to better target individuals. Furthermore, it confirms the dominance and validity of the Five Factor Model in generation Y individuals and therefore helps further research with a starting point in order to compare this specific sample with other samples such as e.g. Generation X or individuals who did not have an international experience. This is a first step in future research and enables comparison studies as well as to identify longitudinal changes and the impact of one’s personality on future career choices.
Organizational Attractiveness
The fact that this study didn’t show any significant preference of individuals for organizational characteristics is a finding of itself. According to this study’s results, it can not be drawn any conclusions that relate specific personality traits to specific company characteristics. In a more simplified way this could lead, based on further research and results, to the conclusion that
companies do not need to project a certain characteristic, culture or image in order to be attractive for a certain pool of individuals with specific characteristics. A company as it is, attracts individuals from each personality cluster in the same way, meaning that the indifference opinion of this specific group of individuals influences the practice in its way to pursue talent. In a different way the study shows that it is a very individual decision what is attractive in a company for a certain individual with a certain personality. Unlike the personality of this sample, which was able to be grouped together in clusters, the preferences for organizations are dominated by a large variety of opinions in each case so that the groups are not significant enough to base a clear direction on it. This does not mean at all that the individual is indifferent to how a company acts and what it represents but that it is not appropriate to say that a group of individuals are more attracted by that. The boxplot shows very clearly that single individuals have a strong opinion about the attractiveness of an organizational characteristic but those opinions even out in an average that presents the cluster as indifferent. Therefore, the outcome and implications for recruiters of this study is that it shows them that an individualized strategy makes more sense in order to find the best fit between personality of an employee and the company’s culture, rather than a mass targeting of certain personality groups such as
Introversion or Easiness. The flipside of that coin is that any effort of a company to shape and
present a certain image in order to attract talent with a certain personality is obsolete. When looked at the group of individuals of generation Y SIEs, it does not matter if a company is e.g. innovative or socially responsible when it aims at attracting talent. The missing connection of personality and organizational characteristics does not guarantee the attraction of a preferred group of individuals in terms of personality.
As potential limitations of this research can be seen that the conclusions, which is drawn from this study needs to be interpreted with a cautious mindset. Firstly, the data used in this study is mainly self-reported data, which comes with the risk of bias. It cannot be guaranteed that the
participant of the online survey answered truthfully and therefore the results could be biased as a consequence. Secondly, the measure used to collect the data, a standard Likert scale, comes with its disadvantages. It can have the effect that participants who are questioned by a Likert scale will avoid the extreme points on the scale and therefore the answers accumulate around a more indifferent answer in general. In this study, as shown by the detailed box plot analysis, this was not the case and the participants also chose the extreme values on the scale. In order to even optimize the research design of further studies it could be used a different scale in the questionnaire.
To sum up this thesis, it is important to understand that the main focus of this work project was to investigate what self-initiated expatriates (SIEs) from generation Y seek in terms of organizational characteristics according to their personality traits. This main goal was partly reached by a clear amount of five different clusters that apply for the pool of generation Y SIEs. On the other hand, it couldn’t be found a clear connection between those personality clusters and organizational characteristics, meaning that no clear preference was matched with a personality cluster. This missing connection was then discussed as a finding itself that helps recruiters in praxis as well as the theory to understand that the preference for organizational characteristics is a highly individual decision, which cannot be grouped together in a cluster and connected with personality traits of generation Y SIEs. Consequently, the outcome is relevant for the current challenges that organizations face while recruiting these SIEs. The initial statement on literature, which names the Generation Y sample individuals as “the hardest of all to recruit” (“Recruiting and the Job Hunt”, 2008) can be approved by this study due to the impossibility to group them in clusters and anticipate their preferences. Furthermore, the pool of SIE’s is quite new research ground and lays the steppingstone for further research to investigate this specific and growing pool of talents in further studies.
7 References
Barney, J. B. (1986). Organizational Culture: Can it be a source of sustained competitive advantage?. The Academy of Management Review, 11(3), 656-665.
Beaton, E. (2007/2008). Generation Y. Profit, 26, 38.
Bhaskar-Shrinivas, P., Harrison, D. A., Shaffer, M. A., & Luk, D. M. (2005). Input-based and timebased models of international adjustment: Meta-analytic evidence and theoretical extensions. Academy of Management Journal, 48(2), 257–281.
Boswell, W. R., Roehling, M. V., LePine, M. A., & Moynihan, L. M. (2003). Individual job-‐ choice decisions and the impact of job attributes and recruitment practices: A longitudinal field study. Human resource management, 42(1), 23-37.
Cattell, R. B. (1943). The description of personality: basic traits resolved into clusters. The
journal of abnormal and social psychology, 38(4), 476.
Ceric, A & Crawford, H. J. (2016), Attracting SIEs: Influence of SIE motivation on their location and employer decisions. Human Resource Management Review 26 (2), p. 136-148 Delery, J. E., & Shaw, J. D. (2001). The strategic management of people in work organizations:
Review, synthesis, and extension. Research in Personnel and Human Resources Management, 20. (pp. 165–197), 165–197.
Doherty, N. (2013). Understanding the self-initiated expatriate: A review and directions for future research. International Journal of Management Reviews, 15(4), 447–469.
Doherty, N., Dickmann, M., & Mills, T. (2011). Exploring the motives of company-backed and self-initiated expatriates. International Journal of Human Resource Management, 22(3), 595– 611.
Doherty, N., Richardson, J., & Thorn, K. (2013). Self-initiated expatriation and self-initiated expatriates. Career Development International, 18(1), 97–112.
Durkin, D. (2008). Youth Movement. Communication World, 25, 23-26.
Ehrhart, M. G., Ehrhart, K. H., Roesch, S. C., Chung-Herrera, B. G., Nadler, K., & Bradshaw, K. (2009). Testing the latent factor structure and construct validity of the Ten-Item Personality Inventory. Personality and Individual Differences, 47, 900–905.
Eysenck, H. J., & Eysenck, M. W. (1987). Personality and individual differences. New York, NY: Plenum.
Gosling, S. D., Rentfrow, P. J., & Swann, W. B. Jr., (2003). A very brief measure of the Big-Five personality domains. Journal of Research in Personality, 37, 504–528.
Goldberg, L. R., Johnson, J. A., Eber, H. W., Hogan, R., Ashton, M. C., Cloninger, C. R., et al. (2006). The international personality item pool and the future of public- domain personality measures. Journal of Research in Personality, 40, 84–96.
Goldberg, L. R. (1992). The development of markers for the Big-Five factor structure. Psychological Assessment, 4, 26–42.
Harris, M. M., & Fink, L. S. (1987). A field study of applicant reactions to employment opportunities: Does the recruiter make a difference?. Personnel Psychology, 40(4), 765-784. Hira, N. A. (2007). You Raised Them, Now Manage Them. Fortune,155, 38.
HR Focus (2008). Recruiting and the Job Hunt are Harder for Employers and Employees. HR Focus, Vol. 85, October, p. 8.
Hymowitz, C. (2007). Managers Find Ways to Get Generations to Close Culture Gaps. Wall Street Journal, July 9, p. B.1.
Inkson, K., Arthur, M.B., Pringle, J., and Barry, S. (1997), ‘Expatriate Assignment Versus Overseas Experience: International Human Resource Development,’ Journal of World
Business, 2, 351 – 368.
Inkson, K., & Myers, B. A. (2003). “The big OE”: Self-directed travel and career development.
Career Development International, 8(4), 170–181.
John, O. P., Donahue, E. M., & Kentle, R. L. (1991). The Big Five Inventory. Berkeley, CA: University of California, Berkeley.
John, O. P., & Srivastava, S. (1999). The Big Five trait taxonomy: History, measurement, and theoretical perspectives. In L. A. Pervin & O. P. John (Eds.), Handbook of personality: Theory and research (2nd ed., pp. 102–138). New York: Guilford.
Jokinen, T., Brewster, C., and Suutari, V. (2008), ‘Career Capital During International Work Experiences: Contrasting Self-Initiated Expatriate Experiences and Assigned Expatriation,’
International Journal of Human Resource Management, 19, 979 – 998.
Kaufman, L., & Rousseeuw, P. J. (2009). Finding groups in data: an introduction to cluster
analysis (Vol. 344). John Wiley & Sons.
Lee, C.H. (2005), ‘A Study of Underemployment Among Self-Initiated Expatriates,’ Journal
of World Business, 40, 172 – 187.
Levine, S. (2008). Commentary: Levine on Leadership. Long Island Business News, April 28, p. 1.
Louis, M. (1983). Culture: Yes. Organization: No. Paper presented at the annual meeting of the Academy of Management, Dallas.
Moynihan, L. M., Roehling, M. V., LePine, M. A., & Boswell, W. R. (2003). A longitudinal study of the relationships among job search self-efficacy, job interviews, and employment outcomes. Journal of Business and Psychology, 18(2), 207-233.
Nam, YooMin, and HakSu Kim. "Influences of Organizational Culture Characteristics on Job Attitudes of Organizational Members in Semiconductor Industry." Procedia Computer Science 91 (2016): 1106-1115.
Noble, S. M., Hytko, D. L., Phillips J. (2009). What drives college-age Generation Y
consumers?. Journal of Business Research, 62, 617-628.
Orrell, L. (2009). In Economic Crisis, Think of the Next Generation. Strategic Communication Management, 13, 7.
Partner’s Report (2009). How Millennial Staff Can Help Your Firm to Get Through the Recession. Partner’s Report, Vol. 9, p. 1-3.
Powell, W. (1991). Expanding the scope of institutional analysis. The new institutionalism in organizational analysis, Chicago, 183-203.
PR Newswire (2008). Focused on the Future: Survey Shows Financial Security Tops List of Generation Y Career Concerns. PR Newswire, February 25, 1.
Quinn, R. E., & Kimberly, J. R. (1984). Paradox, planning, and perseverance: Guidelines for managerial practice. Managing organizational transitions, 2(9), 5-3.
Reed, C. (2007). Generation Y Research: What Makes „Y‟ Tick. Brand Strategy, 5, 38.
Reisenwitz, T. H. & Iyer, R. (2009). Differences in generation x and generation y: Implications for the organization and marketers. Marketing Management Journal, 19 (2), 91-103.
Richardson, J., and Mallon, M. (2005), ‘Career Interrupted? The Case of the Self-directed Expatriate,’ Journal of World Business, 40, 409 – 420.
Richardson, J., and McKenna, S. (2002), ‘Leaving and Experiencing: Why Academics Expatriate and How They Experience Expatriation,’ Career Development
International, 7, 67 – 78.
Richardson, J., and McKenna, S. (2003), ‘International Experience and Academic Careers: What Do Academics Have to Say?’ Personnel Review, 32, 774 – 795.
Richardson, J., and Mallon, M. (2005), ‘Career Interrupted? The Case of the Self-directed Expatriate,’ Journal of World Business, 40, 409 – 420.
Richardson, J., and McKenna, S. (2002), ‘Leaving and Experiencing: Why Academics Expatriate and How They Experience Expatriation,’ Career Development International, 7, 67 – 78.
Richardson, J., and McKenna, S. (2003), ‘International Experience and Academic Careers: What Do Academics Have to Say?’ Personnel Review, 32, 774 – 795.
Richardson, J., and Zikic, J. (2007), ‘The Darker Side of an International Academic Career,’
Career Development International, 12, 164 – 186.
Rynes, S. L., Bretz, R. D., & Gerhart, B. (1991). The importance of recruitment in job choice: A different way of looking. Personnel psychology, 44(3), 487-521.
Shepherd, B. C. (2007). You Get What You Give: Volunteering is Good for Employees ‟ Bodies and Minds”. Employee Benefit News, September 1, p. 1.
Solnet, D. & Hood, A. (2008). Generation Y as hospitality employees: Framing a research agenda. Journal of Hospitality & Tourism Management, 15(4), 59-68.
Solnet, D., Kralj, A. & Kandampully, J. (2012). Generation Y Employees. An Examination of Work Attitude Differences. The Journal of Applied Management and Entrepreneurship, 17(3), 36-53.
Strutton, D., Pelton, L. E. & Ferrell, O. C. (1997). Ethical behaviour in retail settings: Is there a generation gap?. Journal of Business Ethics, 16(1), 87–105.
Suutari, V., & Brewster, C. (2000). Making their own way: International experience through self-initiated foreign assignments. Journal of World Business, 35(4), 417–436.
Suutari, V., & Taka, M. (2004). Career anchors of managers with global careers. The Journal
of Management Development, 23(9), 833–847.
Turban, D. B., Forret, M. L., & Hendrickson, C. L. (1998). Applicant attraction to firms: Influences of organization reputation, job and organizational attributes, and recruiter behaviors. Journal of Vocational Behavior, 52(1), 24-44.
Taylor, M. S., & Bergmann, T. J. (1987). Organizational recruitment activities and applicants' reactions at different stages of the recruitment process. Personnel Psychology, 40(2), 261-285. Tyler, K. (2007). The Tethered Generation. HRMagazine, 52, 40-47.
Zaptçıoğlu Çelikdemir, D. & Tukel, I. (2015). Incorporating ethics into strategic management with regards to generation y’s view of ethics. Procedia - Social and Behavioural Sciences, 207, 528 – 535.
ANNEX:
Annex 1: Cronbach’s Alpha for Personality Traits 5 Items (including reversed Items)
Annex 2: Cronbach’s Alpha for Organizational Characteristics Items, all 18 Items
Annex 4: Q12 Factor Analysis Results
Annex 5: Q1 rotated component matrix results
Q1 Rotated Component Matrixa
Component 1 2 3 4 5 Q1_6 -,844 Q1_1 ,832 Q1_10 -,810 Q1_5 ,707 Q1_4 ,861 Q1_9 -,804 Q1_8 ,792 Q1_3 -,790 Q1_2 -,824 Q1_7 ,571
Extraction Method: Principal Component Analysis. Rotation Method: Varimax with Kaiser Normalization
§ Factor 1_Q1 Extraversion, as the highest value is the positive result of .832, which corresponds to the answer of “extroverted, enthusiastic”.
§ Factor 2_Q1 Opening, as the highest value is the sum of the two positive results of .707 and .428, which correspond to the answers of “open to new experience” and “sympathetic warm”.
§ Factor 3_Q1 Anxiety, as the highest value is the positive result of .861, which corresponds to the answer of “anxious, easily upset”.
§ Factor 4_Q1 Disinterestedness, as the highest value is the negative result of .792, which corresponds to the answer of “disorganized, careless”.
§ Factor 5_Q1 Difficulty, as the highest value is the negative result of -.824, which corresponds to the answer of “critical, quarrelsome”.
Annex 7: Box Plot for Organizational Characteristic: Caring