I
Desenvolvimento, validação e aplicação da fórmula Golden
Index para a análise individual dos futebolistas em fase
ofensiva
Identificação dos Golden Players do Club Atlético de Madrid
2016/2017
Tiago Alexandre Pontes Pereira
III
Desenvolvimento, validação e aplicação da fórmula Golden
Index para a análise individual dos futebolistas em fase
ofensiva
Identificação dos Golden Players do Club Atlético de Madrid
2016/2017
Dissertação apresentada à Faculdade de Desporto da Universidade do Porto, com vista a obtenção do grau de Mestre em Ciências do Desporto, com especialização em Treino de Alto Rendimento Desportivo (Decreto lei nº 74/2006, de 24 de Março, alterado pelo decreto lei nº107/2006 de 25 de Junho e pelo decreto lei nº 230/2009 de 14 de Setembro)
Orientador: Professor Doutor Daniel Barreira Co-orientador: Mestre João Ribeiro
Tiago Alexandre Pontes Pereira
IV
Ficha de Catalogação
Pereira, T. (2018).Desenvolvimento, validação e aplicação da fórmula Golden
Index para a análise individual dos futebolistas em fase ofensiva. Identificação
dos Golden Players do Club Atlético de Madrid 2016/2017. Porto: Tiago Pereira. Dissertação para obtenção do grau de Mestre em Treino de Alto Rendimento Desportivo, apresentada à Faculdade de Desporto da Universidade do Porto.
Palavras-chave: PERFORMANCE INDIVIDUAL, FUTEBOL, ATAQUE,
V
Agradecimentos
Nestes últimos dois anos, a vida encarregou-se de demonstrar-me o que é saber viver. Passados, após sair da minha zona de conforto, sem nunca ignorar quem tanto batalhou para que atingisse os meus objetivos, agradeço, com carinho:
Ao professor Doutor Daniel Barreira, professor orientador da minha tese. Pela moldagem dos meus pensamentos, pelos conselhos e dedicação. Obrigado por demonstrar-me o verdadeiro sentido da palavra “orientar”, obrigado por deixar-me explorar e orientar-me nesse sentido. Se tivesse que o adjetivar seria “exemplo de excelência”, fruto da sua “serenidade, foco e sacrifício…”
Ao doutorando João Ribeiro, professor co-orientador da minha tese. Obrigado pela disponibilidade, demonstração de enorme sabedoria e pela ajuda em todos os momentos desta etapa. Estarei para sempre grato.
Ao professor Filipe Grilo pela participação fundamental neste trabalho. Obrigado pela sensibilidade e ajuda em qualquer situação. Muito obrigado.
Aos peritos, professores e treinadores que responderam aos questionários. Um especial agradecimento aos professores do Gabinete de Futebol da Faculdade de Desporto da Universidade do Porto. Obrigado pela atenção e disponibilidade.
Aos meus amigos Leandro Pimenta, Ismael Freitas, Tomás Quintal, Marcelo Pestana, Henrique Andrade, Humberto Baptista, Leandro Soares, Alexandre Nunes, João Pedro Ferreira, Vitor Hugo, Luis Sousa, Giorjines Boppre (Alemão), João Martins, que, mesmo à distância, estiveram sempre presentes. Obrigado pelo companheirismo, apoio e conselhos fantásticos.
À Dona São, pelos conselhos e carinho que tanto me deu e dá. Obrigado à minha segunda família, por terem-me recebido tão bem e terem-me tornado em mais um elemento da vossa família.
Às minhas irmãs Patrícia e Sofia e aos meus cunhados Fábio e Filipe pelos conselhos, pelas lembranças nostálgicas, que mesmo à distância, foram sempre relembradas.
VI
Aos meus sobrinhos pelo sorriso puro e inocente que relembra-me todos os dias o propósito da vida.
Aos meus avós Geraldina e Adelino e aos meus tios Pedro e Deolinda, por terem sido os meus segundos pais, em terem-me proporcionado condições para atingir esta etapa. A gratidão estará sempre presente, jamais me esquecerei do que fizeram por mim.
Aos meus pais, Dolores e Adelino. Por terem-me proporcionado tudo o que sou hoje, por terem-me apoiado em tudo e em todos os momentos. Cada pessoa “puxa a brasa à sua sardinha”, mas, a admiração sentida por eles é inexplicada. Um muito obrigado a estes dois guerreiros.
À Carla. Entraste na minha vida e completaste-a. Tornaste-te no meu maior apoio e sempre estiveste, estás e estarás presente nas minhas tomadas de decisão. Obrigado por seres quem és, hoje e sempre…
VII
Índice Geral
Agradecimentos ... V Índice Geral ... VII Índice de Figuras ... IX Índice de Quadros ... XI Índice de Equações ... XIII Índice de Anexos ... XV Resumo ... XVII Abstract ... XIX Lista de Abreviaturas ... XXI
Capítulo 1 Introdução Geral ... 1 1.1. Problema ... 8 1.2. Objetivos ... 9 1.3. Estrutura da tese ... 10 Capítulo 2 Estudos ... 13 Estudo 1 ... 17 Estudo 2 ... 39 Capítulo 3 Discussão Geral ... 67 Capítulo 4 Conclusões ... 79 Capítulo 5 Referências bibliográficas ... 87 Capítulo 6 Anexos ... 97
IX
Índice de Figuras
Capítulo 2 Estudo 1
Figure 1. Stages taken in the development and validation of the Golden Index formula………...23
XI
Índice de Quadros
Quadro 1. Lista de Abreviaturas ... XXI
Capítulo 1
Quadro 2. Capítulos da dissertação ... 11 Quadro 3. Artigos incluídos na dissertação ... 15
Capítulo 2 Estudo 1
Table 1. Description of the Golden Index formula variables ... 23 Table 2. Characterization of the board of Football experts ... 26 Table 3. Experts’ answers regarding the variables of the Golden lndex formula ... 26 Table 4. Weight of the variables composing the Golden Index formula,
organized by the mean ... 28 Table 5. Steps developed for the standardization of the Golden Index formula variables ... 29 Table 6. Observed games of Club Atlético de Madrid in 2016/2017 season .... 30 Table 7. Club Atlético de Madrid 2016/17 players’ ranking using Golden Index formula ... 31
Estudo 2
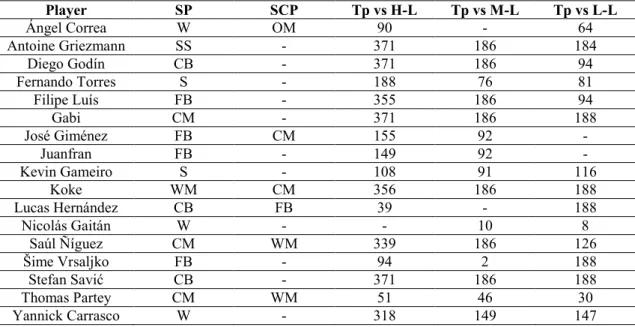
Table 1. Observed games of Club Atlético de Madrid in 2016/2017 season .... 46 Table 2. Specific tactical positions of Club Atlético de Madrid in 2016/2017 season players ... 47 Table 3. Steps developed for the standardization of the Golden Index formula variables (adapted from Pereira, Barreira, Ribeiro and Grilo20) ... 49 Table 4. Club Atlético de Madrid 2016/17 players’ ranking in the matches with high-level opponents using the Golden Index formula ... 50 Table 5. Club Atlético de Madrid 2016/17 players’ ranking in the matches with medium-level opponents using the Golden Index formula ... 51 Table 6. Club Atlético de Madrid 2016/17 players’ ranking in the matches with low-level opponents using the Golden Index formula ... 53
XIII
Índice de Equações
Capítulo 2 Estudo 1
Golden Index Formula……….30
Estudo 2
XV
Índice de Anexos
Anexo I. Fórmula Golden Index………XXIII
Anexo II. Passos desenvolvidos para estandardização das variáveis da fórmula
Golden Index………..………...XXV
Anexo III. Questionário desenvolvido para validação e determinação do peso
das variáveis da fórmula Golden Index………...XXIX
Anexo IV. Vencedores dos prémios dados pela Revista France Football, desde
XVII
Resumo
O presente estudo teve como objetivos: i) desenvolver e validar uma nova fórmula chamada
Golden Index (GI) destinada a classificar os jogadores na fase ofensiva do jogo no futebol; ii)
aplicar a fórmula GI ao Club Atlético de Madrid (ATM) na temporada desportiva 2016/2017, com o propósito de identificar e classificar os jogadores mais importantes (Golden Players) na fase ofensiva da equipa. Selecionaram-se doze variáveis referentes às ações tático-técnicas dos jogadores em fase ofensiva, recorrendo a dois tipos de Análise: Notacional e de Redes Sociais. O primeiro artigo deste trabalho reflete todos os procedimentos metodológicos com vista a validar todas as componentes da fórmula GI, através do recurso a um questionário facultado a 13 peritos em futebol. Com consenso (≥75%), validou-se e mensurou-se o peso de cada variável incluída na fórmula, sendo que para uma correta normalização de cada variável, utilizou-se a técnica estatística de estandardização. A partir da sua aplicação a oito jogos do ATM 2016/2017 pretendeu-se: i) identificar e classificar os Golden Players em fase ofensiva (artigo 1), e ii) investigar a influência da variável situacional “qualidade do adversário”, na performance individual dos jogadores em fase ofensiva (2º artigo). Os resultados indicaram o jogador Koke, médio ala, como o elemento mais importante da equipa, apresentando uma grande influência e centralidade na rede de passes da equipa, e com um elevado número de assistências. Por outro lado, os resultados do segundo artigo confirmaram a influência da variável “qualidade do adversário” na performance individual dos jogadores. Assim, observaram-se oscilações nos índices dos jogadores, tendo o Koke atingido o índice mais elevado com adversários de nível alto. O jogador Antoine Griezmann, segundo avançado, obteve valores mais elevados contra adversários de nível médio e baixo, tendo uma elevada preponderância em etapas de finalização, refletido pelo número de remates e golos, evidenciando também uma maior participação no processo ofensivo da equipa. Deste modo, a fórmula GI afigura-se um instrumento válido e útil para a análise da performance individual dos jogadores em fase ofensiva no Futebol, incorporando informação quantitativa e objetiva, permitindo assim complementar as análises subjetivas. Esta fórmula revelou-se sensível no processo de identificação e classificação dos jogadores com maior preponderância no processo ofensivo, contribuindo assim para o sucesso de uma equipa, podendo ser, atendendo ao seu carácter genérico, aplicada a qualquer contexto da fase ofensiva do jogo de Futebol.
PALAVRAS-CHAVE: PERFORMANCE INDIVIDUAL, FUTEBOL, ATAQUE, FÓRMULA GOLDEN INDEX, CLUB ATLÉTICO DE MADRID
XIX
Abstract
The objective of this study was twofold: i) first, to develop and validate a novel formula called Golden Index (GI) aimed to classify players’ individual performance in the attacking sub-phases of play in football; ii) second, to apply the GI formula to Club Atlético de Madrid (ATM) in the 2016/2017 season, to identify the most important players in the attacking sub-phases of play. Twelve variables were selected regarding the tactical-technical actions of players performed in the attacking sequences of play, collected through the implementation of two techniques, namely: Notational Analysis and Social Network Analysis. The first article of this work reflects all the methodological procedures that were used to validate all the components of the GI formula, through the use of a questionnaire provided to 13 football experts. The questionnaire was validated with consensus (≥75%), and the weight of each variable was measured. For the correct normalization of each variable we have used the statistical technique of standardization. From the application of the GI formula to eight matches of ATM in the 2016/2017 season, we aimed to: identify and classify the Golden Players in the offensive phase of the game (article 1), and; to investigate the influence of the situational variable “quality of the opposition” in players’ individual performance in the offensive phase of the game (article 2). The results indicated the player Koke, wide midfielder, as the most important player of the team, presenting high influence and centrality in the network of passes, and with a high number of assists. On the other hand, the results of the second article were able to confirm the conditioning effect exerted by the “quality of the opposition” on players’ individual performance. In this regard, there were oscillations in the players’ indexes, with Koke attaining the highest index when competing with high-level opponents. Antoine Griezmann, second striker, was considered the best player against middle- and low-level opponents exhibiting a high preponderance in scoring zones, reflected by the number of shots and goals achieved, also showing a greater participation in the attacking process of the team. Thus, the GI formula can be viewed as a valuable and useful tool for analysing players’ individual performance in the attacking sub-phases of play in Football, incorporating quantitative and objective information, allowing to complement other subjective analyses. The GI formula has proved to be sensitive in identifying and classifying players with the highest level of participation in the offensive phase of the game, thus contributing to the success of a team, being able, considering its generic nature, to be applied in any context of the offensive phase of the game in football.
KEYWORDS: INDIVIDUAL PERFORMANCE, FOOTBALL, ATTACK, GOLDEN
XXI
Lista de Abreviaturas
Quadro 1. Lista de Abreviaturas
Abreviatura Nome
A Assists
ATM Club Atlético de Madrid
BC Betweenness Centrality BL Ball losses CB Centrebacks CM Centre Midfielders DB Successful Dribbles (1x1) FB Fullbacks GI Golden Index H-L High-level teams
IRC Influence range: closeness centrality
L-L Low-level teams
M-L Medium-level teams
OM Offensive Midfielders
PCr Positive Crosses
PPer Passes performed
PR Page Rank Prestige
PRec Passes received
RB Running with the Ball
S Strikers
SCP Secundary Position
SocNetV Social Network Visualizer
SP Specific Position
SS Second Strikers
Tp Time Played
W Wingers
1
Capítulo 1
3
Introdução Geral
No futebol, desde 1956, os jogadores com maior desempenho individual e coletivo têm sido galardoados com o troféu Bola de Ouro através da revista
France Football (France Football, 2018). Neste sentido, até ao ano de 2017,
numa análise individual a cada vencedor, é observada uma tendência para a valorização de jogadores com vocação mais ofensiva numa equipa, verificando-se que 65% dos premiados corresponderam a avançados, 27% dos premiados foram médios, 6% defesas e somente 2% guarda-redes, segundo a revista France Football (2018)1 [Anexo IV].
A fase ofensiva assume-se como a fase fundamental do jogo de futebol, visto que nesta ocorre o objetivo principal do jogo: o golo (Hughes & Bartlett, 2002). Desta forma, existe uma tendência para a valorização dos jogadores que mais contribuem para este efeito (He, Cachucho & Knobbe, 2015).
Assim, alguns investigadores têm procurado obter mais conhecimento sobre a fase ofensiva do jogo, delineando estudos que objetivam observar e identificar padrões comportamentais subjacentes à obtenção do golo (Pratas, Volossovitch & Carita, 2018; Castelão, Garganta, Afonso & Costa, 2015), efetuando também uma análise individual da performance dos jogadores de modo a identificarem qual ou quais jogadores se afiguram mais preponderantes nestes momentos do jogo (Duch, Waitzman & Amaral, 2010; Malta & Travassos, 2014).
Contudo, contrariamente a desportos como o basquetebol (Berri, 1999) ou o basebol (Koop, 2001), no que concerne ao uso de técnicas estatísticas como métodos de quantificação da contribuição individual de um jogador para a sua equipa, os investigadores ainda apresentam alguma relutância em aplicá-las na modalidade de futebol. A sua escassa utilização é explicada por Mackenzie e Cushion (2013) que referem que dados estatísticos básicos, como golos e/ou assistências, contribuem parcialmente dando informação útil para o
1
O prémio Bola de Ouro é dado, desde 1956, pela revista France Football. Contudo, entre os anos de 2010 e 2015, a FIFA e a revista France Football unificaram-se na entrega ao prémio, denominando assim um novo conceito: Bola de Ouro da Fifa (FIFA Ballon d´Or). A partir de 2016, a FIFA voltou a identidade independente na entrega do prémio aos melhores jogadores do ano, criando a cerimónia anual The Best FIFA Football Awards (Federação Internacional de
4
delineamento do processo de treino e/ou identificação dos jogadores com maior influência numa equipa ou competição (Schultze & Wellbrock, 2018). Duch, Waitzman e Amaral (2010) indicam que para uma abordagem flexível à real medição do desempenho individual de um jogador, a quantidade de indicadores de performance deve ir além de um panorama estatisticamente parcial.
Portanto, entende-se que, devido ao elevado número de interações de cooperação existentes entre os membros de uma equipa (McLean, Salmon, Gorman, Read & Solomon, 2017), à variabilidade comportamental observada no jogo de futebol (Muller, Upmann & Prinz, 2013) e à constante relação de oposição entre os futebolistas das duas equipas, o futebol assume-se como um desporto com um panorama multifacetado (Pereira, 2005), tornando-se difícil medir a produtividade de um jogador. Sincronicamente, alguns autores, como Barreira (2013), defendem a análise de variáveis situacionais, tal como o nível do adversário (Liu, Gómez, Gonçalves & Sampaio, 2016), para se efetuar uma mais profunda interpretação da performance individual, respeitando e integrando as suas particularidades posicionais (Pina, Paulo & Araújo, 2017).
Condicionantes das ações individuais no Futebol
Uma das principais decisões estratégicas no futebol é o posicionamento da equipa e respetivos jogadores no campo (Sampaio & Maçãs, 2011). Desse modo, Hughes et al. (2012) e Liu, Gómez, Gonçalves e Sampaio (2016) referem que cada jogador de uma equipa tem a sua função específica, associada a cada posição tática específica, com um propósito comum: fazer a equipa obter sucesso.
De facto, é aceite que existam comportamentos habitualmente observados para determinadas posições, tal como demonstrado no estudo de Razali, Mustapha, Yatim e Aziz (2017), quando verificaram que os avançados efetuavam um maior número de remates, enquanto que Gioldasis, Souglis e Christofilakis (2017) observaram que os defesas centrais apresentavam uma função ofensiva limitada, realizando poucos dribles e/ou remates
5
comparativamente às restantes posições, acrescentado que estes evidenciam uma elevada função de equilíbrio e segurança defensiva. Porém, Liu, Gómez, Gonçalves e Sampaio (2016), ao analisarem 380 jogos da La Liga 2012-2013, de três equipas do topo e três equipas de baixo da tabela classificativa, identificaram igualmente diferenças entre os jogadores das mesmas posições táticas específicas. Estes autores (2016) verificaram, a título de exemplo, que os defesas centrais das equipas do topo da tabela apresentavam uma maior participação na fase ofensiva do jogo, contrariamente aos defesas centrais das equipas do fim da tabela classificativa, devido ao maior número de passes, assistências e remates efetuados.
Tiedemann, Francksen e Latacz-Lohmann (2010) confirmam que a base de comparação entre dois jogadores será sempre restringida pelas suas funções específicas na equipa. Portanto, é consensual que cada jogador, condicionado pelas suas referências espaço-temporais (Clemente, Martins, Mendes & Figueiredo, 2014), apresente, segundo Razali et al. (2017), diferentes habilidades que podem variar de acordo com:
i) condicionantes estruturais: diferentes funções específicas, moldadas pelo sistema de jogo da equipa (Castelo, 1996);
ii) condicionantes funcionais: perceção e análise das situações de jogo: relação direta com adversário e companheiros de equipa (Quina, 2001).
A análise individual do Futebolista: conceitos e metodologias
O futebol é assumida como uma modalidade imprevisível, em que os seus acontecimentos não podem ser determinados antecipadamente, por isso o fator estratégico-tático assume-se de elevada preponderância (Garganta & Gréhaigne, 1999).
Portanto, não obstante se considerarem e estudarem quatro fatores de rendimento para o estudo dos jogadores numa escala individual (Castelo, 2002; Garganta, 1997), nomeadamente: i) físicos (Leite, 2016), ii) técnicos (Faude, Koch & Meyer, 2012), iii) táticos (Gonzalez-Rodenas, Lopez-Bondia, Calabuig, James & Aranda, 2015) e iv) psicológicos (Orosz & Mezo, 2015), existe uma
6
tendência para os fatores técnico e tático se sobreporem aos demais, uma vez que o primeiro problema colocado aos jogadores durante um jogo assume-se de natureza estratégico-tático (Mombaerts, 1996).
Desse modo, nos últimos anos têm surgido novos conceitos que procuram conceptualizar e determinar os jogadores com maior preponderância na fase ofensiva em Futebol, avaliando-os de acordo com as suas ações tático-técnicas: jogador chave (key player) ou jogador influente (Castelo, 2004; Malta & Travassos, 2014).
Gama (2013) e Malta e Travassos (2014) consideram o jogador chave (key player) aquele que apresenta maior influência na fase ofensiva da equipa, contribuindo para uma maior circulação da posse de bola. Castelo (2004) classifica o jogador influente como o que apresenta uma maior intervenção no resultado das ações do jogo de futebol.
Perante isto, através da observação de quatro jogos de uma equipa da Liga Portuguesa 2011/2012, Malta e Travassos (2014) reconheceram os jogadores Médio Defensivo e Ponta de Lança como os elementos com maior influência na transição ofensiva da equipa, apresentando estes uma maior tendência para receberem a bola através da implementação de um jogo indireto (e.g. passe curto/apoio lateral) e jogo direto (e.g. passo longo/apoio lateral em zonas avançadas), respetivamente. Também, Correa (2017), a partir da observação das sequências terminadas em golo do Futbol Club Barcelona em duas temporadas distintas (2011-2012 e 2014-2015), identificou o jogador Lionel Messi como o elemento mais influente da equipa, tendo este obtido o maior número de passes efetuados e recebidos, contribuindo igualmente para o sucesso da equipa através da marcação de um elevado número de golos.
A Análise de Redes Sociais tem-se assumido como um método explorado para a avaliação, análise e interpretação dos comportamentos de equipas e jogadores de Futebol de acordo com os conceitos supramencionados. Esta análise permite registar os passes feitos por uma determinada equipa através da utilização de uma matriz de adjacência (Clemente, Couceiro, Martins & Mendes, 2014; Clemente et al., 2016), com posterior importação dos dados para softwares especializados de análise de
7
redes sociais (e.g SocNetV), possibilitando assim uma análise das propriedades estruturais evidenciadas pela equipa a uma escala individual e global (Kalamaras, 2014). Assim, este método foca-se sobretudo na análise das interações dos jogadores através da troca de passes (Lusher, Robins e Kremer, 2010), considerando-se um método inovador já que permite complementar os métodos tradicionais (e.g Análise Notacional) utilizados para análise individual no futebol (Bartlett, Button, Robins, Dutt-Mazumder & Kennedy, 2012).
A quantificação e a visualização das interações dos jogadores na complexa rede de passes da equipa, permite, segundo Passos, Davids, Araújo, Paz, Minguéns e Mendes (2011), fornecer parâmetros qualitativos a treinadores, para que estes obtenham informação sobre os jogadores mais ou menos envolvidos no processo ofensivo, através da interpretação visual da rede de passes da equipa e dos valores relativos às métricas de centralidade (Grund, 2012). Contudo, autores como Barbosa, Sarmento, Neto, Anguera e Campaniço (2014) e Correa (2017) evidenciam que o passe e as métricas da Análise de Redes (e.g. coeficiente de intermediação, coeficiente de proximidade ou page rank prestige), não devem ser vistas como os únicos fatores discriminatórios para a determinação do real contributo de um jogador, já que a Análise de Redes Sociais, assim como outras técnicas de análise, apresenta limitações que podem eventualmente inibir a sua aplicabilidade.
Uma dessas limitações remete para o facto de apenas incidir na análise da ação técnica do passe. Não obstante a relevância deste indicador, durante o jogo de futebol os jogadores recorrem a outros recursos técnicos que se afiguram de igual modo importantes (e.g drible e condução de bola). Atendendo a esta particularidade, também têm sido realizados estudos que procuram entender o papel individual de um jogador na fase ofensiva de jogo de uma equipa, através da utilização de outros comportamentos tático-técnicos, tais como remates e dribles (Mazurek, 2018).
Por outro lado, Duch et al. (2010) propuseram um novo conceito chamado flow centrality, com o objetivo de captar a influência de um determinado jogador na equipa, aplicando esta métrica no Campeonato da
8
Europa UEFA 2008. Ao combinarem informação referente ao fluxo de passes e à precisão de remate, estes autores obtiveram dados interessantes, capturando a fração de vezes que um jogador interveio nas sequências que terminaram em remate.
Em 2010, Tiedemann, Francksen, e Latacz-Lohmann, ao agruparem diversas variáveis (e.g. golos, assistências, passes completos e interceções), calcularam a performance de um jogador, inferindo que fatores externos, tais como os adversários e os colegas, poderiam influenciar a performance individual. Mais recentemente, Szczepanski (2015) indicou que este tipo de abordagem à performance individual poderá ser útil na análise retrospetiva do contributo de um jogador, contudo, aparenta não apresentar utilidade preditiva devido ao carácter imprevisível do jogo de futebol.
Em resumo, nos últimos anos, inerente ao avanço tecnológico, surgiram índices que avaliam quantitativamente a performance dos jogadores de Futebol (e.g. Instat index, 2007; WhoScored Rating, 2008; Sico index, 2014; GoalPoint
Rating, 2014), através do acoplamento de dados relativos aos respetivos
comportamentos tático-técnicos individuais e coletivos, tais como golos, assistências, remates, passes ou dribles. Contudo, embora estes apresentem diferenciação relativamente a análises isoladas de alguns estudos e estatísticas, como por exemplo o número de golos com diferentes partes do corpo (Dariuz, 1986; Mais Futebol2), o seu uso para mensuração da performance individual de um jogador aparenta não apresentar validação científica, que permitem afirmar a qualidade dos dados obtidos, já que os critérios de fiabilidade dos dados e mensuração de cada variável não são conhecidos.
1.1. Problema
Havendo uma tendência de sobrevalorização da parte mais objetiva do ataque, utilizado-se variáveis como remates, golos ou assistências, e, por isso, dos jogadores que mais contribuem para o efeito, desvalorizando-se os
2
9
acontecimentos e comportamentos precedentes (Barreira, 2013), torna-se primordial que os treinadores e investigadores obtenham informação abrangente a vários jogadores de uma equipa. Isto é, a todo o desenvolvimento do processo ofensivo tendo, por exemplo, a identificação dos jogadores com maior preponderância na ligação entre setores e jogadores através da interpretação das métricas de passe associadas à análise de redes sociais de uma equipa (Ribeiro, Silva, Duarte, Davids & Garganta, 2017). Do mesmo modo, entendendo-se cada elemento como uma “peça” fundamental no sistema de jogo da equipa e, consequentemente, para o respetivo sucesso, torna-se igualmente essencial reunir informação referente a outras ações tático-técnicas para a análise da produtividade dos jogadores de uma forma mais ampla, tais como drible (Razali et al., 2017), condução de bola (Faude, Koch & Meyer, 2012) ou cruzamento (Lago-Ballesteros & Lago-Peñas, 2010).
Por conseguinte, a falta de validação dos índices utilizados na identificação e classificação dos jogadores de futebol, a análise isolada e descontextualizada de algumas variáveis/estatísticas que procuram explicar a performance individual na fase ofensiva, bem como a carência na utilização de variáveis situacionais para explicação da performance individual (e.g. nível do adversário), assumem-se como fatores vitais para o desenvolvimento deste trabalho.
Deste modo, a criação de um instrumento válido e objetivo para a análise do contributo individual de um jogador na fase ofensiva do jogo, é vista como um desafio ao atual conhecimento relativo à performance individual no Futebol.
1.2. Objetivos
Pretendeu-se, com este trabalho, desenvolver procedimentos com vista ao cumprimentos dos seguintes objetivos:
- Desenvolver e validar uma fórmula chamada Golden Index destinada a identificar e classificar os jogadores na fase ofensiva do jogo de Futebol.
10
- Aplicar a fórmula Golden Index ao Club Atlético de Madrid na temporada 2016/2017, com o propósito de: i) identificar os jogadores mais importantes (Golden Players) da equipa na fase ofensiva, em termos gerais; e ii) investigar a influência da variável situacional “qualidade do adversário” na performance individual dos jogadores, indagando a aplicabilidade da fórmula para obter dados objecitvos e conclusivos sobre a performance individual em relação com variáveis contextuais.
1.3. Estrutura da tese
A tese foi dividida em 6 capítulos:
1) O primeiro capítulo será composto pela Introdução Geral, sendo realizada uma revisão geral sucinta da literatura, referindo a sua pertinência, e onde delimitamos o problema e os objetivos da tese.
2) No segundo capítulo, serão inseridos os dois estudos efetuados sob a forma de artigos científicos. O primeiro artigo deste trabalho reflete todos os procedimentos metodológicos desenvolvidos com vista ao desenvolvimento e validação da fórmula Golden Index, realizando-se uma aplicação prática da mesma ao Club Atlético de Madrid (ATM) na temporada 2016/2017. No segundo artigo deste trabalho, procura-se investigar a influência da variável situacional “qualidade do adversário” na performance individual dos jogadores,
3) No terceiro, surge a Discussão Geral, apresentando-se a inovação do estudo, as principais conclusões referentes à identificação dos Golden Players do Club Atlético de Madrid na época 2016/2017, assim como, aos condicionamentos referentes à qualidade do adversário na performance individual dos jogadores de futebol.
4) No quarto capítulo serão apresentadas as conclusões, a aplicabilidade prática do trabalho e as suas limitações.
5) No quinto capítulo, serão colocadas as referências bibliográficas. 6) Finalmente, no sexto e último capítulo, serão apresentados quatro Anexos.
11
Quadro 2. Capítulos da dissertação
1 Introdução, Problema, Objetivos e Estrutura da Tese
2
Estudo 1: Golden Index: a novel method that classifies players’
performance in the Football attacking plays
Estudo 2: Is Football players’ performance influenced by the quality of
opposition? Application of the Golden Index formula in Club Atlético de Madrid 2016/2017
3 Discussão Geral
4 Conclusões, Aplicabilidade Prática, Limitações e futuros estudos 5 Referências bibliográficas
6
Anexos
I. Fórmula Golden Index
II. Passos desenvolvidos para estandardização das variáveis da formula
Golden Index
III. Questionário desenvolvido para validação e determinação do peso das
variáveis da fórmula Golden Index
IV. Vencedores do prémio Bola de Ouro dado pela Revista France Football, desde 1956 a 2017.
13
Capítulo 2
15
Estudos
No presente capítulo, são inseridos dois estudos sob a forma de artigos científicos, em estado “submetido”.
O primeiro artigo deste trabalho reflete todos os procedimentos desenvolvidos com vista a desenvolver e validar a fórmula Golden Index, efetuando-se para isso a aplicação prática deste instrumento científico ao Club Atlético de Madrid época 2016/2017, identificando-se e classificando-se os jogadores mais importantes na fase ofensiva (i.e. Golden Players).
O segundo artigo apresenta a aplicação da fórmula Golden Index ao Club Atlético de Madrid 2016/17, com nuances diferentes. Isto é, respeitando-se a variável situacional “nível dos adversário” como possível influenciadora da performance individual dos futebolistas. Pretendeu-se, assim, analisar como a performance individual poderá ser influenciada pela qualidade dos adversários, identificando-se os Golden Players da equipa jogando contra adversários: i) de nível alto; ii) de nível médio; e iii) de nível baixo.
Quadro 3. Artigos incluídos na dissertação
Estudo 1 Golden Index: a novel method that classifies players’ performance
in the Football attacking plays
Artigo submetido à revista Proceedings of the Institution of
Mechanical Engineers, Part P: Journal of Sports Engineering and Technology
Estudo 2 Is Football players’ performance influenced by the quality of
opposition? Application of the Golden Index formula in Club Atlético de Madrid 2016/2017
17
Estudo 1
Título
Golden Index: a novel method that classifies players’ performance in the Football attacking
plays
Autores Tiago Pereira; Daniel Barreira; João Ribeiro; Filipe
Grilo
Artigo submetido na Revista
Proceedings of the Institution of Mechanical Engineers, Part P: Journal of Sports Engineering and Technology
19
Original Article
Title: Golden Index: a novel method that classifies players’ performance in the Football
attacking plays
Tiago Pereiraa, Daniel Barreiraa,b*, João Ribeiroa,b, Filipe Griloc
a
Faculty of Sport, University of Porto, Porto, Portugal; bCentre of Research, Training, Innovation and Intervention in Sport (CIFI2D), University of Porto, Portugal; cFaculty of Economy, University of Porto, Porto, Portugal
* Corresponding author Daniel Barreira
Faculty of Sport, University of Porto, Porto, Portugal
Centre of Research, Training, Innovation and Intervention in Sport (CIFI2D), University of Porto, Portugal
Rua Dr. Plácido Costa, 91, 4200-450, Porto, Portugal
E-mail: dbarreira@fade.up.pt
Funding Acknowledgements
We gratefully acknowledge the support of two Spanish government projects (Ministerio de Economía y Competitividad): (1) La actividad física y el deporte como potenciadores del estilo de vida saludable: Evaluación del comportamiento deportivo desde metodologías no intrusivas (Grant number DEP2015-66069-P); (2) Avances metodológicos y tecnológicos en el estudio observacional del comportamento deportivo (PSI2015-71947-REDP); and the support of the Generalitat de Catalunya Research Group, Grup de Recerca i Innovació en Dissenys (GRID). Tecnología i aplicació multimedia i digital als dissenys observacionals (Grant number 2014 SGR 971).
Disclosure statement
20
Abstract
In this study, we sought to create a formula called Golden Index (GI) that allows assigning an index to each player according to its individual and collective performance. This method allows identifying the most important players, designated as Golden Players, in the football attacking play.
This study was organized in two main phases: 1) selection, definition, and validation, including weighting assignment, of a set of variables associated to players’ performance, through application of statistical techniques to uniformize variables values, that compose the GI formula; and 2) applicability of the GI formula to quantify players’ performance of Club Atlético de Madrid (ATM) 2016-17 season.
At first, a questionnaire was applied to football experts in order to validate and determine the weight of each of the twelve variables selected. Descriptive statistics with standardization techniques were used to set the weights and uniformize each variable of the GI formula.
The applicability of the GI formula to ATM 2016/17 indicated Koke, Yannick Carrasco and Filipe Luís as the Golden Players.
Results suggested that GI formula is a valuable and useful tool in capturing the individual and collective performance of players in the attacking play in football.
Keywords
Soccer, Golden Index formula, Golden Player, Individual performance, Network analysis, Club Atletico de Madrid.
21
Introduction
Football (soccer) comprises one of the most difficult sports to analyse quantitatively due to the inherent complexity and continuous dynamics that characterises the game flow.
Although important, simple statistics like the number of shots or passes provide a partial picture of a player’s true impact on a given match and/or competition. Thus, several studies1,2,3,4,5
have already started to implement other measures, such as the betweenness centrality and closeness centrality, to help clarifying the real contribution of a given player.
Numerous studies use social networks to assess the performance of players within teams6. Through the application of concepts and tools derived from other scientific domains (e.g., graph theory), the network approach allows identifying the most influential players of a social structure (e.g., a football team) according to a set of established measures that provide information about the ranking of importance assigned to each player on a team 4. However, such studies have been using different definitions for identifying the most important players, with some applying the concept of influential player, i.e. the one who intervenes more in the result of the game actions 3,7, while others used the concept of key player, understood as the one of the most dominant players, having a great impact on team dynamics and orchestration of game actions 8. Moreover, the key player presents a significant influence on the attacking construction phase, contributing mostly to the ball-passing network (i.e. the player who receives and performs more passes)7. Thus, network centrality metrics such as betweenness centrality and closeness centrality1, page rank prestige 8, out-degree and in-degree centrality 9, have been utilised to identify the key player of a team 10.
Despite the relevance of embracing the network theory to investigate the interaction patterns displayed in attacking sequences of play, the analysis of such patterns is frequently limited only to ball-passing actions. However, in football, there are other important technical actions (e.g., dribble) that players frequently perform over the attacking sub-phases of play. In this way, Barbosa, Sarmento, Neto, et al.11 investigated the dynamics of Real Madrid Club de Fútbol, and verified that passing and ball receiving actions were associated with the attack construction phase, whilst crossing, shooting and dribbling were related with the finalization stage of the attack 12.
Hence, several indexes have been extensively used in performance analysis programs 13,14,15,16 to classify and characterise football players. Although the importance of these statistics, such analysis is based on simple annotation and recording of separated and decontextualized performance indicators like the number of assists and/or goals scored. Consequently, other studies 17,18 proposed other indexes that enable the quantification of players’ individual contribution in relation to team success. However, to the best of our knowledge, there is no evidence of scientific validation regarding the existent indexes, neither those that have used network-centrality metrics to evaluate individual performance based on ball-passing events. Furthermore, Eugster 5 refers that combining different variables might be an adequate approach to evaluate players’ individual performances in which regards the overall team performance. Therefore, we highlight that an accurate selection, definition, and validation of variables can be applied to define the
22
Golden Index (GI) formula, thus allowing to ascertain hierarchically (i.e., according to the assignment of different weights) the players of a given team or competition.
It is noteworthy to mention that gathering data detailing the individual performance of players, also considering its contribution to collective performance, may aid coaches and match analysts to better optimise the team selection or even to enhance scouting methods 19. Given the aforementioned, this study intends: i) to develop and validate a novel method called Golden Index; and ii) to apply the Golden Index formula to an elite professional club, to identify and classify the individual contribution of each player in the attacking sub-phases of play.
Methods
This study was organized according to two main phases: 1) selection, definition, and validation, including weighting assignment, of a set of variables associated to players’ individual and collective performance, through application of statistical techniques to uniformize variables values, that compose the GI formula; and 2) applicability of the GI formula to quantify players’ performance over Club Atlético de Madrid (ATM) 2016-17 season.
Phase 1: Development and validation of the Golden Index formula
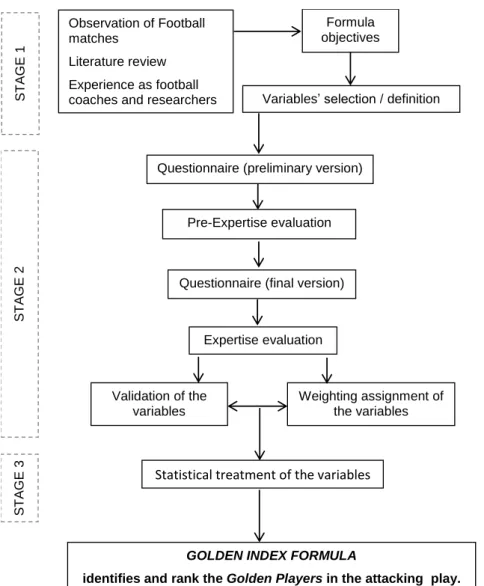
The validation process of the variables followed the logic used in previous works 20,21. GI formula development encompassed three stages (Figure 1):
Stage 1. selection and definition of the variables composing the formula. Here, we also developed the validation questionnaire concerning the proposal of the formula content;
Stage 2. validation of the variables and respective weighting assignment by football experts; and Stage 3. statistical treatment of the set of variables validated by the survey application to experts.
23
Figure 1. Stages taken in the development and validation of the Golden Index formula
Stage 1. Selection of the Golden Index formula content
The selection of GI formula content was based on previous studies (see Table 1), and in literature review about the concepts of key player 22 and influential player 3,7.
In Table 1 are listed the studies that have used the variables included in the GI formula.
Table 1. Description of the Golden Index formula variables
Variables Studies that used the variables Description
1. Assists 24,25,26 An attacking player perform a pass or a positive cross to a teammate, that shoot to the opponent goal
23.
2. Ball losses 23,25 The ball carrier loses the ball through: i) infraction of the game laws; ii) intervention of the opponent;
Observation of Football matches
Literature review Experience as football
coaches and researchers Variables’ selection / definition
Weighting assignment of the variables Validation of the
variables
Statistical treatment of the variables
Formula objectives
Questionnaire (preliminary version)
Pre-Expertise evaluation
Expertise evaluation
GOLDEN INDEX FORMULA
identifies and rank the Golden Players in the attacking play.
Questionnaire (final version)
S T A G E 1 S T A G E 2 S T A G E 3
24
iii) technical error; iv) throwing the ball to off the pitch; v) action of the opponent's goalkeeper 23. 3. Betweenness
Centrality
1, 8, 27,30 Allows to check the number of connections of 2
players that pass through 1 player. That is, it counts the number of times that 1 player acts as an intermediary along the 2-player connection in the pass variable 8
4. Goals 23, 24, 25, 28 An attacking player scores a goal. The ball passes over the opponent goal line, between the goalposts and under the crossbar, with no previously violation of the laws of the game 23
5. Influence range closeness centrality
8,29
Allows to check the distance on the network between players. Note: Higher values indicate that a player is close to connecting with other players in the pass variable 8
6. Page Rank Prestige
8, 29 A value is given concerning to the participation of
a player in the pass variable compared to other players of the same team. Note: Higher values indicate that a player has high probability of receiving the ball 8
7. Passes performed
8, 23, 25, 26, 31, 32, 33, 34 The ball carrier transmits effectively the ball to a
teammate, maintaining the ball possession 23 8. Passes
received
8, 23, 26, 31, 33 The ball carrier passes the ball to a teammate
whose controls the ball, providing the continuity of the attack 23
9. Positive crosses
23, 26, 31 The ball carrier placed in the lateral path of the
offensive sector (attacking quarter of the field) transmits effectively the ball to a teammate positioned in the central path (penalty area), either on the ground or in the air, providing the attack continuity 23
10. Running with the ball
23, 26, 35 The ball carrier performs at least three consecutive
touches with the ball, progressing in the pitch space, providing the continuity of the attack 23 11. Shots 1, 23, 24, 25, 26, 28, 32 An attacking player shot to the opponent´s goal,
occurring one of the four situations: i) ball passes over the goal line, going to out of the pitch; ii) ball hits the target, with a save of the opponent´s
25
goalkeeper or touch the crossbar or goalposts; iii) shot hits an opposing player, teammate or referee 23 12. Successful
dribbles (1x1)
23, 25, 26, 28, 33, 34, 36 The ball carrier dribbles the direct opponent(s)
getting advantage of time and space, providing the continuity of the attack 23
Most of the aforementioned variables were retrieved from the study of Barreira et al. 23, with the exception of the three related to the network approach, namely: i) Page Rank Prestige; ii) Betweenness Centrality; and iii) IR: Closeness Centrality. These network measures were calculated through the software Social Network Visualizer (SocNetV) v.2.3. The time played per player by using the ratios method was considered, because ratios method allows to obtain more concrete and conclusive information, contrarily to the absolute values 36.
Stage 2. Validation of the Golden Index formula content
Currell and Jeukendrup38 mentioned two fundamental criteria to consider in the construction of an instrument to evaluate performance, namely: validity and reliability.
Concerning to validation of the selected variables (stage 1), the procedures used by Prudente et al. 20 and Barreira et al. 21 were followed. In this regard, a questionnaire was developed and applied comprising a research technique composed by a set of questions presented to a group of experts in order to determine their opinion about a specific domain 39.
The survey was developed permitting to be answered online or personally, and to not exceed 10 minutes until completion. The questionnaire was structured in three parts:
i. identification of the respondents;
ii. attribution of the importance and the weight of each of the variables included in the GI formula;
iii. evaluation of the survey by the respondents.
a) Pre-expertise evaluation (questionnaire preliminary version)
Before achieving the final structure of the survey, a pre-expertise evaluation was applied. In this stage two coaches with more than 10 years of experience and UEFA-B accreditation, were selected to answer the preliminary survey in order to detect possible errors in its construction and to clarity the used concepts 21. Also, this step was applied to ascertain the average time needed to complete the questionnaire
37, and to provide suggestions to improve the instrument. Results estimated a maximum of 10 minutes to
complete the questionnaire. Furthermore, both coaches provided positive feedback and suggestions that were used to improve the organization and the vocabulary of the survey. The final version of the questionnaire was found after being reviewed several times by the authors.
26
b) Expertise evaluation (questionnaire final version)
Validation stage requires the application of the survey to football experts to validate the formula content and to assign the weight of each of the selected variables. The board of specialists was selected according to the following criteria (adapted from Barreira et al. 21) (Table 2):
1. UEFA-B accreditation or higher. Also, complying two of the following conditions: i. Coach experience in the second division league or higher;
ii. Master or higher academic degree with specialization in Football; iii. Ten or more years of professional experience in Football.
Table 2. Characterization of the board of Football experts
Coach UEFA License Experience as Coach
Academic degree Professional experience in Football
1 IV (UEFA PRO) International Doctorate 30
2 II (UEFA B) Youth Master 16
3 II (UEFA B) 1st league Doctorate 10
4 III (UEFA A) 2nd league Graduation 28
5 III (UEFA A) 1st league High School 20
6 II (UEFA B) 1st league Doctorate 15
7 III (UEFA A) National team Doctorate 31
8 IV (UEFA PRO) National team Doctorate 27
9 IV (UEFA PRO) 1st league Master 15
10 II (UEFA B) 3rd league Master 15
11 IV (UEFA PRO) International Graduation 22
12 III (UEFA A) Youth Doctorate 30
13 IV (UEFA PRO) 1st league Graduation 40
After being identified, the respondents were solicited to answer several questions, structured in two sections: i) passing behaviours and the correspondent individual and collective variables, with the variables: betweenness centrality, IR: closeness centrality, page rank prestige, in/outdegree centrality); and (ii) variables apart passing measures, namely assists, ball losses, goals, positive crosses, running with the ball, shots and successful dribbles (1x1). In all the questions the experts were asked to refer the importance of the variables by using a 1 to 5 Likert scale 40, with 1 corresponding to “nothing important” and 5 to “extremely important” (Table 3).
Table 3. Experts’ answers regarding the variables of the Golden lndex formula
Variables Likert Scale (1 to 5)
1 2 3 4 5 PRec/tp 0 1 4 5 3 PPer/tp 0 1 3 5 4 PR/tp 0 3 3 4 3 BC/tp 0 1 5 5 2 IRClos/tp 0 4 2 4 3 Positive crosses/tp 0 0 2 8 3
27
Running with ball/tp 1 0 8 3 1
Ball losses/tp 1 1 5 3 3
Dribbles/tp 0 0 3 6 4
Assists/tp 0 0 0 7 5
Shots/tp 0 0 3 9 1
Goals/tp 0 0 2 5 6
Legend: PRec: Passes received; PPer: Passes performed; PR: Page Rank Prestige; BC: Betwenneess centrality; IRClos: Influence range: Closeness centrality; tp: time played.
A cohort value of 75% was applied 21. That is, 10 of the 13 experts should consider their answers at least in level 3 of likert scale, thus considering the variable important to be included in the GI formula. All variables achieved a value higher than 75%, excepting the “Influence Range (IR): Closeness centrality”, with 69% of the obtained answers. However, we decided to maintain this variable in the Gl formula due to: i) its importance in identifying the player(s) closest to teammates in the passing network, meaning that he/she may have suitable conditions for receiving a pass or even to perform defensive balance in case of ball lost 41; and ii) the value obtained (69%) is adjacent to the applied cohort value. Because this concept has been recently applied in Football, the experts possibly didn’t understand it precisely, thus possibly having difficulties in filling the survey via online 42,43. Note that only one expert filled the survey personally.
In the last stage of the survey, experts were asked to suggest a designation to the first-rate player(s) to be found by the GI formula; to evaluate the importance of the method; and to propose new variables to include in the formula. In relation to the designation for the formula and for the first-rate players in the attacking play, the Golden Player was the selected. Also, experts were asked to suggest variables that could be important to improve the formula proposal. Here, 7 (54%) of the 13 experts did not announce any variable. The remaining experts mentioned seven variables, namely: second ball gain; rupture and support movements (front or side) in the attacking midfield; attacking game organiser; variables not related to the ball; unbalance; speed of execution; intensity of actions. We think that these variables could be redundant to the ones proposed, and their inclusion would make the formula difficult to apply because data seems hard to collect or obtain.
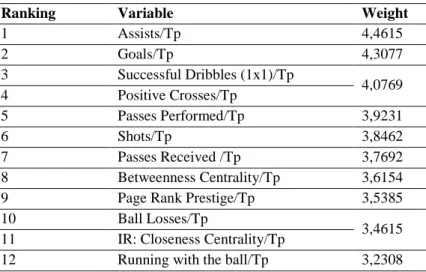
To determine the weight of each of the variables (n=12), experts were asked to rate each variable from (1) nothing important to (5) extremely important. Descriptive statistics were used to set the mean of the experts' responses (n=13) regarding each of the twelve variables. Huot 44 defined descriptive statistics as a set of techniques that summarize the information collected on a sample or population without losing information. So, the determination of the variables weight, consulting the panel of experts, is necessary since it allows verifying the variables that contributes more to find the Golden Player (Table 4).
28
Table 4. Weight of the variables composing the Golden Index formula, organized by the mean
Ranking Variable Weight
1 Assists/Tp 4,4615 2 Goals/Tp 4,3077 3 Successful Dribbles (1x1)/Tp 4,0769 4 Positive Crosses/Tp 5 Passes Performed/Tp 3,9231 6 Shots/Tp 3,8462 7 Passes Received /Tp 3,7692 8 Betweenness Centrality/Tp 3,6154
9 Page Rank Prestige/Tp 3,5385
10 Ball Losses/Tp
3,4615 11 IR: Closeness Centrality/Tp
12 Running with the ball/Tp 3,2308
Legend: Tp: time played; ir: influence range.
Experts considered the variable assists as the most important, followed by goals, successful dribbles (1x1) and positive crosses. Between the fifth and tenth rank, we verified four variables associated with the pass: passes performed, passes received, betweenness centrality and page rank prestige. The variables ball losses, IR: closeness centrality and running with the ball were the variables identified with less weight.
The reliability of the questionnaire was performed based on the analysis of the experts' answers. For this purpose, Cronbach's alpha was used, with values ranging between 0 and 1, with 1 indicating high confidence, as a measure to determine the internal consistency of the questionnaire 45. Using the IBM SPSS v24 software, the consistency of the respondents (n=13) was verified, thus presenting a moderate value of 0.704.
Stage 3. Statistical treatment of the formula variables
After the validation and weight assignment of the variables composing the GI formula, the ratio of the variables and their standardization was established using statistical techniques.
i) Ratio of the variables
Simple variables quantities (passes performed, passes received, assists, ball losses, goals, positive crosses, running with ball, shots, and successful dribbles (1x1)), divided by the time played per player were included as well as the network variables, (betweenness centrality; IR: closeness centrality; and page rank prestige, in/outdegree centrality). For each attacking sequence, an adjacency matrix, with all team players represented in an “n x n” system, was constructed 3, for a total of 503 sequences. The sum of all matrices
resulted in a global adjacency matrix representing the total interactions performed by players during competition. After that, the total number of passes received and performed, displayed in the adjacency matrix, was divided by the individual time played (for each player), multiplied by 1000.
After this procedure, the adjacency matrix was imported to the Social Network Visualizer (SocNetV, v2.3.) to compute the values of the network metrics.
29
ii) Standardization of the variables
Standardization or normalization of a variable is a technique commonly used in descriptive statistics 46. This technique consists in the transformation of a variable so that it can be refocused and redistributed quantitatively without losing information, with a mean of 0 and a standard deviation of 1 for all the variables being studied.
The individual values are subtracted from the mean and divided by the standard deviation of the variable 47, thus preventing the dispersed quantities to interfere with the results, since, for example, the difference between passes performed (65% of the technical actions occurring in a game, according to Leitão 48 and shots (10% of the attacks ending with a shot, according to Castelo 7 is high in the majority of the cases.
Table 5. Steps developed for the standardization of the Golden Index formula variables
Steps Name Description Formula
1 Mean of each variable on the team (𝑋1)
Values of each individual player, after being added up, and divided by the number of players.
𝑋1 =∑𝑥 𝑛 ∑𝑥: sum of the
values of each player
𝑛: number of players
2
Difference between the player's ratio and the mean of the team in each variable (𝑋2)
The player's individual value is measured by subtracting his ratio value for the mean of the team in the variable (1), obtaining negative or positive values, being below or above the mean of the team in the variable
𝑋2 = 𝑋𝑜 − 𝑀
Xo: player's ratio in the variable
M: mean of the variable
3
Standard deviation of the values of all team players for each variable (S)
The determination of the standard deviation (S) of the variable allows verifying the measure of dispersion relative to the means. This can only assume non-negative values, and the greater its value, the greater is the dispersion of the sample.
𝑆 = √∑(𝑥𝑖 − 𝑥)
2
𝑛 − 1
Xi: value at position i in the data
X: mean of the data n-1: amount of data minus 1
4 Standardization of each variable (Z)
The value of the player (2) is subtracted by the mean value of all players for each variable (1), divided by the standard deviation of all players for each variable (3).
𝑍 =𝑥 − 𝜇 𝜎 𝑥: value of the player (2) μ: mean of all players in the variable (3) 𝜎: standard deviation of the players in the variable (4)
30
Essentially, the Gl formula (1) results from multiplying the weights given by the experts for each of the standardized variables, followed by adding up each variable, except for the variable Ball losses that presented a negative weighting.
Golden Index Formula
𝐺𝑂𝐿𝐷𝐸𝑁 𝐼𝑁𝐷𝐸𝑋 = 4,4615 ∗ ( 𝐴𝑠𝑠𝑖𝑠𝑡𝑠 𝑇𝑖𝑚𝑒 𝑝𝑙𝑎𝑦𝑒𝑑) + 4,3077 ∗ ( 𝐺𝑜𝑎𝑙𝑠 𝑇𝑖𝑚𝑒 𝑝𝑙𝑎𝑦𝑒𝑑) + 4,0769 ∗ (𝑆𝑢𝑐𝑐𝑒𝑠𝑠𝑓𝑢𝑙 𝐷𝑟𝑖𝑏𝑏𝑙𝑒𝑠 𝑇𝑖𝑚𝑒 𝑝𝑙𝑎𝑦𝑒𝑑 ) + 4,0769 ∗ ( 𝑃𝑜𝑠𝑖𝑡𝑖𝑣𝑒 𝐶𝑟𝑜𝑠𝑠𝑒𝑠 𝑇𝑖𝑚𝑒 𝑝𝑙𝑎𝑦𝑒𝑑 ) + 3,9231 ∗ ( 𝑃𝑎𝑠𝑠𝑒𝑠 𝑝𝑒𝑟𝑓𝑜𝑟𝑚𝑒𝑑 𝑇𝑖𝑚𝑒 𝑝𝑙𝑎𝑦𝑒𝑑 ) + 3,8462 ∗ ( 𝑆ℎ𝑜𝑡𝑠 𝑇𝑖𝑚𝑒 𝑝𝑙𝑎𝑦𝑒𝑑) + 3,7692 ∗ ( 𝑃𝑎𝑠𝑠𝑒𝑠 𝑟𝑒𝑐𝑒𝑖𝑣𝑒𝑑 𝑇𝑖𝑚𝑒 𝑝𝑙𝑎𝑦𝑒𝑑 ) + 3,6154 ∗ ( 𝐵𝑒𝑡𝑤𝑒𝑒𝑛𝑛𝑒𝑠𝑠𝐶𝑒𝑛𝑡𝑟𝑎𝑙𝑖𝑡𝑦 𝑇𝑖𝑚𝑒 𝑝𝑙𝑎𝑦𝑒𝑑 ) + 3,5385 ∗ (𝑃𝑎𝑔𝑒 𝑅𝑎𝑛𝑘 𝑃𝑟𝑒𝑠𝑡𝑖𝑔𝑒 𝑇𝑖𝑚𝑒 𝑝𝑙𝑎𝑦𝑒𝑑 ) − 3,4615 ∗ ( 𝐵𝑎𝑙𝑙 𝐿𝑜𝑠𝑠𝑒𝑠 𝑇𝑖𝑚𝑒 𝑝𝑙𝑎𝑦𝑒𝑑) + 3,4615 ∗ ( 𝐼𝑅:𝐶𝑙𝑜𝑠𝑒𝑛𝑒𝑠𝑠 𝐶𝑒𝑛𝑡𝑟𝑎𝑙𝑖𝑡𝑦 𝑇𝑖𝑚𝑒 𝑝𝑙𝑎𝑦𝑒𝑑 ) + 3,2308 ∗ (𝑅𝑢𝑛𝑛𝑖𝑛𝑔 𝑤𝑖𝑡ℎ 𝑏𝑎𝑙𝑙 𝑇𝑖𝑚𝑒 𝑝𝑙𝑎𝑦𝑒𝑑 )
Phase 2: Applicability of the Golden Index formula to rank players’ performance of Club Atlético de Madrid in the 2016-17 season
All ATM 2016/17 opposing teams were grouped into three levels: a) high level (teams playing in the UEFA Champions League and classified from 1st to 3rd place in La Liga); b) medium level (teams classified between 4th and 13th place in La Liga); and) low level (teams classified between 14th and 20th place in La Liga). Such division was adapted from Liu, Gómez, Gonçalves et al. 49 and Schultze and Wellbrock 18.
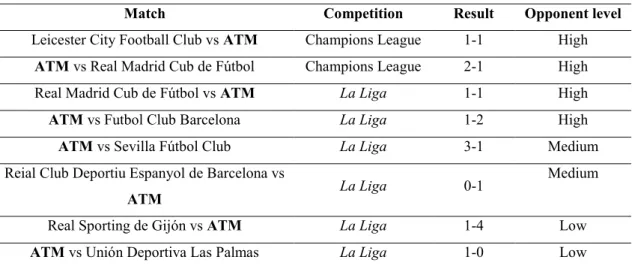
The GI procedures were followed, being observed ATM players’ performance in a total of 8 matches played in 2016/17 season, with the exception of the Goalkeepers due to their reduced participation in the attacking play 1 and their restricted positioning on the field.
Table 6. Observed games of Club Atlético de Madrid in 2016/2017 season
Match Competition Result
Leicester City Football Club vs ATM Champions League 1-1
ATM vs Real Madrid Cub de Fútbol Champions League 2-1
Real Madrid Cub de Fútbol vs ATM La Liga 1-1
ATM vs Futbol Club Barcelona La Liga 1-2
ATM vs Sevilla Fútbol Club La Liga 3-1
Reial Club Deportiu Espanyol de Barcelona vs ATM La Liga 0-1
Real Sporting de Gijón vs ATM La Liga 1-4
ATM vs Unión Deportiva Las Palmas La Liga 1-0
Legend: La Liga: Spanish League; ATM: Club Atlético de Madrid
31
Results
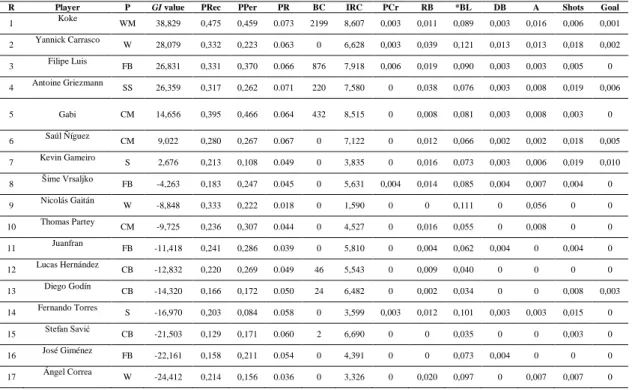
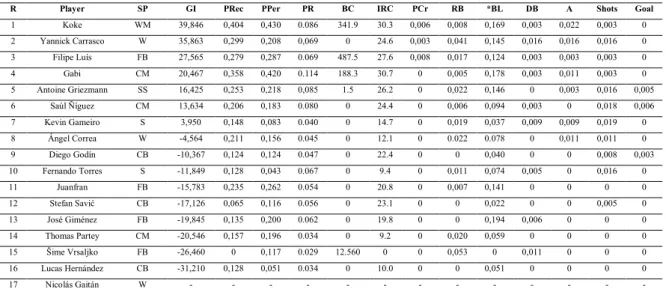
The results of the GI formula application to ATM are organized by ranking, and have identified the players Koke (GI value: 38,829), Yannick Carrasco (GI value: 28,079) and Filipe Luís (GI value: 26,831) as the Golden Players of the team. Thus, we will focus our analysis on the above referred three players.
Table 7. Club Atlético de Madrid 2016/17 players’ ranking using Golden Index formula
R Player P GI value PRec PPer PR BC IRC PCr RB *BL DB A Shots Goal
1 Koke WM 38,829 0,475 0,459 0.073 2199 8,607 0,003 0,011 0,089 0,003 0,016 0,006 0,001 2 Yannick Carrasco W 28,079 0,332 0,223 0.063 0 6,628 0,003 0,039 0,121 0,013 0,013 0,018 0,002 3 Filipe Luis FB 26,831 0,331 0,370 0.066 876 7,918 0,006 0,019 0,090 0,003 0,003 0,005 0 4 Antoine Griezmann SS 26,359 0,317 0,262 0.071 220 7,580 0 0,038 0,076 0,003 0,008 0,019 0,006 5 Gabi CM 14,656 0,395 0,466 0.064 432 8,515 0 0,008 0,081 0,003 0,008 0,003 0 6 Saúl Ñíguez CM 9,022 0,280 0,267 0.067 0 7,122 0 0,012 0,066 0,002 0,002 0,018 0,005 7 Kevin Gameiro S 2,676 0,213 0,108 0.049 0 3,835 0 0,016 0,073 0,003 0,006 0,019 0,010 8 Šime Vrsaljko FB -4,263 0,183 0,247 0.045 0 5,631 0,004 0,014 0,085 0,004 0,007 0,004 0 9 Nicolás Gaitán W -8,848 0,333 0,222 0.018 0 1,590 0 0 0,111 0 0,056 0 0 10 Thomas Partey CM -9,725 0,236 0,307 0.044 0 4,527 0 0,016 0,055 0 0,008 0 0 11 Juanfran FB -11,418 0,241 0,286 0.039 0 5,810 0 0,004 0,062 0,004 0 0,004 0 12 Lucas Hernández CB -12,832 0,220 0,269 0.049 46 5,543 0 0,009 0,040 0 0 0 0 13 Diego Godín CB -14,320 0,166 0,172 0.050 24 6,482 0 0,002 0,034 0 0 0,008 0,003 14 Fernando Torres S -16,970 0,203 0,084 0.058 0 3,599 0,003 0,012 0,101 0,003 0,003 0,015 0 15 Stefan Savić CB -21,503 0,129 0,171 0.060 2 6,690 0 0 0,035 0 0 0,003 0 16 José Giménez FB -22,161 0,158 0,211 0.054 0 4,391 0 0 0,073 0,004 0 0 0 17 Ángel Correa W -24,412 0,214 0,156 0.036 0 3,326 0 0,020 0,097 0 0,007 0,007 0
Legend: R. Ranking; P: Position; WM: Wide Midfielder; W: Winger; FB: Fullback; SS: Second Striker; CM: Centre Midfielder; S: Striker; CB: Centreback; GI: Golden Index; PRec: Passes Received; PPer: Passes Performed; PR: Page Rank Prestige; BC: Betweenness Centrality; IRC: Influence Range: Closeness Centrality; PCr: Positive Crosses; *BL: Ball losses (this value appears with a negative connotation, thus, the higher the value, the final índex gets worse); RB: Running with the Ball; DB: Successful Dribbles (1x1); A: Assists; Goal: Goals
The GI values indicated that Koke (wide midfielder) is the Golden Player of the team in the attacking plays. Koke obtained the best indexes concerning to network metrics, as he obtained high ratios on the four variables associated with the pass: passes received (PRec: 0,475), page rank prestige (PR:0.073), betweenness centrality (BC: 2199), and IR: closeness centrality (IRC: 8.607). Koke was also considered the second player of the team with most passes performed (PPer: 0,459) and assists (A: 0,016) per time played.
In second position appears Yannick Carrasco (winger), presenting the highest ratios of the team on the following variables: successful dribbles (1x1) (DB: 0,013) and running with the ball (RB: 0,039). This player also obtained higher values in the variables goals (Goal: 0,002), shots (Shots: 0,018), assists (A: 0,013), and positive crosses (PCr: 0,003). Notwithstanding, he obtained the highest value in the variable ball losses (BL: 0,121).