A Work Project, presented as part of the requirements for the Award of a Master Degree in Finance from the NOVA – School of Business and Economics.
Role of Mortgage Backed Securities in a Diversified Portfolio under the Mean- Variance framework
Benedikt Benthin, 3323 (27602)
A Project carried out on the Master in Finance Program, under the supervision of: Prof. Melissa Prado
Table of Contents
1. Introduction ... 1
2. Literature Review ... 4
2.1. Theory of the Mean-Variance Optimization ... 4
2.2. Asset Classes ... 7
2.2.1. Financial Assets ... 7
2.3. Real Estate Investment Vehicles ... 10
2.3.1. Overview of the Real Estate Market ... 11
2.3.2. Direct Real Estate Investments ... 12
2.3.3. Real Estate Investment Trusts ... 13
2.3.4. Diversification Potential and Limitation of Real Estate Investments ... 15
2.3.5. Real Estate During the Financial Crisis ... 16
2.4. Mortgage Backed Securities ... 17
2.4.1. Overview and Origin of Mortgage Backed Securities ... 17
2.4.2. Valuation of Mortgage Backed Securities ... 22
2.4.3. Overview of Structured Mortgage Instruments ... 26
2.5. The Financial Crisis and the Role of Mortgage Backed Securities ... 29
2.5.1. Circumstances Leading to the Financial Crisis ... 30
2.5.2. System of Perverse Incentives during the Financial Crisis ... 34
3. Data Analysis ... 40
3.1. Market Analysis ... 40
3.1.1. Securitized Mortgage Market... 40
3.1.2. Subprime Market Performance during the Financial Crisis ... 42
3.1.1. Collateralized Mortgage Obligations Market Analysis ... 43
3.1.2. Commercial Mortgage Backed Securities Market Analysis ... 45
3.1.3. Real Estate Market Analysis ... 47
3.1.4. Real Estate Investment Trust Market Performance ... 47
3.1.5. Comparison of Direct and Indirect Property Markets ... 49
3.1.6. Performance of a Mixed Portfolio ... 50
3.2. Methodology ... 52
3.2.2. The Concept of Mean-Variance Optimization ... 54
3.2.3. The Portfolio Optimization Model ... 57
3.2.4. Data ... 59
3.3. Descriptive Analysis ... 60
3.4. Mean- Variance Optimization ... 65
3.4.1. Portfolio Optimization Including all Indices ... 65
3.4.2. Scenario Analysis ... 68
4. Results and Interpretation ... 73
5. Conclusion and Limitations ... 76
6. References ... 80
Table of Charts, Tables and Equations Chart 1: Cash Flows in a MBS 20 Chart 2: Negative convexity 24
Chart 3: MBS issuance volume 42 Chart 4: ABX.HE 06-02 43
Chart 5:CMO issuance by collateral type, percentage values represent share of Whole segment 45
Chart 6: CMBS market 47
Chart 7: REIT performance by property type 48 Chart 8: NAREIT/ NCREIF performance 50 Chart 9: Performance of asset classes 51
Chart 10: Portfolio combinations of two assets with varying correlations 54
Chart 11: Efficient frontier, CAL, minimum-variance and tangency portfolio 57 Chart 12: Allocations in efficient portfolios along target returns 66
Chart 13: Tangency portfolio weights of samples with different starting points 67 Chart 14: Efficient frontier of unconstrained portfolio consisting of MBS, treasuries, direct real estate and equities 69
Chart 15: Cumulative performance of tangency portfolio, equally weighted portfolio and risk-parity portfolio 72
Table 1:Descriptive Statistics of Indices 62
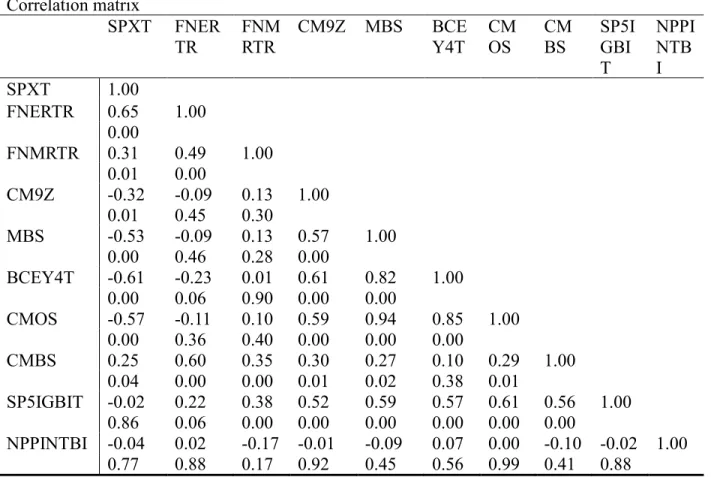
Table 2: Correlation matrix with significance levels below coefficients 64
Equation 1:Portfolio expected return ... 52
Equation 2: Standard deviation ... 52
Equation 3: Portfolio volatility ... 53
Equation 4: GMV portfolio weights ... 55
Equation 5: Tangency portfolio weights ... 56
Glossary
A.I.G. American Insurance Group ABS Asset backed securities ARM Adjustable rate mortgages
BofA Bank of America
CAL Capital allocation line
CDO Collateralized debt obligations CDS Credit default swaps
CMBS Commercial mortgage backed securities CMO Collateralized mortgage obligations
DCF Discounted Cash Flow
ETF Exchange Traded Fund
Fannie Mae Federal National Mortgage Association FED U.S. Federal Reserve System
FFO Funds From Operations
Freddie Mac Federal Home Loan Mortgage Corporation GAAP Generally Accepted Accounting Principles Ginnie Mae Government National Mortgage Association GMV Global minimum- variance portfolio
GSE Government sponsored enterprises IPO Initial Public Offering
LIBOR London Interbank Offered Rate
NAREIT National Association of Real Estate Investment Trusts
NAV Net asset value
NCREIF National Council of Real Estate Investment Fiduciaries PAC Planned amortization class
REIT Real Estate Investment Trust
RMBS Residential mortgage backed securities RTC Resolution Trust Corporation
S&P Standard and Poor’s
SEC U.S. Securities and Exchange Commission TRS Taxable REIT subsidiary
US United States of America
Abstract
In light of the negative reputation of mortgage backed securities (MBS) due to the subprime crisis and considering the swift recovery of the US real estate market since the crisis, the role of MBS in a mean-variance optimized portfolio is assessed. Excellent diversification benefits as well as attractive risk/ return attributes of agency- MBS are discovered leading to persistently biased allocations towards agency-MBS in a mixed portfolio with equities, bonds, MBS as well as real estate indices and excellent diversification capabilities are revealed in mixed portfolios combining agency-MBS with direct real estate investments.
Keywords: Mortgage Backed Securities, Diversification, Portfolio Optimization, Real Estate Investments
1. Introduction
The Financial crisis in 2007 and 2008 created significant uncertainty about financial investments and lead governments to introduce substantial quantitative easing programs to lower inflation and provide liquidity in the markets. The resulting low interest rate environment lead to the hunt for yields of investors, since traditionally safe assets like treasury bills provided yields barely exceeding inflation rates. Alternative investments like commercial real estate benefitted tremendously from the low interest rates as the spreads between safe treasury bills and real estate investments widened. The debt side of real estate investments could not recover from the crisis as quickly and remained notorious for causing the financial crisis. Being true only for the subprime segments of the mortgage backed securities (MBS), the substantially larger market for US government agency-guaranteed MBS offers securities with higher yields than treasuries at comparable risk exposure. These agency-MBS held up well during the crisis and account for around a quarter of the US fixed income market in 2017. The current change of the low- interest environment in the US, due to reducing of quantitative easing measures and a growing economy, may lead to shrinking spreads, which increases demand for inflation protected assets like MBS. This fosters the attractiveness of adding mortgage backed securities to a diversified investment portfolio as an addition to equities, bonds as well as real estate. For the consideration of assets to a mixed portfolio, investors analyze the risk and return attributes as well as the diversification effects on the portfolio. A widely used tool for calculating the optimal asset weights of a mixed portfolio, is the mean-variance analysis first proposed by Harry M. Markowitz in 1952.
In light of the current market environment and the lack of recent research about MBS allocations in mixed investment portfolios, the following research question is formulated. Are mortgage backed securities a valid financial instrument in a diversified portfolio, including stocks and bonds
as well as conventional real estate investment instruments? The following research hypotheses are tested in an empirical framework using quantitative time-series data for the last 18 years from the Bloomberg Terminal on ten indices, representing segments of the asset classes equities, treasuries, corporate bonds, MBS, structured mortgage securities as well as real estate. This data is analyzed in the mean-variance optimization framework in order to identify allocation patterns and assess the importance of the individual asset classes in optimized portfolios. First, it is hypothesized, that agency-MBS have substantial allocations in mean-variance optimized portfolios due to attractive the risk/return attributes. Secondly, it is hypothesized, that the riskier MBS segments have lower allocations than agency MBS due to the effects of the financial crisis. Finally, it is hypothesized, that allocations to real estate investment vehicles are larger than agency- MBS at higher risk levels, due to the strong and persistent recovery since the financial crisis.
This work is structured as follows. The literature review analyzes existing research and provides an overview about the mean- variance framework, focusing on theoretical implications of the diversification effect and the most important limitations of this concept. In the next section, the asset classes available to investors are discussed focusing on equities, conventional fixed income instruments like treasury and corporate bonds as well as real estate investment instruments like real estate investment trusts and direct real estate. Further detail is provided on the differences between direct and indirect real estate. The last part of the literature review is focused on the description of securitized mortgage instruments and their role during the financial crisis. The third chapter is concerned with data analysis. In the first section, an overview of the market for financial assets is provided with a focus on the performance and market characteristics of the securitized mortgage market and the real estate market during the last two decades. The next section is the methodology, where a theoretical basis is provided for the mean-variance optimization followed by an
explanation of the asset allocation model created in Microsoft Excel, used for the mean-variance analysis. It follows a description of the ten indices that were retrieved from Bloomberg in order to be used for the portfolio optimization. The subsequent section analyses the returns of the previously described indices with descriptive statistics as well as a correlation analysis. These measures provide the basis for the mean-variance optimization conducted in section 3.4. Multiple portfolio optimizations with several scenarios are conducted in order to understand the behavior of mortgage backed securities in mean-variance optimized portfolios. The last chapter first discusses and interprets the results of the previously conducted optimizations and finishes with a conclusion and a discussion of the limitations of this study as well as recommendations for further research.
2. Literature Review
The literature review begins with an analysis of the mean- variance framework followed by an examination of financial assets. Subsequently, direct and indirect real estate investments are discussed in further detail. The final part of this chapter focuses on a detailed analysis of securitized mortgage vehicles and their role during the financial crisis.
2.1. Theory of the Mean-Variance Optimization
Investors have access to a variety of investment assets to include in their portfolio which may vary depending on several key attributes like risk/return characteristics, liquidity and diversification potential. Liquidity refers to the effort and speed required to exchange the value of an asset for cash (Bodie, Kane, & Marcus, 2014). Diversification plays a significant role for investors as it allows for portfolio risk reduction when combining assets that do not have a perfect positive linear relationship. The linear relationship between assets is called correlation. Correlations are measured by the Pearson correlation coefficient and refer to the degree of co-movement between two assets. The coefficient ranges from positive one, indicating a perfect positive correlation, over zero, indicating no correlation to negative one, indicating a perfect negative or inverse relation. The diversification effect on portfolios will be examined in greater detail in section 3.2.1. A significant part of financial research focuses on the optimal asset selection and asset management of mixed portfolios, ranging from equal weighted or risk weighted portfolios to more complex techniques. Decisions are “made about when to make any adjustments as a consequence of a changing economic environment or requirements, decisions that are often complicated by consideration of taxes and costs” (Shipway, 2009). A famous asset selection technique is the is the mean- variance analysis first developed in the Modern Portfolio Theory by Harry M. Markowitz in 1952. This approach is based on the assumption, that all investors are rationale and risk averse. Rationale
investors only focus on the financial attributes of their investments and risk aversion refers to the preference of the least risky investment given the same return and all else equal. The mean-variance analysis is a “mathematical framework for mixing investments within a portfolio to calculate the expected returns for any given level of risk” (Shipway, 2009).
In mean-variance optimization, the weights of the assets to be included in an investment portfolio are assessed by their relative risk and return attributes. The risk is represented by the asset’s standard deviation and correlation to the other assets in the portfolio. A mean-variance optimized portfolio will offer the highest level of return for each level of risk (S. Lee & Stevenson, 2005). Hence, selecting assets with diversification potential results “in an ability to construct a portfolio that had the same expected return and less risk than a portfolio constructed by ignoring the interactions between securities” (Elton & Gruber, 1997). Mean-variance optimization allows for the calculation of two essential portfolios for investors. The first portfolio is the tangency portfolio, which maximizes the portfolio Sharpe Ratio, which indicates the return per unit of risk. The second portfolio is the minimum-variance portfolio, which minimizes portfolio variance, ignoring portfolio returns. As the optimization process only focuses on the excess return and risk of a portfolio, the tangency portfolio may allocate extreme weights to certain assets, while excluding others. In order to control for extreme allocations, Byrne and Lee (1995) propose placing upper and lower bounds as constraints on the weights of each asset. This approach restricts exclusions or extreme allocations. There is substantial evidence in financial literature, that variances are more persistent throughout time than returns, thus the minimum variance portfolio is proven to be a better portfolio choice in an out of sample environment than the mean-variance optimized portfolio (Stevenson, 2001). The methodology of mean-variance optimization will discussed in detail in section 3.2.3.
The most significant limitation of the Modern Portfolio Theory is that calculations are based on historical data. Changing key return characteristics, in particular the time-varying correlations between asset classes indicate significantly changing optimal portfolios throughout an investment horizon. Hence, a portfolio allocation calculated through the mean-variance framework may only represent an optimal allocation for the analyzed sample period, while other sample periods could render different allocations due to changes in risk return characteristics. The same is true for an out of sample environment (S. Lee & Stevenson, 2005). There is a large amount of literature concerning the time-varying correlations between asset types as well as international diversification. Researchers have found strong evidence for increasing correlations during recessions. Especially during the financial crisis, correlations between asset classes increased, which drastically reduced diversification potential. Nevertheless, Asness et all (2011), find evidence for long term diversification benefits and highlight that “short, systemic crashes” cannot be prevented by diversification but do not invalidate the strategy. Correlations increase during crashes in line with an increase in volatility, for example the volatiliy indicator for the S&P 500, VIX had a ninefold increase at the peak of the crisis (Loviscek & Riley, 2013), which may serve as an indicator for market disturbances. The financial crisis of 2007 and 2008 will be discussed in greater detail in section 2.5. Next to time-varying correlations, there is evidence for increasing correlations across asset classes since the early 2000s, leading to less diversification potential and effectiveness of portfolio optimization. Reasons for this phenomenon may be the increased effciency and the growing gloablization of financial markets (Kolanovic, 2011). Further studies found evidence for an inverse relationship between correlations among asset classes and the state of the economy. For example Michel et al (2015) found evidence for increasing correlations between the S&P 500 and fixed income indices during poor market performance and lower
correlation during bullish and normal markets. This finding indicates, that a combination of equities and debt securities would offer diversification benefits during a healthy economy but would incur substantial losses during market crashes. In conclusion, the essential objective of diversification, to reduce risk and hedge against losses of certain assets does not hold during distressed periods where it is most needed.
2.2. Asset Classes
Investors have a variety of choices to invest their wealth and due to the concept of investor heterogeneity, various investment opportunities with differing risk/return characteristics exist to serve their investment criteriums. Hence, investors may range from individual investors with very limited funds to invest and high-risk aversion to large institutional investors like yield seeking hedge funds. There are two broad categories of assets, that investors can place their wealth in, real assets and financial assets. Real assets include the goods and services in an economy, which may be real estate, commodities, machines and other assets. Of these, purchases of commodities on specific exchanges and the acquisition of a property, also referred to as private or direct real estate investment, is a common real asset investment for investors. An analysis of the real estate market is provided in the section 2.3.
2.2.1. Financial Assets
Financial assets refer to various types of securities, which can be categorized into equity, fixed income and derivatives. These asset classes can be broken down into further categories and subcategories in order to create groups of securities with similar characteristics. Characteristics may be for example the behavior in the capital markets, risk or liquidity. Besides a classification of asset classes into financial assets and real assets, there is another traditional classification system, which overlaps with the one previously described. Here, assets are divided into four major asset
classes, namely cash, stocks, bonds and real estate. This system is simplified and does not include asset classes like derivatives. The following section will provide a brief overview of the different financial asset types and reviews corresponding literature concerning diversification potential and their role in mixed portfolios.
The equities asset class refers to publicly traded firms who sell ownership shares on stock exchanges. Equities, also referred to as common stock, entitle the shareholder to voting rights and possibly dividends. Hence, this asset class is characterized by an uncertain payment stream resulting from dividends and capital gain when selling the shares at a premium to the purchase price. Stock prices reflect investors collective assessment for a firm’s current performance and future prospects. In case of a bankruptcy the value of the shares may become worthless, thus the shareholder bears the business risk. (Bodie et al., 2014). Hence, for assessing the share price of a firm, a company valuation is often conducted, that includes future growth prospects and the underlying risks of future cash flows. The most commonly quoted equity index in the US is the S&P 500, which is often used as a benchmark for equities. The S&P 500 index contains publicly traded corporations from a variety of sectors. The correlations between these firms also varies strongly, thus equity investors build portfolios with stocks that offer diversification benefits. However, the study from Loviscek and Riley (2013) estimated an increase in firm-level correlation in the S&P 500 of 75% during the financial crisis, indicating a systematic crash that decreased diversification capabilities and could not prevent substantial losses. In fact, the market capitalization of the US stock market dropped by more than 50% during the financial crisis.
In contrast to the equity asset class, fixed income securities provide a fixed cash flow to investors. There are two general fixed income categories, money market securities and capital market
securities. Money market securities include debt securities with short maturities, high liquidity and low risk like US Treasury bills or Certificates of Deposit of large banks with maturities of less than a year. Certificates of deposit are deposits at banks which cannot be withdrawn and the payout takes place at maturity, Treasury bills are a major instrument for the US government to raise money and these securities are backed by the US Treasury, which is considered to be free of default risk. Hence, Treasury bills are commonly used as a proxy for risk-free assets. Capital market securities have a variety of forms and have vastly heterogenous characteristics in terms of maturity, liquidity, cash flow pattern as well as risk and return attributes. Examples for capital market debt securities are corporate bonds, Treasury bonds, mortgage securities and bonds issued by federal agencies and municipalities. The income of these debt securities is generally fixed or defined by a formula leading to specified cash flows for the bond investors (Bodie et al., 2014). Treasury bonds are issued by the US Treasury and backed by the Treasury, similar to Treasury bills. The income Treasury bond investors receive are fixed coupon payments at a specific interest rate and frequency as well as the face value of the bond at maturity. The discount rate for assessing bonds is called the yield to maturity (YTM) and depends on the risk of the bond. The main risk for bonds is the default risk of the bond issuer, which creates uncertainty about the payment of coupons and repayment of the face value. The default risk is particularly important for corporate bonds and investors typically assess the default risk through the issuer’s credit rating. Financial assets are commonly rated by the large American rating agencies Standard & Poor’s, Moody’s and Fitch. These ratings are used to “measure the ability of issuers to meet their future financial commitments, such as principal or interest payments” (Coval, Jurek, & Stafford, 2009). Investment grade ratings range from AAA to BBB- or equivalent, depending on the rating institution. Corporate bonds are a common instrument for firms to raise capital in the capital markets and its structure is similar to Treasury bonds. However, there are special types of corporate bonds, like secured and unsecured bonds, depending
on whether a collateral is backing the security in case of bankruptcy. Additionally, there are callable bonds, where the bond issuer has the right to repurchase the bond at a specified call price. Another major type of debt securities is federal agency debt. A large part of the mortgage securities falls under this category of fixed income, since federal agencies like the Federal National Mortgage Association issue mortgage backed securities backed by so called conforming mortgages. Mortgage backed securities, which are not issued by federal agencies due to nonconforming mortgages as collateral are called private label issued mortgages. Section 2.4 will discuss mortgage backed securities in greater detail.
The third type of financial asset are derivatives, which are contract based complex securities with payoffs depending on the prices of the underlying assets. The main objective of derivatives is risk hedging and risk transfer. Examples are call and put options, future contracts and swaps. Another example are credit default swaps, which play a substantial role for certain securitized mortgage instruments and are discussed in section 2.4.3.
2.3. Real Estate Investment Vehicles
Real estate as the fourth traditional asset class may either be a financial asset or a real asset, depending on the real estate investment vehicle. Private real estate is considered a real asset versus indirect vehicles as financial assets. This section briefly examines the different property types available for investors, followed by a short description of private real estate and a more detailed description of the real estate investment trust (REIT) market as an important indirect real estate vehicle.
2.3.1. Overview of the Real Estate Market
The main property types are residential, retail, office, industrial, hotel and specialty properties. Residential properties can be categorized into single family houses, apartments or multifamily buildings, as well as owner occupied or rental properties depending on the use of the property. Residential real estate primarily depends on the local population growth, employment and housing affordability. The owner-occupied housing depends strongly on the interest rate level since mortgages are commonly used for financing these properties. Retail properties are another major property type, which refer to retail stores, shops or shopping centers. These properties depend on disposable income levels and aggregate wealth of the targeted households as well as the local traffic volume. Office properties depend primarily on employment and office occupancy in the relevant market. The next property type is industrial properties, which also have a variety of sub-categories like factories, transportation properties or power plants. The demand for these assets depends on a variety of factors like employment in the specific segment, product demand and transportation volume. Industrial properties tend to have large investment volumes due their size and may only be suitable for direct investment for large institutional players. Hotel and convention properties mainly depend on leisure and business tourism numbers as well as air passenger volume. Additionally, there are specialty properties like leisure properties, for example theme parks or educational facilities like schools and universities (Geltner, Miller, Clayton, & Eichholtz, 2006). In theory, all property types could be invested in through both direct and indirect real estate investment vehicles, however, some property types may be more suitable than others for a certain vehicle. A major limiting factor for direct real estate is the indivisibility of the properties leading to large minimum investment volumes, thus shopping centers, industrial and large office or hotel properties may be less suitable for this vehicle.
2.3.2. Direct Real Estate Investments
As stated above, private real estate is considered as a real asset and thus has substantial differences compared to financial assets. In contrast to financial assets, private real estate assets are not traded on exchanges and are highly heterogenous assets as each property has to be assessed individually. Private real estate is characterized by high capital requirements due to the direct acquisition of properties, low liquidity due to legal procedures for acquiring or selling properties and finding a counterparty that accepts the perceived adequate price. The last issue leads to another important aspect regarding direct real estate, which is the information inefficiency on transactions. Direct property transactions suffer from inaccuracy due to the uniqueness of properties, the lack of sale frequency and transaction repetition as well as the fact that sales only represent “the agreement of two parties, not a broad market consensus” (Geltner et al., 2006). Additionally, substantial transaction costs caused by legal and brokerage fees as well as taxes occur during real estate transactions In order to mitigate the high capital requirements on property types like large retail or hospitality assets, partnerships between investors can made in order to pool capital to jointly acquire an asset (Brueggeman & Fisher, 2011). Nevertheless, direct real estate investment may benefit from a low correlation to financial assets, hence offering better protection against shocks in the market. Another advantage of private real estate are the potentially higher yields, since no management fees are paid and substantial tax benefits arise due to write off possibilities of mortgage debt as well as depreciation expenses. The valuation of private real estate depends on the property types, however most commercial properties are valued with the discounted cash flow (DCF) approach and owner-occupied housing through the comparison approach where current values of similar houses are adjusted to the subject property.
2.3.3. Real Estate Investment Trusts
Next to direct real estate investments there are multiple vehicles for investing in indirect real estate. One of the largest indirect vehicles are Real Estate Investment Trusts (REITs), which are traded on stock exchanges and offer the liquidity and information advantages of traded companies. REITs offer the possibility of investing in a diversified real estate portfolio through a liquid instrument with small minimum investment volumes. These companies can be considered as the equity side of the public commercial real estate market compared to the debt side represented by commercial mortgage backed securities. Essentially, REITs are publicly traded companies that focus on real estate investments, which must qualify, through several requirements or tests, for corporate income tax exemption. An example for a private indirect vehicle for investing in real estate are private real estate investment funds. These vehicles offer increased liquidity, smaller minimum investments as well as more diversification as direct real estate investments. However, the liquidity of public real estate investments is not matched and prices of real estate funds or corresponding indices are based on appraisals which are subject to bias and inaccuracy (Lizieri, 2013). This study will focus on REITs as an indirect real estate investment vehicle.
REITs were created in the 1960s as part of the Real Estate Investment Trust Act, which allowed the pass-through structure of eligible real estate companies. This structure avoids double taxation, since earnings are only taxed at the individual shareholder’s personal income tax level. There are certain tests that REITs continuously have to meet, which are designed to “maintain REITs as somewhat passive investment vehicle, not too far removed from the original ‘mutual fund for real estate’ idea, and also to ensure that REIT investment is accessible to small individual investors”(Geltner et al., 2006). These requirements promote free-float, largely limit a REIT’s income to real estate assets and require substantial dividend distributions of the net income. REITs
are assessed similar to other traded firms by discounting expected future cash flows, however, due to the required focus on real estate assets, the value of the underlying properties plays a dominant role and are considered through the net asset value (NAV). The net asset value refers to the estimated current value of the assets owned by the REIT, deducted by the total liabilities (Brueggeman & Fisher, 2011). For the valuation of REITs, real estate fundamentals are combined with stock fundamentals. The key value drivers for REITs are the cash flows distributable to shareholders, the growth of the cash flows as well as the growth of the net asset value. The risk is reflected in the discount rate and reduces the value accordingly. REITs characteristically are highly levered, which is a main factor for the typically high levels of systematic risk for REITs. Nevertheless, Brounen and Koining (2012) discover lower volatility of REITs compared to the overall stock market. A REIT’s cash flows are measured in Funds From Operations (FFO), which is an earnings measure deviating from the Generally Accepted Accounting Principles (GAAP) Net Income. FFO is calculated by adjusting the GAAP Net Income by adding the real estate depreciation and amortization expense as well as the preferred stock dividends and subtracting the net gains from property sales and extraordinary items (Geltner et al., 2006). Typically, REIT stocks can be considered as income stocks due to the high dividend payout ratio required for the REIT status. Hence, these companies cannot retain large amounts of earnings for profitable investments, which lead to growth in the firm. Possibilities for growth is the purchase of properties and expected future growth through attractive development possibilities of existing land or development rights (Geltner et al., 2006).
The market for REITs surged during the REIT IPO boom during 1993 and 1994, raising USD 16.5 billion, followed by a surge in secondary offerings in 1997 and 1998, raising additional USD 32 billion. During this bullish period for REITs, share prices for REITs soared, while real estate prices
remained relatively stable indicating an overvaluation of REIT stocks. In 1999 and 2000, the REIT market crashed due to a substantial loss in confidence in the REIT sector caused by the disconnection between real estate prices and REIT shares (Geltner et al., 2006). During the early 2000s, after the dot com crash, the REIT market stabilized and prices soared in line with the general stock market. During the financial crisis, property prices plummeted and the cost of debt surged, leading to a strong decline in the REIT market.
In conclusion, REITs offer more liquidity, property as well as market diversification potential, information efficiency and lower minimum capital requirements than direct real estate investments. Direct property offers potentially higher yields and substantial independence from financial markets (Geltner et al., 2006).
2.3.4. Diversification Potential and Limitation of Real Estate Investments
According to Lizieri (2013), reasons to include real estate in a diversified portfolio include “favorable risk-adjusted returns, inflation hedging qualities, and the benefits of diversification”. Hence, correlations between property returns and financial assets are expected to be low in order to qualify as an asset class with strong diversification capabilities. When considering direct real estate in a mean-variance optimization framework, several characteristics of this asset class may impose issues regarding the resulting portfolios. The indivisibility aspect and heterogenic lot sizes between different property types like apartments or shopping centers, creates significant hurdles for the optimization framework as the calculated weights may not be achievable. Indirect real estate investments like REITs do not suffer from these limitations and target allocations could be matched more easily. This issue is also true for other common allocation strategies like equal weight or risk parity portfolios. Another issue regarding direct property are appraisal based direct property returns,
which have a volatility smoothing characteristic that overstates the attractivity of this asset class and may create dominant weights in a mean- variance optimization. Hence, total return and non-appraisal based indices should be considered for evaluating the allocation to direct real estate (Lizieri, 2013). As described above, the low correlation to equity markets and attractive risk and return attributes lead to high allocations of real estate in mean- variance optimized portfolios. Nevertheless, there is evidence for a lower asset allocation to real estate in investment portfolios than predicted by optimized portfolios amounting to 20 to 30% (Brounen, Prado, & Verbeek, 2010). According to Brounen, Prado and Verbeek (2010), direct real estate offers short term inflation hedging benefits when accounting for interest rate risk, however, “over longer holding periods real estate proves to be a poor interest rate and particularly poor inflation hedge”. Similar to direct real estate, they find evidence for diversification potential and attractive risk reward characteristics for indirect real estate, though no significant inflation hedging capabilities. Additionally, the study found an increasing allocation to indirect real estate in efficient portfolios with higher risk tolerance that goes in line with a decrease in direct real estate allocation (Brounen et al., 2010).
2.3.5. Real Estate During the Financial Crisis
According to Lizieri (2013), real estate assets could not provide the diversification and hedging attributes previously anticipated during the financial crisis. Property returns were expected to “insulate the portfolio against drawdown during bear markets” (Lizieri, 2013). However, during the crisis, property returns plummeted throughout property types and markets. Moreover, evidence was found for increasing correlations of real estate to financial assets during the crisis. This indicates the time-varying correlation of real estate to equity markets. In fact, Lizieri (2013) found evidence for time-varying correlations of both private and public real estate to financial assets, which peaked during bear periods of the stock market. Hence, the promised insulation against a
drawdown did not become true since the diversification benefits weakened during the critical periods. During bullish periods, correlations between private real estate and financial assets were found to be low indicating diversification benefits, though this relationship diminished during the crisis, which was caused by market illiquidity and inaccurate appraisals due to lags and asymmetric market information. The findings of Lizieri (2013) are evidence against the attributes discovered by Hudson-Wilson et al. (2003) and Chun et al. (2004), who suggested strong hedging capabilities due to pay-offs during bear markets.
2.4. Mortgage Backed Securities
Mortgage backed securities are an essential part of the US fixed income market, accounting for around 25%. MBS have unique risk/return characteristics, differentiating this asset class from other debt instruments. MBS are fixed income securities, which have a pool of home or commercial mortgages as a collateral. This section begins with a detailed overview of mortgage backed securities, continuing with the history of MBS, followed by a brief explanation of the valuation methods for MBS. Subsequently, structured mortgage instruments are analyzed and the remainder of the section is focused on the financial crisis, focusing on the role of MBS and rating agencies.
2.4.1. Overview and Origin of Mortgage Backed Securities
There are two major types of mortgage backed securities, depending on the underlying collateral of the mortgage. The first type of MBS are residential mortgage backed securities (RMBS), which refer to pools of mortgages taken on by homeowners to finance the acquisition of their homes. The second type are commercial mortgage backed securities (CMBS), which refer to “debt instruments collateralized by non-recourse loans which are secured by commercial real estate”, usually
apartment properties, retail centers, hotels, restaurants, warehouses and office buildings (Maxam & Fisher, 2001).
The market for mortgages originates in the provision of long-term loans to homebuyers by local saving banks, which receive a pledge on the property as the collateral. For homeowners to be eligible for a mortgage, certain criteria had to be met by the potential borrower in terms of stable income history, documentation and other criteria. According to the terms of the loan, the borrower provides frequent payments to the originator including the interest payments as well as amortization payments, which reduce the remaining loan amount (Fabozzi, 2005). The general level of interest rates for mortgages depends on the interest environment of the economy, similar to treasury bonds. The characteristics of the interest payments differs, depending on the loan type as well as maturity and are specified during the closing of the loan. There are fixed rate mortgages and those with variable interest rates, the so- called adjustable rate mortgages (ARM), which are linked to a market rate index. Some ARM loans start with lower initial interest rates that subsequently rise to a fixed spread over the specified index (Fabozzi, 2005). These types of loans played a particularly important role during the financial crisis, which will be discussed in greater detail in section 2.5. The term for mortgages usually amounts to either 15 or 30 years. An important aspect of mortgages is, that homeowners have the right to prepay their mortgages with additional amortization payments. This leads to uncertainty with regards to the maturity of the mortgage, since it could be repaid at any time during the term.
In order to increase the supply of loans, bankers made use of securitization, where mortgages were bundled into pools, which could be traded as financial assets and had a high demand in the financial markets. (Bodie et al., 2014). These financial assets are referred to as mortgage-pass-through
securities and are treated as fixed income securities. The cash flows of these securities are passed through to the MBS investor and consist of the interest-and amortization payments as well as the prepayments from the borrowers. There are two types of mortgage pass-through securities, agency pass-through securities and nonagency or private label pass-through securities. The first type of securities are mortgage pools with a credit guarantee provided by government sponsored enterprises (GSEs). There are three GSEs, Government National Mortgage Association (Ginnie Mae), the Federal National Mortgage Association (Fannie Mae) or the Federal Home Loan Mortgage Corporation (Freddie Mac). During the peak of the financial crisis, on September 6, 2008 Fannie Mae and Freddie Mac were placed into conservatorship of the Federal Housing and Finance Agency in order to be backed by the full faith of the US Department of Treasury “to provide financial support […] to continue to provide liquidity and stability to the mortgage market” (Federal Housing Finance Agency, 2008). Hence, all three agencies are backed by the US Department of Treasury since Ginnie Mae has already been a government agency before the financial crisis. The second type are mortgage pools that are not guaranteed by a GSE, but by private firms, like commercial banks or thrifts, and thus may have some degree of credit risk in the insurance (Fabozzi, 2005). For loans to qualify as an agency loan, particular requirements in terms of borrower credit worthiness as well as loan size have to be met. For example, the agencies state loan size limits, thus more expensive properties often do not qualify for the agency loans and are referred to as jumbo loans. Chart 1 displays the pass-through structure of MBS. The loan originators sell the conforming mortgages for a premium to financial institutions like Fannie Mae and Freddie Mac and may continue to collect the interest (I) and amortization (P) of the homeowners for a service fee and transfer it to the mortgage pool. The mortgage pool is securitized into a MBS by the financial institution and subsequently sold to investors who will receive the payments of the homeowners. Guaranty institutions like Fannie Mae and Freddie Mac further guarantee the default
and credit risk of the mortgages for a guarantee fee (Kariya & Kobayashi, 2000). This structure is called pass-throughs since the cash flows are passed through from the home owners to the final investor.
Chart 1: Cash Flows in a MBS, adopted from (Bodie et al., 2014)
The second type of RMBS are MBS with non-agency mortgages as collateral. These mortgages did not qualify the requirements for conforming mortgages due to a lack of credit worthiness of the borrower, unsupported type of property and other reasons. Non-agency MBS are characterized by an exposure to the default risk of the homeowner, since there are no guarantees on the cash flows. The market for non-agency MBS grew quickly between 2000 and 2006, reaching a 56% market share in MBS issuances in 2006 and more than USD 1 trillion in issuances. A market analysis of MBS issuances is provided in the market analysis in section 3.1.1.
The second category of MBS are CMBS, which have a substantially smaller market than RMBS but, similar to RMBS, were created to increase supply of commercial mortgages. In order to overcome the general issues of illiquidity of real estate investments, securitization as a tool for innovative financing is used. The income achieved through these products is characterized by the “receipt or payment of a predictable and dependable income streams i.e. rents or loan payment” (Solomon & McCluskey, 2010). Furthermore, CMBS are characterized by the non-recourse attribute, which refers to the concept, that in case of a borrower default, the lender has only access
Homeowner Originator Agency Investor
I+P
I+P-servicing
I+P -
to the proceeds from the sale of the underlying real estate as no guarantee is provided (Fabozzi, 2005). Further key differences between CMBS and RMBS are the preclusion of pre-payments, since these mortgage agreements either prohibit or penalize the refinancing. Secondly, there are no guarantees provided from government agencies like FNMA and GNMA to eliminate the credit risk, which leads to default risk of the borrower as the main pricing parameter for CMBS (Maxam & Fisher, 2001).
When comparing mortgage backed securities to the traditional fixed income securities in terms of key attributes, there are several differences that potentially render MBS investments more attractive than other fixed income securities. The main risk of corporate bonds is the credit risk of the issuing company. If the company is unable to pay the promised coupon or face value, the bond holder incurs losses. The riskiness of the repayment is represented in the discount rate used for pricing the bond. Agency- MBS do not have credit risk, since their coupon and principal payments are guaranteed by the US Department of Treasuries. Non- agency- MBS are subject to similar credit risk as corporate bonds or government bonds. However, instead of credit risk, agency- MBS are exposed to prepayment risk since the mortgage holders have the option to prepay their mortgages leading to losses for mortgage investors. The homeowners have an incentive for repayment in case of falling interest rates as they can refinance their mortgages cheaper with the lower interest rates. Since the mortgage investors expect a certain rate of prepayment, less prepayment than expected, caused by rising interest rates, may also lead to an extension risk. In this scenario, MBS investors receive less prepayments than expected and can invest less funds in the attractive high interest rate environment. Thus, the prepayment and extension risk renders MBS cash flows more uncertain. Fixed coupon bonds, on the contrary have fixed coupon payments, that are only subject to the described credit risk and interest rate risk (Rowley Jr., 2013).
2.4.2. Valuation of Mortgage Backed Securities
As mentioned above, homeowners have the right to prepay their mortgages at any time, which creates a prepayment risk in addition to the interest rate risk for the MBS investor (Kariya & Kobayashi, 2000). The prepayment behavior of homeowners is heterogenic and depends on economic as well as noneconomic reasons rendering MBS valuation highly complex. Prepayments may occur due to refinancing, the sale of the property or due to the default of the borrower. A refinancing incentive arises when the current interest rate for mortgages drops abruptly below the initial contracted mortgage rate (Kariya & Kobayashi, 2000). In case of declined mortgage rates, it may be profitable for the homeowner to take on a new, cheaper loan and paying off the initial mortgage with the proceeds. Incentives for selling the house may be economic or noneconomic. Noneconomic or personal reasons could be changes in personal circumstances like family or employment. Economic circumstances refer to profitable opportunities for selling the house, since the value of the house appreciated. The prepayment rates due to selling the house, in particular due to personal reasons, are difficult to estimate due to the lack of reliable information. Economic and demographic variables are commonly used for estimating prepayments. The prepayment option of borrowers can be compared to a callable bond, where the bond issuer has the right of calling the bond. In this case, the borrower can call or in this case prepay the loan at the remaining loan balance. When disregarding the non-interest rate related incentives for repayment of the loan, the value of a MBS depends largely on the interest rate since the principle value decreases in line with the interest rate (Bodie et al., 2014).
In 2006, the government- sponsored enterprises (GSE) held credit guarantees for nearly 50% of all outstanding residential mortgages in the US, indicating their importance for a functioning market
(Downing, Jaffee, Wallace, Mae, & Mac, 2009). Hence, the default risk for GSE backed RMBS could be neglected due to the guarantees and the single determining risk factor for RMBS was the prepayment risk. The GSEs would repay the principle of the mortgage in case of the default of the borrower, in return, during the pass-through process of the mortgage, a fee for the GSE is deducted. The prepayment characteristics of MBS makes its valuation complex since the maturity of the mortgages included in the MBS depend on the prepayments of the mortgages. The value of a MBS can be decomposed into a riskless bond (due to the guarantee provided by the guaranty institution) and the prepayment option (Kariya, Ushiyama, & Pliska, 2011). This option represents a significant risk for the value of a MBS portfolio and “depending on the interest rate environment, prepayment can either hurt or benefit the MBS investor” (Gabaix, Krishnamurthy, & Vigneron, 2007). Prepayments rates due to reasons other than refinancing can be combined to turnover rates which include prepayments due to the sale of houses, property destruction, borrower default and partial prepayment. When homeowners prepay their mortgages early, mortgage investors lose the interest income receivable in the future, hence early repayment or prepayment is not desired by investors. As discussed, homeowners have various reasons for repayment, thus part of the mortgages may be expected to be repaid constantly throughout the term of the mortgage pool. This turnover rate tends to be relatively stable and is primarily influenced by the “levels of real estate appreciation and home resale values” (Fabozzi, 2005). Informed, rationale investors may be referred to as efficient investors, who prepay when mortgage interest rates drop or property prices rise (M. Lee & Pace, 2006). This relationship indicates, that the more inefficient the homeowners of the mortgage pool are, the higher is the value of the underlying mortgages, since more mortgages are held until maturity (Downing et al., 2009). In case of a rationale investor, the mortgage holder “has a high-yielding asset payoff” when interest rates dropped, leading to the inability to reinvest the proceeds at a similar rate (Fabozzi, 2005).
The value of a MBS follows the concept of negative convexity, when interest rates decline, the value of the MBS decreases due to prepayments and when rates increase, the value of the mortgage pool decreases due to duration effects. Duration refers to the “weighted average time (in years) until the bond’s future cash flows will be received. The weighting is proportional to the component of each future cash flow in the present value of the bond” (Geltner et al., 2006). In contrast to straight bonds, the MBS price has no linear relationship with the interest rate, instead, less appreciation due to declined interest rate and more depreciation due to duration as well as extension effects can be observed. This underperformance of MBS is compensated by higher base yields than comparable bonds (Fabozzi, 2005). The negative convexity characteristic of MBS can be seen in chart 2.
Chart 2: Negative convexity, adopted from Fabozzi (2005) 80 85 90 95 100 105 110 115 1.0% 2.0% 3.0% 4.0% 5.0% 6.0% P rice Yield
Negative convexity of MBS
Bond MBSThere are multiple approaches for valuing the prepayment option. A widely used model is considering the prepayment option as a call option on the underlying mortgage (Schwartz & Torous, 1989). Thus, when homeowners exercise their prepayment option out of the money due to personal reasons or cost constrains, the value of the mortgage increases for investors. Kariya, Ushiyama and Pliska (2011) propose a three-factor pricing model based on the research of Kariya and Kobayashi (2000), using the mortgage rate as the discount factor and breaking down the prepayment option into two factors, the prepayment due to refinancing or due to selling the property. However, this two-factor approach ignores the noneconomic incentives described above. Hence, a complete model for valuing MBS would require further factors for which accurate data is not available. A possible factor could analyze the positive difference between the property value and the loan size which correlates with the default rate. Additionally, a factor could be related to the availability of credit which depends on rising housing prices since higher valued houses indicate larger collaterals for the lenders leading to less restrictive lending standards. These inefficiencies in MBS pricing, may have played a role during the subprime crisis, since a more complete MBS pricing model may have been capable of giving warning signals before the sub-prime crisis (Kariya et al., 2011).
The valuation of CMBS is less complex than of RMBS, since prepayments are prohibited. Valuing CMBS depends on two components, a straight bond and the option to default, which indicates the difference to RMBS, which have the option to repay. Defaulting on a mortgage is strictly economic decision, which renders the valuation of CMBS less complex compared to RMBS, since only market parameters are used for estimating the default instead of a combination of personal and economic factors which is the case for RMBS (Maxam & Fisher, 2001). The main parameters affecting the defaults are the property value, the mortgage value and the income received from the properties. In their study, Maxam and Fisher (2001) found that due to the less systematic nature of
defaults than pre-payments, “CMBS exhibit much more stable cash flows […] and hence less reinvestment risk than residential MBS”.
2.4.3. Overview of Structured Mortgage Instruments
In this sub-section, the market for structure mortgage instruments is described, which are financial products, that repackage a portfolio of mortgages into segments with specific attributes which may be attractive to certain investors that are willing to pay a premium for these. Structured finance instruments refer to financial products, where cash flow generating assets like bonds, various types of loans as well as mortgages are pooled together and “prioritized capital structure[s] of claims, known as tranches, against these collateral pools” are created (Coval et al., 2009). Examples of structured finance instruments are collateralized debt obligations (CDOs) and collateralized mortgage obligations (CMOs. Collateralized debt obligations are repackaged pools of cash flow generating assets, which have mortgages, loans or bonds as collateral. CDOs can take various forms depending on the cash generating asset and underlying collateral. Collateralized loan obligations include loans as collateral and generate income through the debt service of the loans. A more complex type of CDOs are Synthetic CDOs, which have credit default swaps (CDS) as collateral. CDS are used to separate the credit risk from the corresponding asset and work similar to an insurance for the CDS purchaser. The synthetic CDO generates cash flow through the fees from the credit protection purchasers and distributes these fees in tranches to the CDO investors. However, in the event that a “defined credit event occurs on those reference assets, the CDO receives a payment from its investors and makes a payment to the counterparties that have bought credit protection from the CDO” (Fabozzi, 2005)
Collateralized mortgage obligations (CMO) are a form of collateralized debt obligations, which use mortgage pools as the underlying collateral. These products were initially engineered during the years before the financial crisis with the purpose of generating more profits in the booming market (Mackenzie, 2011). Most CMOs are created from agency pass through mortgage pools and hence contain homogenous high-quality mortgage pools. The CMO repackages the cash flows received from underlying mortgage pools into tranches according to investor preferences. Tranches may vary according to the prepayment exposure; common types are sequential and planned amortization class tranches. Sequential tranches may be structured to first receive prepayments to shorten the duration or planned amortization class (PAC) tranches which receive prescheduled cash flows independent of the underlying mortgage pool. Additionally, tranches are created to modify the interest payments. CDOs create floater and inverse Floaters, which change the fixed interest payments of the underlying mortgages to variable ones, that are linked to interest rate indices like the London Interbank Offered Rate (LIBOR). The floater would move in line with the LIBOR rate, while the inverse Floater has an inverse exposure to interest rate movements. Finally, there are altered versions of these tranche types to replicate certain characteristics and exposures that are attractive to certain investors (Fabozzi, 2005). Besides the agency CMOs, there is a market for non-agency CMOs which substantially benefit from the credit enhancement possibilities CMOs offer. Non-conforming loans like jumbo loans or subprime/ Alt-A mortgage pools are commonly repackaged to non-agency CMOs. These mortgage pools are exposed to default risk and the prepayment behavior may be more heterogeneous compared to agency MBS pools.
In structured finance products, a prioritization scheme is created in order to structure the claims of the cash flows of the underlying asset pool according to different risk/ return profiles. This process enables repackaging the risk of the asset pool to create tranches of different risk levels. Since
structured securities like CDOs are rated by rating agencies like Standard and Poor’s (S&P), Moodie’s and Fitch, the tranches receive different ratings according to their risk exposure. Hence, tranches of superior ratings compared to the average collateral risk can be created (Coval et al., 2009). Non-agency CMO tranches may be structured according to default risk exposure, where senior tranches are most protected against defaults. CMO cash flows are distributed in a waterfall structure according to the seniority of the loans, thus the junior or subordinate tranches receive interest payments and principal payments only after the more senior tranches have been paid. This process is referred to as credit enhancement since senior tranches receive AAA ratings out of much lower rated pool of MBS due to the transferred default risk to the subordinate tranches, which receive ratings below the investment grade. The expected yield for CMO investors of the tranches is structured according to their seniority, thus subordinate CMO tranches are compensated by higher yields. Typical investors for the subordinate tranches are hedge funds and other specialized investors, who can assess and hedge the involved risks. In addition to the subordination technique, measures like overcollateralization are used for credit enhancement, where excess collateral is placed in the CMO in order to protect against losses due to defaults (Fabozzi, 2005). In order to further benefit from credit enhancement, the tranching process used in CDOs can be extended by creating a pool of junior or subordinate tranches of CDOs to create a so called CDO-squared, which repackages the pool of tranches, similar to the conventional CDO (Coval et al., 2009). Here the credit enhancement process can create AAA rated tranches out of a pool of unrated subordinate tranches due to the discussed credit enhancement technique that theoretically absorbs the risks.
During the financial crisis, the market for structured finance instruments grew significantly. Due to the soaring market for subprime mortgages, a large portion of the CMOs contained subprime and other non-conforming mortgages. The expected return of these structured products is very
sensitive to its parameters like default rates and default correlations. Since these parameters were estimated through complex historical models, adequate data for default rates of these loans were not available. The complexity and nature of structured finance instruments like CMOs amplifies the exposure to changing market conditions and in particular the senior tranches concentrate the systematic risks, since the idiosyncratic risk portion is transferred to the junior and subordinate tranches (Coval et al., 2009). This circumstance makes structured products like CMOs particularly prone for substantial losses during market crashes. Although yields of AAA rated CMO senior tranches exceed those of similarly rated corporate bonds, which indicates partial compensation for increased systematic risk exposure of CMOs, the study of Coval et al. (2009) highlights, that this risk premium is insufficient for the expected losses during recessions. Moreover, the yields of the senior tranches are still low as a supposedly safe investment grade asset, causing the junior tranches to be overcompensated in excessive yields. Hence, many investors were incentivized to invest in the highly risky junior tranches, further fueling the subprime mortgage market, since the additional supply of subprime mortgage financing reduced the borrowing costs. Finally, a crucial aspect of CDOs is the correlation of the underlying assets. The less correlation between the underlying assets exists, the more effective is the credit enhancement and the potentially safer the senior tranche can be (Coval et al., 2009). The CDO- squared are significantly more sensitive to parameter changes than normal CDOs since increased default rates or default correlations impact the CDO-squared tranches heavily. In order to hedge their credit risk exposure, CDO/CMO investors can acquire credit default swaps (CDS) as insurance against the default of the purchased tranches. However, the credit risk of the insurer has to be considered.
2.5. The Financial Crisis and the Role of Mortgage Backed Securities
The financial crisis is considered as the worst crisis since the Great Depression and formed relatively quickly. Securitized mortgage instruments played a substantial role during the financial
crisis. In order to fully understand the risk nature of these assets as well as the historical behavior during the crisis a detailed overview of the financial crisis is provided in this section. First, the events leading to the financial crisis are described, followed by a sub-section concerned with the key stakeholders of the crisis.
2.5.1. Circumstances Leading to the Financial Crisis
During the years before the crisis, the economy was healthy and expanded continuously since the high-tech bubble in the early 2000s. After the high-tech bubble, the US economy was shaped by a low interest rate environment due to extensive foreign investment and a lax interest rate policy by the Federal Reserve the boost the economy (Brunnermeier, 2009). Also, financial institutions changed their business model towards the securitization process to subsequently distribute instead of lend and hold the loans. Instruments like CDOs became very popular and allowed banks to transfer the credit risk of the originated assets to other parties. This process reduced the incentive for banks to assess the risk and loan performance of the securitized mortgage pools (Brunnermeier, 2009). These characteristics of the economy lead to a soaring housing market because the low interest rates and confidence in the economy increased the hunt for yields of investors and the attractiveness of alternative investments as well as the accessibility of loans.
The increased number of MBS created by Fannie Mae and Freddie Mac were highly demanded, however the supply of low-risk conforming mortgages, which were originated during the years before the financial crisis, had limits. The majority of originated mortgages qualified as conforming mortgages, where borrowers had to present various indicators for income stability and long-term ability to pay back the mortgages. This characteristic lead to the low default risk of agency mortgages and rendered lenders more optimistic during the years before the financial crisis and
GSEs provided credit guarantees for these loans effectively eliminating the mortgage’s default risk. The subprime market for mortgages already existed since the inception of the MBS market, however its size was very small in comparison to the total MBS market. The subprime non-agency-MBS market evolved as the credit scoring technologies improved and online investigations became possible. The new technologies enabled automated underwriting through automated online scoring of potential borrowers, which saved a significant amount of time and money per loan application. This sharp decrease in application processing costs increased the profitability of the mortgage originators. These processes generated a 40% increase in subprime mortgages resulting in $ 450 Billion of subprime loans in 2005 which accounted for 20% of new loans and 10% of total mortgage loans that year (Johnson & Neave, 2008). The qualitative assessment of loan applicants was essentially substituted for automated scoring programs, which selected conforming borrowers through fixed attributes. This lead to a large amount of approved subprime borrowers.
The growing market attracted new players, increasing the competition for mortgages and in order to maintain the profit levels, the requirements for conforming mortgages were relaxed by the loan originators. Since mortgages were insured against defaults by wall street banks, the incentive for adequately inspecting the loan applicants was reduced, since default risk was transferred to the insurer. Moreover, new forms of mortgages, like teaser loans, were created with initial low interest rates and subsequent adjustable interest rates linked market rates. These loans further attracted subprime borrowers and when interest rates increased, default rates soared (Johnson & Neave, 2008). These mortgages had significantly more default risk because the lenders needed to proof less credit worthiness, however with increasing risk for the MBS investors, risk monitoring activities were not altered. The riskier MBS portfolios were still insured against default risk and some insurers even reduced insurance fees for gaining market share, reducing the incentive for
investors to increase risk management activities. Besides, the MBS portfolios were tranched into tailored risk/return profiles depending on ratings and prepayment expectations, which corresponded to different risk exposure profiles of investors. The competitive yields of the MBS/CDO portfolios and tailored risk profiles were attractive investments and lead to a booming subprime MBS market in the years before the financial crisis. According to Johnson & Neave (2008), the warning signs of “growing competition for new loans, relaxation of quality screening, and under-emphasis of residual risks” were ignored by the market participants due to the strong returns and the supposedly inexistent default risk thanks to credit insurances.
Before the financial crisis 75% of mortgage loans were securitized by GSE like Fannie Mae and Freddie Mac. The securitized portfolios are sold to specialized investors and the default risk remains with insurer or in case of uninsured mortgages the default risk is transferred to the investor. Due to complex nature of securitized and tranched instruments like CDOs, the residual risk is often obscured. Investors of non-agency-MBS were institutional and specialized investors, which focused on the prepayment risk and interest rates of their MBS tranches. They ignored the default risk and relied on the ratings provided by the rating agencies. On the one side the high supply for MBS financing and on the other side, the high demand for mortgages, lead to the booming market between the early 2000s and 2007. The high supply for MBS financing originated from the lack of attractive investment alternatives for institutional investors during this period. The originators also contributed to the supply, since they could achieve high profits through the automated screening processes and focused on increasing the number of underwritings. Moreover, house prices rose by 11% per year between 2002 and 2007 leading to potentially high resale values of the properties, and reinforced expectations of continuous growth (Acharya & Richardson, 2009). For an increase in mortgage demand in line with the high supply, loan requirements were relaxed as described