http://dx.doi.org/10.1590/1516-635x160243-50
Author(s)
Praes MFFMI
Junqueira OMI
Pereira AAII
Filardi RSIII
Duarte KFI
Sgavioli SI
Alva JCRI
Domingues CHFI
I Department of Animal Science, School of
Agricultural and Veterinary Sciences, Uni-versidade Estadual Paulista Júlio de Mesqui-ta Filho, Jaboticabal, São Paulo, Brazil.
2 Department of Animal Science,
Universida-de FeUniversida-deral Universida-de Alagoas/Campus Arapiraca, AL 57312-310, Brazil;
3 Department of Biology and Animal Science,
School of Engineering of Ilha Solteira, Uni-versidade Estadual Paulista Júlio de Mesqui-ta Filho, UNESP
Process FAPESP - 2008/50391-8
Mail Adress
Corresponding author e-mail address Maria Fernanda Ferreira Menegucci Praes Rua Professor Felisberto Almada, 437,
Bonfim Paulista, Ribeirão Preto-SP, CEP 14110-000
E-mail: menegucci2002@yahoo.com.br
Keywords
Rice hulls, cottonseed hulls, soybean hulls, crude protein, egg production.
Submitted: December/2013 Approved: April/2014
ABSTRACT
This study aimed at evaluating diets containing different fiber sources and two crude protein levels on the performance, egg quality, and nitrogen metabolism of commercial layers. In total, 392 48-wk-old Isa Brown layers were distributed according to a completely randomized experimental design in a 3x2+1 (control) factorial arrangement, resulting in seven treatments with seven replicates of eight birds each. Treatments consisted of three fiber feedstuffs (cottonseed hulls, soybean hulls, and rice hulls) and two dietary crude protein levels (12% and 16%). Cottonseed hulls associated with the high crude protein level (16%) resulted in the worst feed conversion ratio per dozen eggs. Diets with 16% crude protein resulted in the highest feed intake, egg production, egg weight, egg mass values, and improved feed conversion ratio (kg eggs/kg feed). The dietary inclusion of soybean hulls determined low yolk pigmentation, and of rice hulls, low egg specific gravity. The 16% crude protein diet with rice hulls promoted the best feed conversion ratio. Hens fed the reference diet presented higher egg mass and better feed conversion ratio per kg eggs and per dozen eggs. Hens fed the diets with low crude protein level (12%) had reduced nitrogen excretion, but presented worse egg production.
INTRODUCTION
The use of crop byproducts in animal feeding brings added value to these products and reduces their environmental pollution potential, and, in addition, may be an alternative for the partial replacement of corn and soybean meal in non-ruminant diets. Hulls from different crops are widely available, but are seldom used in poultry feeds. However, when adding these fiber-rich ingredients to non-ruminant feeds, the nutritional and physiological effects of fibers must be considered. These effects depend not only on the amount of cell wall included in the diet, but also on their chemical composition and structure, as well as on how
fibers are associated with other nutrients (Medeiros et al., 1988).
Due to the increasing concern with the impacts of egg production on the environment, nutritionists need to face the challenge of formulating diets with alternative feedstuffs and reduced protein levels, thereby contributing to reduce nitrogen excretion while maintaining layer performance. Increasing the efficiency of the utilization of dietary protein and amino acids may allow adequate supply of poultry nutritional requirements, regulate egg production, and reduce environmental pollution by lowering nitrogen excretion as well as production costs.
MATERIALS AND METHODS
The experiment was performed with 392 Isa Brown layers with 48 weeks of age in the beginning of the experiment. Birds were first selected according to body weight to obtain uniform groups, their egg production was individually monitored for four weeks, after which they were redistributed to obtain groups with uniform egg production.
The experimental period, when birds were 48-64 weeks of age, was divided in four periods of 28
days. Birds were offered water and feed ad libitum.
A lighting regime of 17-h of light/day was adopted. At the end of each period, performance and egg quality were evaluated. At 64 weeks of age, hens were
submitted to a metabolism assay in order to analyze excreta nitrogen content.
A completely randomized experimental design in a 3x2+1 factorial arrangement was applied, with three fiber sources (soybean hulls, rice hulls, or cottonseed hulls), two crude protein levels (12% or 16%), and one control treatment. The control treatment consisted of a 15% crude protein diet based on corn and soybean meal with no inclusion of fibrous feedstuffs . Each treatment contained seven replicates, totaling 49 experimental units.
Feeds were based on corn and soybean meal and supplemented with trace minerals, vitamins, and amino acids, and were formulated to supply the hens’
nutritional requirements, according to Rostagno et al.
Table 1 – Ingredients and nutritional composition of the experimental diets.
Soybean hulls Rice hulls Cottonseed hulls
Ingredients (%) Ref** 12%CP 16%CP 12%CP 16%CP 12%CP 16%CP
Ground corn 68.90 59.38 49.44 62.51 52.28 64.94 54.43
Soybean meal 19.45 15.58 25.78 14.49 24.80 13.99 24.36
Soybean hulls - 8.56 7.54 - - - -
Rice hulls - - - 7.56 6.66 - -
Cottonseed hulls - - - - - 6.20 5.46
Calcitic limestone 8.56 8.55 8.51 8.38 8.36 8.56 8.52
Soybean oil 1.13 5.53 6.78 4.63 5.96 3.87 5.28
Dicalcium phosphate 1.23 1.32 1.24 1.32 1.24 1.31 1.23
Salt 0.48 0.50 0.48 0.48 0.46 0.50 0.48
DL-methionine 0.15 0.23 0.13 0.24 0.14 0.23 0.14
L-threonine - 0.06 - 0.07 - 0.07 -
L-lysine HCl - 0.19 - 0.22 - 0.23 -
Vit + min premix** 0.10 0.10 0.10 0.10 0.10 0.10 0.10
Total 100.00 100.00 100.00 100.00 100.00 100.00 100.00
Calculated nutritional levels
Metabolizable energy (kcal/kg) 2.900 2.900 2.900 2.900 2.900 2.900 2.900
Crude protein (%) 15.00 12.00 16.00 12.00 16.00 12.00 16.00
Nitrogen (%) 2.36 1.95 2.56 1.95 2.56 1.95 2.56
ADF (%) 4.03 7.16 7.19 8.69 8.54 7.78 7.74
NDF (%) 10.80 14.54 14.15 15.42 14.92 15.03 14.59
Crude fiber (%) 2.40 5.00 5.00 5.00 5.00 5.00 5.00
Available phosphorus (%) 0.33 0.33 0.33 0.33 0.33 0.33 0.33
Total phosphorus (%) 0.53 0.50 0.52 0.50 0.53 0.50 0.53
Calcium (%) 3.65 3.65 3.65 3.65 3.65 3.65 3.65
Sodium (%) 0.22 0.22 0.22 0.22 0.22 0.22 0.22
Digestible lysine (%) 0.71 0.71 0.81 0.71 0.81 0.71 0.81
Total lysine (%) 0.75 0.74 0.86 0.74 0.84 0.74 0.83
Dig. Methionine + cystine (%) 0.65 0.65 0.65 0.65 0.65 0.65 0.65
Total methionine + cystine (%) 0.68 0.68 0.68 0.68 0.68 0.68 0.68
Dig. methionine (%) 0.38 0.42 0.37 0.42 0.37 0.42 0.37
Total methionine (%) 0.39 0.43 0.38 0.43 0.39 0.43 0.38
Digestible threonine (%) 0.49 0.47 0.53 0.47 0.53 0.47 0.53
Total threonine 0.57 0.53 0.62 0.53 0.61 0.53 0.61
ADF: acid detergent fiber, NDF: neutral detergent fiber
(2005), except for crude protein (CP) and crude fiber (CF), as shown in Table 1.
The levels of 0.47% digestible threonine and 0.71% digestible lysine of the 12% CP diet supplied the nutritional requirements proposed by Rostagno
et al. (2005), and the diets with 16% crude protein
contained 0.53% digestible threonine and 0.81% digestible lysine although no synthetic amino acids were included.
Table 2 shows the chemical analyses of the soybean hulls, rice hulls, and cottonseed hulls used to formulate the experimental diets.
Table 2 – Chemical analysis of the fibrous feedstuffs.
Ingredients Soybean
hulls
Rice hulls
Cottonseed hulls
Dry matter (%) 90.15 92.72 89.63
Mineral matter (%) 4.95 19.82 2.78
Crude protein (%) 11.28 2.40 4.25
Nitrogen (%) 1.80 0.38 0.68
Crude fiber (%) 51.34 58.44 40.88
Neutral detergent fiber (%) 67.31 73.07 82.30
Acid detergent fiber (%) 54.94 60.25 56.59
Lignin (%) 1.60 18.15 15.55
At the end of the experimental period, average feed intake (g/hen/d), egg production (%/hen/d), egg weight (g), egg mass (g/hen/d), and feed conversion ratio (kg feed/kg eggs and kg feed/dozen eggs) were
calculated.
During the last two days of each experimental period, four eggs per replicate were randomly collected to determine the following egg quality parameters: Haugh units, eggshell percentage (%), eggshell
thickness (mm), and egg specific gravity (g/cm3).
The degree of yolk pigmentation was observed in each egg with yolk colour fan Roche, with color intensity values ranging between 1 and 15. This scale consists of a color gradient that starts at light yellow (value 1) and ends at orange (value 15).
At the end of the experiment, 196 hens (four per experimental unit) were submitted to a metabolism assay to determine nitrogen intake, excretion, and retention (%). Ferric oxide was added at 1% to the diets as a marker on the first and on the last day of the excreta collection period. Aluminum trays lined with plastic were placed under the cages to allow excreta collection. Excreta were carefully collected twice daily (early morning and late afternoon) for five days. Feed was distributed three times daily to prevent feed wastage and tray contamination with feed. After collection, excreta were placed in plastic bags, identified per replicate, and frozen.
The exact amount of feed offered and excreta produced was determined. After thawing at environ-mental temperature, excreta were homogenized per replicate. A sample of approximately 500 g/replicate was removed, and dried in a forced-ventilation oven at 55ºC for 72 hours. Excreta samples were then pro-cessed in a ball mill to determine dry matter and nitro-gen contents, according to the methodology described by Silva (1990).
Data were submitted to analysis of variance using the General Linear Model (GLM) procedure of SAS® statistical package (SAS Institute, 2002). Means were compared by the test of Tukey at 5% probability level.
RESULTS AND DISCUSSION
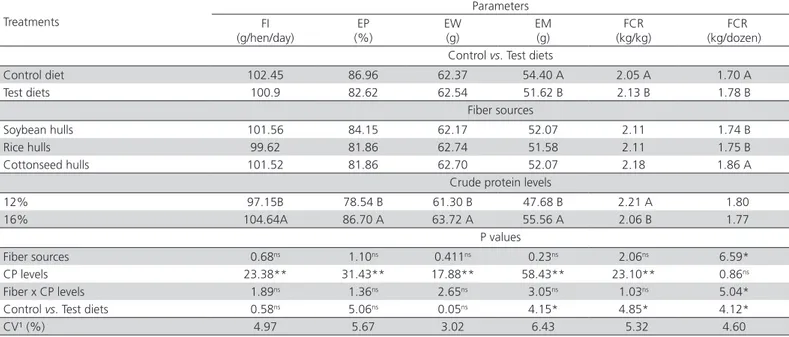
The analyses of the performance data showed the effect of the interaction (p<0.05) between dietary fibers and crude protein levels only on feed conversion ratio per dozen eggs (Table 3). The details of the interaction demonstrate that, within crude protein levels, this effect was significant only for the 16% CP diet, with the diet containing cottonseed hulls resulting in worse feed conversion ratio compared with the other fiber sources. Within fiber sources, crude protein levels affected (p<0.05) feed conversion ratio only when rice hulls were fed, with the highest crude protein level promoting the best feed conversion ratio. Feed conversion ratio was not influenced by the interaction between dietary crude protein levels and the other fiber sources (Table 4).
Egg mass (kg) and feed conversion ratio (kg feed/ dozen eggs) were different (p<0.05) when the test diets were compared to the control treatment. The hens fed the control diet presented higher egg production, higher egg mass, and better feed conversion ratio compared with those receiving diets with high fiber content (Table 3). The control diet was formulated to supply the hens’ requirements, and did not include fibrous feedstuffs, thereby precluding possible adverse effects of fibers on the availability of dietary nutrients. According to
Laurentiz et al. (2005), high dietary crude fiber level
(4.7% vs. 2.70%) reduces feed intake because fiber
distends the stomach, activating the center of satiety, which explains the lower egg production, egg weight, and egg mass, and worse feed conversion ratio (per kg eggs and per dozen eggs) obtained in the study.
of layers was also reported by Roberts et al. (2007),
who tested diets containing 10% dried distillers corn with solubles, 7.30% wheat middlings, and 4.80% soybean hulls.
The tested crude protein levels influenced (p<0.01) all evaluated parameters, except for feed conversion ratio per dozen eggs. The diets formulated with 16% crude protein resulted in higher feed intake, egg production, egg weight, egg mass, and better feed conversion ratio per egg mass (Table 3).
The feed containing 16% crude protein supplied hens’ protein requirements, thereby promoting better performance. These findings are consistent with
those reported by Silva et al. (2010), who evaluated
diets with different crude protein levels (12, 14, 16, and 18%) supplemented with synthetic amino acids and observed that feed intake, egg weight, egg mass, and albumen percentage linearly increased with increasing crude protein levels. On the other hand, when evaluating crude protein level reduction from 16.5 to 15.25% with no amino acid supplementation
in 24-wk-old Lohmann layer diets, Silva et al (2006)
did not find any differences in feed intake or feed conversion ratio per egg mass or per dozen eggs.
Andrade et al. (2003) reduced crude protein levels
from 17 to 16 and 15% (supplemented with Met+Lys; Met+Lys+Thr, and Met+Lys+Thr+Trp) in the diets fed to white layers at the peak of lay, and suggested that dietary protein can be reduced, and require the
supplementation of only Met+Lys. Rizzo et al. (2004)
also concluded that diets containing 14% protein ensure adequate performance of white layers.
Evaluating diets with different crude protein and
fiber levels, Roberts et al. (2007) did not find any
significant effect of the low crude protein diet on egg weight or feed intake during the experimental period. However, worse egg production, egg mass, and feed conversion ratio values were obtained when hens were fed low crude protein diets compared with the diet containing typical protein levels, particularly the diet with 1% crude protein reduction, which resulted in lower egg production. Those authors also observed that the dietary inclusion of 5% soybean hulls did not affect egg production or nitrogen excretion.
Table 4 – Details of the interaction (fiber sources x crude protein levels) for feed conversion ratio (kg feed/dozen eggs).
CP levels
Fiber sources
Parameter
Soybean hulls Rice hulls Cottonseed hulls FCR
(kg/dozen)
12 % 1.78 bA 1.81 aA 1.81 aA
16% 1.70 bB 1.70 bB 1.91 Aa
Means followed by different capital letters in the same column and different small letter in the same row are different by the test of Tukey (p<0.05); FCR: feed conversion ratio.
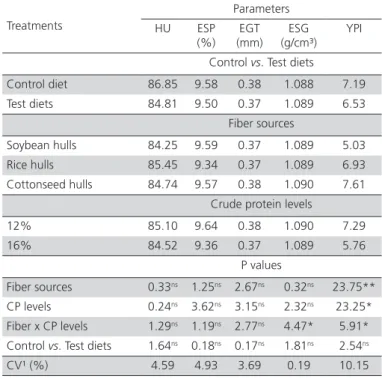
Yolk pigmentation index and egg specific gravity were influenced by the treatments and by the interaction (p<0.05) between fiber sources and crude protein levels (Table 5). The details of the interaction
Table 3 – Means, F values and coefficient of variation of performance parameters of commercial layers fed different fiber sources and two crude protein levels.
Treatments
Parameters FI
(g/hen/day)
EP (%)
EW (g)
EM (g)
FCR (kg/kg)
FCR (kg/dozen) Control vs. Test diets
Control diet 102.45 86.96 62.37 54.40 A 2.05 A 1.70 A
Test diets 100.9 82.62 62.54 51.62 B 2.13 B 1.78 B
Fiber sources
Soybean hulls 101.56 84.15 62.17 52.07 2.11 1.74 B
Rice hulls 99.62 81.86 62.74 51.58 2.11 1.75 B
Cottonseed hulls 101.52 81.86 62.70 52.07 2.18 1.86 A
Crude protein levels
12% 97.15B 78.54 B 61.30 B 47.68 B 2.21 A 1.80
16% 104.64A 86.70 A 63.72 A 55.56 A 2.06 B 1.77
P values
Fiber sources 0.68ns 1.10ns 0.411ns 0.23ns 2.06ns 6.59*
CP levels 23.38** 31.43** 17.88** 58.43** 23.10** 0.86ns
Fiber x CP levels 1.89ns 1.36ns 2.65ns 3.05ns 1.03ns 5.04*
Control vs. Test diets 0.58ns 5.06ns 0.05ns 4.15* 4.85* 4.12*
CV¹ (%) 4.97 5.67 3.02 6.43 5.32 4.60
Means followed by different capital letters in the same column are different by the test of Tukey. ¹Coefficient of variation **p<0.001; * p<0.05; ns = not significant (p>0.05); FI: feed
indicate that egg specific gravity and yolk pigmentation index were not affected by fiber sources when the diet contained 12% CP. However, at 16% CP, rice hulls resulted in lower egg specific gravity and soybean hulls in lower yolk pigmentation index. Within fiber sources, crude protein levels significantly influenced yolk pigmentation index when the diet contained soybean hulls, with lowest index obtained when the diet contained 16% CP. No differences were observed between crude protein levels relative to the other fiber sources (Table 6).
The lower yolk pigmentation index obtained with the diet containing soybean hulls and 16% CP (Table 6) may be explained by the low inclusion of corn, resulting in lower amounts of xanthophyll, thereby resulting in paler egg yolks (Leeson & Summers, 2005).
However, Roberts et al. (2007) did not report any
effect of fiber inclusion on yolk pigmentation index when evaluating diets with different fiber sources (a control diet based on corn and soybean meal, and diets containing soluble fiber, wheat midds, or soybean hulls) and reduced crude protein levels fed to Hy-Line commercial layers.
The comparison of the test diets with the control diet and the analysis of isolated effects of fiber sources and crude protein levels (Table 5) shows no influence (p>0.05) of the evaluated diets on egg quality. Braz
et al. (2011) fed diets with different neutral detergent
fiber (NDF) levels to layers and did not detect any differences in internal egg quality, as evaluated by Haugh units, eggshell percentage and egg specific
gravity. This was also observed by Araújo et al. (2008),
who did not determine any significant differences in the specific gravity of eggs produced by hens fed development feeds containing different wheat midds levels. The egg quality results reported in literature are contradictory, as it may be influenced by factors inherent to the birds (age and genetics), nutrition (raw materials and micro-ingredients), and the environment (egg management, environmental temperature, and
egg storage) (Leandro et al., 2005).
Eggshell percentage and thickness were not influenced by the treatments, which may be explained by the fact that eggshell synthesis requires only a small
amount of protein (Neves, 1998). However, Costa et
al. (2004) fed layers with different crude protein levels
(15.5-17.5%) and verified a positive linear response in eggshell percentage. In a study with brown layers after
the peak of lay, Pavan et al. (2005) did not find any
significant differences in the eggshell percentage of layers fed 14 or 17% crude protein.
Adjusting the composition of commercial layer diets to reduce nitrogen excretion may also affect egg production. Although some feeds result in lower total
nitrogen excretion (Roberts et al., 2007), they can
only be used by egg producers if there are no adverse effects on egg production.
Table 5 – Means, F values and coefficient of variation of egg quality parameters of commercial layers fed different fiber sources and two crude protein levels.
Treatments
Parameters
HU ESP
(%) EGT (mm)
ESG (g/cm³)
YPI
Control vs. Test diets
Control diet 86.85 9.58 0.38 1.088 7.19
Test diets 84.81 9.50 0.37 1.089 6.53
Fiber sources
Soybean hulls 84.25 9.59 0.37 1.089 5.03
Rice hulls 85.45 9.34 0.37 1.089 6.93
Cottonseed hulls 84.74 9.57 0.38 1.090 7.61
Crude protein levels
12% 85.10 9.64 0.38 1.090 7.29
16% 84.52 9.36 0.37 1.089 5.76
P values
Fiber sources 0.33ns 1.25ns 2.67ns 0.32ns 23.75**
CP levels 0.24ns 3.62ns 3.15ns 2.32ns 23.25*
Fiber x CP levels 1.29ns 1.19ns 2.77ns 4.47* 5.91*
Control vs. Test diets 1.64ns 0.18ns 0.17ns 1.81ns 2.54ns
CV¹ (%) 4.59 4.93 3.69 0.19 10.15
Means followed by different capital letters in the same column are different by the test of Tukey. ¹Coefficient of variation **p<0.001; * p<0.05; ns = not significant (p>0.05);
HU: haugh units; ESP: eggshell percentage; EGT: eggshell thickness; ESG: egg specific gravity; YPI: yolk pigmentation index.
Table 6 – Details of the effects of the interaction (fiber sources vs. CP levels) on egg specific gravity (ESG) and yolk
pigmentation index (YPI).
CP levels
Fiber sources
Parameters Soybean
hulls
Rice hulls Cottonseed hulls
ESG (g/cm3)
12 % 1.089Aa 1.091Aa 1.090Aa
16% 1.090Aa 1.088Ba 1.089Aa
YPI 12 % 6.56Aa 7.39Aa 7.91Aa
16% 3.50Bb 6.48Aa 7.31Aa
Means followed by different capital letters in the same column and different small letter in the same row are different by the test of Tukey (p<0.05).
The egg quality results obtained in the present
study are not consistent with the findings of Silva et al.
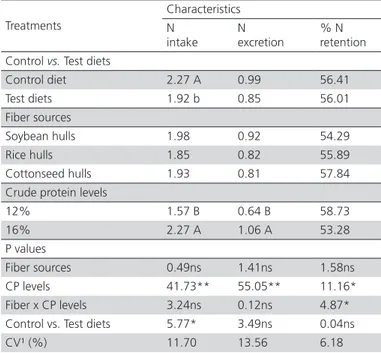
Relative to the evaluated nitrogen metabolism parameters, there was a significant effect (p<0.05) of the interaction between fiber sources and crude protein levels only on nitrogen retention (Table 7). Considering protein levels, differences among fiber sources were detected only at the 16% CP level, with soybean hulls and rice hulls presenting lower nitrogen retention (Table 8). Within fiber sources, crude protein levels affected (p<0.05) nitrogen retention when soybean hulls and rice hulls were fed. The diet with lower crude protein level (12%) promoted higher nitrogen retention. There was no effect of cottonseed hulls, independently of dietary crude protein level (Table 8).
Nitrogen intake (g/hen/d) was different (p<0.05) when the test diets were compared with the control diet. The analysis of data showed that the hens fed the reference diet presented higher nitrogen intake compared with those fed different fiber sources and crude protein levels (Table 7). In a study with layers
fed different fiber sources, Roberts et al. (2007) found
higher nitrogen intake in hens fed fibers relative to those fed the control diet (p<0.001). This confirmed
the previous findings of Stein et al. (2006), who
demonstrated that nitrogen intake increased due to the lower digestibility of amino acids in fibrous feedstuffs, thereby a higher intake of total amino acids, and consequently of nitrogen, was needed to supply hens’ digestible amino acid requirements.
In the present study, higher nitrogen excretion by the hens fed the reference diet based on corn and soybean meal was expected due to their higher nitrogen intake, which was not observed.
The analysis of the isolated factors showed that fiber sources had no effect on nitrogen intake, excretion or retention (p>0.05), but when crude protein level was considered, the diets containing 12% CP resulted in lower nitrogen intake and excretion than the diets with 16% CP (p<0.01), but in higher nitrogen retention (p>0.05). It possible that the diets with low protein level did not supply nitrogen requirements, thereby promoting higher nitrogen retention (Table 8).
Dietary crude protein levels influenced nitrogen intake and excretion, which are directly associated with dietary nutrient availability, i.e., the higher the protein intake, the higher its excretion. On the other hand, low crude protein levels determine low nitrogen availability, and therefore, better nitrogen utilization.
Silva et al. (2010), studying the effect of different
crude protein levels (12, 14, 16, or 18%) on the nitrogen balance of Hisex White 49-wk-old layers, observed a positive linear effect on nitrogen intake and
excretion. The utilization of fecal nitrogen exceeded 50% only when the 12% crude protein diet was fed.
Table 7 – Means, F values and coefficient of variation of nitrogen intake, retention, and excretion of commercial layers fed different fiber sources and two crude protein levels.
Treatments
Characteristics N
intake N excretion
% N retention Control vs. Test diets
Control diet 2.27 A 0.99 56.41
Test diets 1.92 b 0.85 56.01
Fiber sources
Soybean hulls 1.98 0.92 54.29
Rice hulls 1.85 0.82 55.89
Cottonseed hulls 1.93 0.81 57.84
Crude protein levels
12% 1.57 B 0.64 B 58.73
16% 2.27 A 1.06 A 53.28
P values
Fiber sources 0.49ns 1.41ns 1.58ns
CP levels 41.73** 55.05** 11.16*
Fiber x CP levels 3.24ns 0.12ns 4.87*
Control vs. Test diets 5.77* 3.49ns 0.04ns
CV¹ (%) 11.70 13.56 6.18
Means followed by different capital letters in the same column are different by the test of Tukey. ¹Coefficient of variation **p<0.001; * p<0.05; ns = not significant (p>0.05).
Table 8 – Details of the effect of the interaction (fiber sources vs. CP levels) on nitrogen retention %.
CP levels
Fiber sources
Characteristic
Soybean hulls Rice hulls Cottonseed hulls N
Retention %
12 % 59.44Aa 59.72Aa 57.04Aa
16% 49.13Bb 52.07Bb 58.63Aa
Means followed by different capital letters in the same column and different small letter in the same row are different by the test of Tukey (p<0.05).
CONCLUSIONS
The inclusion of fiber in diets with low crude protein levels negatively affected the performance and the egg production and quality of layers, but reduced nitrogen excretion in the environment. Dietary crude protein reduction, associated with the inclusion of different fiber sources, may reduce environmental pollution, but should not be considered an alternative when aiming at higher egg production.
REFERENCES
Araújo DM, Silva JHV. Enzimas exógenas em dietas contendo farelo de trigo e outros alimentos alternativos para aves. revisão. PUBVET 2008;2(47): 453-453.
Braz NM. Fibra na ração de crescimento e seus efeitos no desempenho de poedeiras
nas fases de crescimento e postura. Revista Brasileira de Zootecnia 2011;40(12):2744-2753.
Costa FGP, Souza HC, Gomes CAV, Barros LR, Brandão PA, Nascimento GAJ, Santos AWR, Amarante Junior VS. Níveis de proteína bruta e energia metabolizável na produção e qualidade dos ovos de poedeiras da linhagem Lohmann Brown. Ciência e Agrotecnologia; 2004;28(6):1421-1427.
Laurentiz AC, Filardi RS, Rodrigues EA. Níveis de aminoácidos sulfurados totais para poedeiras semi-pesadas após a muda forçada. Ciência Rural 2005;35(1):164-168.
Leandro, NSM, Deus, HAB, Stringhini, JH, Café, MB, Andrade, MA, Carvalho, CF. Aspectos de qualidade interna e externa de ovos comercializados em diferentes estabelecimentos na região de Goiânia. Ciência Animal Brasileira 2005;6(2):71-78.
Leeson S, Summers JD. Commercial poultry nutrition. 3rd ed. Guelph: Univ.
Books, Guelph; 2005.
Neves MA. Alternativas para valorização da casca de ovo como complemento alimentar e em implantes ósseos [dissertação]. Florianópolis (SC): Universidade Federal de Santa Catarina; 1998.
Pavan AC, Mori C, Garcia EA. Níveis de proteína bruta e de aminoácidos sulfurosos totais sobre o desempenho, a qualidade dos ovos e a excreção de nitrogênio de poedeiras de ovos marrons. Revista Brasileira de Zootecnia 2005;34(2):557-568.
Rizzo, MF, Deponti, BJ, Silva, FH. Alimentação de poedeiras com diferentes níveis de proteína e lisina. Utilização e excreção de nitrogênio. Revista Brasileira de Ciência Avícola 2004;6: 26-26.
Roberts SA, Xin H, Kerr BJ, Russel JR., Bregendahl K. Effects of dietary fiber and reduced crude protein on ammonia emission from laying-hen manure. Poultry Sciense 2007; 86:1716–1725.
Rostagno HS, Albino LFT, Donzele JL. Tabelas brasileiras para aves e suínos: composição de alimentos e exigências nutricionais. Viçosa, (MG): Universidade Federal de Viçosa; 2005. 186p.
SAS. Institute SAS ® user’ guide: statistics. Cary, NC; 2002.
Silva DJ. Análise de alimentos (métodos químicos e biológicos). Viçosa, MG: UFV; 1990. 166p.
Silva EL, Silva JHV, Filho JJ, Ribeiro MLG, Martins TDD, Costa FGP. Redução dos níveis protéicos e suplementação com metionina e lisina em rações para poedeiras leves. Revista Brasileira de Zootecnia 2006;35(2):491-496.
Silva MFR, Faria DM, Rizzoli PW,Santos AL, Sakamoto MI, Souza HRB. Desempenho, qualidade dos ovos e balanço de nitrogênio de poedeiras comerciais alimentadas com rações contendo diferentes níveis de proteína bruta e lisina. Revista Brasileira de Zootecnia 2010;39(6):1280-1285.
Silva YL, Rodrigues CP, Freitas RTF. Redução de proteína e fósforo em rações com fitase para frangos de corte no período de 1 a 21 dias de idade: desempenho e teores de minerais na cama. Revista Brasileira de Zootecnia 2006;35(3):840-848.