http://www.uem.br/acta ISSN printed: 1806-2636 ISSN on-line: 1807-8672
Doi: 10.4025/ actascianimsci.v39i4.36122
Digestible protein requirement for Nile tilapia fed with rations
based on soybean meal and corn
William Franco Carneiro¹*, Fernanda Pandini2, Lilian Carolina Rosa da Silva2, Lilian Dena dos Santos2, Katsciane Aparecida Rossato2 and Fábio Meurer²
1
Programa de Pós-graduação em Zootecnia, Universidade Federal de Lavras, Av. Doutor Sylvio Menicucci, 1001, 37200-000, Lavras, Minas Gerais, Brazil. 2
Programa de Pós-Graduação em Aquicultura e Desenvolvimento Sustentável, Universidade Federal do Paraná, Palotina, Paraná, Brazil. *Author for correspondence. E-mail: [email protected]
ABSTRACT. The objective was to determine the requirement of digestible protein (DP) for Nile tilapia fed with diets based on soybean meal and corn. Two hundred Nile tilapia juveniles, sexually reversed, were used for a trial period of 100 days. The animals were distributed in 20 boxes of 1000 L-1 in a random design
with five treatments and four replications, the boxes were connected to a water recirculation system. Five isoenergetic diets were tested with different levels of digestible protein (DP): 20, 25, 30, 35 and 40%. At the end of the experimental period were evaluated the zootechnical performance data. A quadratic effect (p < 0.05) was shown to parameters of final weight, weight gain, final length, fillet yield and visceral fat with the best points that ranged from 28.3 to 29.9% of DP. The largest area of hepatocytes was found to the lowest levels of DP in the diet (20 and 25%) compared to the other levels, which were similar. Thus, Nile tilapia has adequate performance for the consumption of diets based on soybean and corn meal and the recommended level is 28.3% of PD in these conditions.
Keywords: plant origin feed, aquaculture, fish nutrition.
Exigência de proteína digestível para tilápias do Nilo alimentadascom rações à base de
farelo de soja e milho
RESUMO. Objetivou-se determinar a exigência de proteína digestível (PD) para a tilápia do Nilo, alimentada com dietas à base de farelo de soja e milho. Duzentos juvenis de tilápia do Nilo (32,80 ± 0,39 g), sexualmente revertidos, foram utilizados por um período experimental de 100 dias. Os animais foram distribuídos em 20 caixas de 1000L-1 em delineamento aleatório com cinco tratamentos e quatro repetições.
As caixas eram ligadas a um sistema de recirculação de água. Foram testadas cinco dietas isoenergéticas com diferentes níveis de PD: 20, 25, 30, 35 e 40%. Ao final do período experimental, foram avaliados os dados de desempenho zootécnico. Um efeito quadrático (p < 0,05) foi mostrado aos parâmetros de peso final, ganho em peso, comprimento final, rendimento de filé e de gordura visceral com os melhores pontos que variaram de 28,3 a 29,9% de PD. A maior área dos hepatócitos foi encontrada para os níveis mais baixos de PD na dieta (20 e 25%), em comparação com os outros níveis, que foram semelhantes. Assim, pode-se afirmar que a tilápia do Nilo tem desempenho adequado para o consumo de dietas baseadas em farelo de soja e milho e o nível recomendado é de 28,3% PD nestas condições.
Palavras-chave: alimentos de origem vegetal, aquicultura, nutrição de peixes.
Introduction
Protein is a basic nutrient to feed fish because it provides amino acids and nitrogen for body protein and non-protein nitrogen substances biosynthesis and can be used as a source of energy and synthesis of glucose (National Research Council [NRC], 2011). The dietary protein is an important aspect in achieving efficient fish production; otherwise the dietary protein should accommodate fish requirements due to age/size (Abdel-Tawwab & Ahmad, 2009).
In fish, due to easiness wastes of nitrogenous excretion with low energy expenditure and its abun-
dance in natural feed, the protein becomes an important energy source. For aquaculture, the use of protein for energy or gluconeogenic purposes must be the minimum as possible. If the fish feeds more protein than its requirement will not only result in increased cost to the farmer, but also the deterioration of water quality caused by increased excretion of nitrogenous wastes (Ng & Hanim, 2007).
terms of health and cost. The benefit of using vegetable protein as an alternative source is not necessarily related to nutritional composition but also to lower prices and local availability (Goda, Wafa, El-Haroun, & Kabir Chowdhury, 2007).
The substitution of ingredients of animal origin for ingredients of plant origin is a completely consolidated practice in aquaculture (Cyrino, Bicudo, Sado, Borghesi, & Dairik, 2010) and the use of soybean and corn meal can reduce the costs and improve the production efficiency. Soybean meal is widely used as an alternative to fish meal in the feeding of many animals in aquaculture due to its high protein content and relatively balanced amino acid profile (Gatlin et al., 2007).Corn meal has apparent digestibility coefficient of crude energy higher than 90% for tilapia, in addition to presenting good values of digestible protein compared to other energy foods (Furuya, 2010).
The use of rations based on soybean and corn meal for feeding Nile tilapia is a great advantage from an economic point of view, since the determination of protein requirements for this species allows a better standardization of these values due to the lower variation in the composition of these foods in relation to the animal origin. According to above, an experiment was designed to determine the level of digestible protein requirement for Nile tilapia from 30 to 130g on growth parameters, body composition and liver histology.
Material and methods
The present work was carried out at the Laboratory of Aquatic Organisms Nutrition at the Federal University of Parana, Palotina Sector, during a period of 100 days. It was approved by the Ethics Committee and Animal Use of the Federal University of Parana in 03/10/2010 - Protocol No. 11/2010-CEUA UFPR Palotina Sector.
Two hundred Nile tilapia (GIFT strain), sexually reversed, weighing 32.80 ± 0.39 g were used. The fish have been stocked in water recirculation structure of 20 circular fiberglass tanks (1,000 L) in a completely randomized design with five treatments and four replications. The experimental units were aerated through a pipe connected to an electric blower (1 hp). The mechanical and biological filtration of water was divided into six boxes of 2000 L, so that the first four were used for removal of suspended particles and the last two for biological filtration. This filtration was performed by
substrates and aquatic macrophytes (Eichornia
crassipes and Egeria brasiliensis) and subsequently was
pumped into the system by an electric pump (0.75hp).
The treatments consisted of five diets (Table 1) and increasing levels of digestible protein (DP) as recommended by National Research Council (NRC, 2011) to meet the nutritional needs of Nile tilapia juveniles. The corn and soybean meal were milled (0.7 mm sieve), mixed and processed according to the formulations. Subsequently, they were stored in plastic bags at refrigerated environment during the experimental period.
Feeding was carried out three times a day (ad
libitum). Temperature and dissolved oxygen were measured twice a day (8:00 and 4:00 pm) with a portable oximeter (LUTRON, DO-5519, Taiwan). Total alkalinity and hardness were determined by titration according to Macêdo (2001). Ammonia was determined with the use of UV-vis spectrophotometer (BEL photonics, SP 2.000 UV, SP, Brazil) according to Koroleff (1976) and nitrite was determined by means of the reaction of Griess according to Baumgarten, Rocha and Niencheski (1996). All these analyses were evaluated weekly and carried out at the Laboratory of Limnology and Water Quality, Federal University of Paraná - Palotina Sector. The pH and electrical conductivity were evaluated every 15 days with electronic meters (digital pH meter TECNOPON mPA 210 and digital conductivity meter TECNOPON MCA -150P, SP, Brazil).
The average water temperature was 20.1 ± 2.9ºC in the morning and 23.3 ± 2.7ºC in the afternoon. The average dissolved oxygen in experimental tanks
was equal to 6.9 ± 1.5 mg L-1, pH was 8.0 ± 0.2,
electrical conductivity was 202.2 ± 22.9 mS cm-1,
hardness, alkalinity, nitrite and ammonia was 52,15
± 0,56 ofCaCO3; 104,79 ± 0,36 mg L-1of CaCO3,
0,0021 ± 0,0 mg L-1of NO
3 and 0,20 ± mg L-1of
NH3OH, respectively.
At the end of the experiment, the fish were
anesthetized (eugenol 75 mg l-¹) (Moreira, Teixeira,
Carreiro & Moreira, 2010), weighed and measured (height, width, length and head) individually for the assessment of body parameters, chemical composition of the carcass and liver histology. In each experimental unit three animals were selected and randomly slaughtered to assessment of body yield parameters and histological evaluation (Vicentini et al., 2005)
performed on the Zeiss AxioCam ERc 5s photomicroscope on a 40X objective using the
Image-Pro® Plus - Version 4.5 computerized
imaging system for Windows (Media Cybernetics, Inc., Rockville, USA).
The final results of the evaluated parameters were submitted to variance analysis with significance level of 5% and in the case of statistical difference were applied regression analysis, using the SAEG program.
Table 1. Chemical and ingredient composition of the experimental diets.
Ingredient (%) Digestible Protein (%) 20.0 25.0 30.0 35.0 40.0 Soybean meal 37.7 51.9 66.1 80.3 94.5
Corn 56.7 42.9 29.1 15.2 1.4
Soybean oil 1.4 1.3 1.1 0.9 0.8
Dicalcium phosphate 2.4 2.1 1.8 1.6 1.3
Limestone 0.2 0.2 0.3 0.4 0.4
Mineral and vitamic complex1
1.0 1.0 1.0 1.0 1.0
Salt 0.5 0.5 0.5 0.5 0.5
Nutrient (%)
Crude protein 22.2 27.8 33.5 39.1 44.8 Digestible energy (kcal kg-1) 3,000.0 3,000.0 3,000.0 3,000.0 3,000.0
Crude energy (kcal kg-1) 4,002.1 4,046.5 4,090.9 4,135.4 4,179.8
Lysine 1.2 1.5 1.9 2.3 2.6
Methionine + Cystine 0.7 0.8 0.9 1.1 1.2 Threonine 1,02 1,17 1,28 1,55 1,70
Starch 40.4 33.7 27.0 20.4 13.6
Fat 4.7 4.3 3.9 3.5 3.0
Linoleic acid 2.1 1.9 1.6 1.4 1.1
Ash 6.2 6.8 7.4 7.9 8.5
Phosphorus 0.8 0.8 0.8 0.8 0.8
Calcium 0.8 0.8 0.8 0.8 0.8
Crude fiber 3.3 3.9 4.5 5.1 5.6
Dry matter 91.4 91.5 91.7 91.9 92.1
1Security levels by kilogram of product: vit. A - 500.000 UI; vit. D3 - 200.000 UI; vit. E-
5.000 mg; vit. K3 - 1.000 mg; vit. B1 - 1.500 mg; vit. B2 - 1.500 mg; vit. B6 -1.500 mg; vit. B12 - 4.000 mg; folic acid - 500 mg; calcium pantothenate - 4.000 mg;vit. C - 15.000 mg; biotin - 50 mg; inositol - 10.000; nicotinamide - 7.000; choline -40.000 mg; cobalt - 10 mg; cooper - 500 mg; iron - 5.000 mg; iodine - 50 mg;manganese - 1.500 mg; selenium - 10 mg; zinc - 5.000 mg.
Results and discussion
There was a quadratic effect (p < 0.05) to final weight mean and daily weight gain of fish in relation to the increase in protein levels of the diet, with the maximum point of 28.3% of DP (Figure 1, Table 2). To the body parameters, total length (p < 0.05) was significantly influenced by the treatments, showing a quadratic function of the protein levels, with its point of maximum of 29.4% of DP (Table 2). The other body parameters (Table 2) as height, width, length and head were not affected by the treatments (p > 0.05).
The maximum DP level determined in this experiment for mean final weight, weight gain and daily weight gain was 28.3% of PD, with a decrease in the subsequent levels. This may be due to an excess protein fraction metabolized for the energy production, since there was a reduction of other energy sources of the rations as the increased levels
of PD. On the other hand, when the supply of protein in the diet is lower than the requirement, the interruption of growth and weight gain can occur. This reduction occurs due to the protein withdrawal from less vital tissues (muscle) to maintain the vital tissues functions (Halver & Hardy, 2002).
Figure 1. Final weight, fillet yield and visceral fat means of Nile tilapia submitted to diets with increasing levels of digestible protein.
The decrease in the performance of Nile tilapia after reaching the requirement value is related to the greater energy expenditure to metabolize the excess of absorbed amino acids (Jauncey, 2000). The value is slightly below the requirement (29.0% of DP)
presented to tilapia (Oreochromis spp.) or to the
recommended value of CP (34.0%) for Nile tilapia from 20 to 200g by the NRC (2011). Similar results were found by Puppo et al. (2017), who evaluated the reduction of crude protein by application of the ideal protein concept for Nile tilapia from 14 to 55 g. There was no difference found in weight gain for fish fed diets varying between 25.5 and 30.0% of DP. Li, Bordinhon, Davis, Zhang and Zhu (2013) did not verify significant differences in juvenile Nile tilapia fed diets containing 25 and 30% of CP. Costa, Melo and Correia (2009) recommends for a phase of 80 to 300g a diet of 32% of CP without causing harm to animals.
Likewise, in relation to the results presented by Meurer et al. (2007) for Nile tilapia (10 to 30g), there is no significant difference between the weight gain shown by fish fed diets containing 25 and 30% of DP. However, the present results showed by Ng and Hanim (2007), who found that Nile tilapia, variety GIFT, weighing about 13 to 60g achieved a greater final weight fed diets containing 35 instead 25% of CP.
value for the best weight gain is above to the studied range. In this study was found the reduction of 27 to 22.7% of DP, diets supplemented with essential amino acids did not cause significant effect on initial and final weight. A similar phenomenon when compared to the results of Bomfim, Lanna, Donzele, Ferreira et al. (2008), who worked with Nile tilapia fingerlings. The differences between these results compared to the literature can be related to the differences in the diet, as the use of other protein sources or presence of synthetic amino acids. This leads to a different amino acid profile, both quantitatively and digestible and can cause alterations in the responses in terms of fish growth. The difference between strains, growth stages and environmental parameters were performed in the experiments.
A quadratic response (p < 0.05) for fillet yield (FY) of the increasing levels of DP in the ration was obtained, showing a point of maximum of 29.95% of DP (Figure 2). The FY varied according to the weight of the animals and the heavier the fish, the greater was the FY, corroborating with Ribeiro et al. (1998), who evaluated different weight classes and they concluded that the fish in the largest weight class had the highest FY.
Diets with lower levels of DP may not have provided the requisite amount of amino acids for the muscle fibers synthesis. Another possible explanation may be due to the diets with lower levels of DP show a greater ratio of DE:DP, which can inhibit the voluntary intake of the animals before sufficient consumption of the diet, especially of amino acids, which may have been insufficient for protein synthesis necessary for tissue deposition and consequently, an increased of FT (NRC, 2011).
The results of FY were similar to those found by Fernandes et al. (2016), who did not observe differences in the diets with 30 and 32% of DP. Koch et al. (2014) evaluated the sales profitability of Nile tilapia fillets and recommend the use of 32% of DP to increase the FY and consequently the sales profitability. Botaro et al. (2007) evaluated the reduction of dietary protein, based on the ideal protein concept, and did not find any effect of DP, the result found by these authors can be explained by the supplementation of some essential amino acids in the diets.
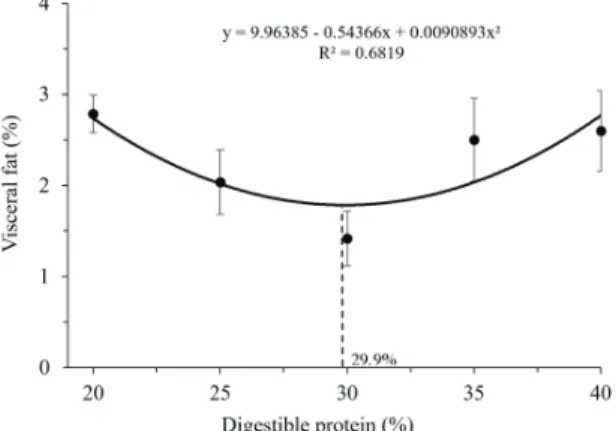
A quadratic effect was also observed for the visceral fat average, with minimum point of 29.9% (Figure 3). Unlike found in this work, Furuya et al. (2005) did not observe the effect of DP about visceral fat values and this fact is probably related to the diet supplementation of lysine, methionine and threonine.
Figure 2. Fillet yield of Nile tilapia submitted to diets with increasing levels of digestible protein.
The presence of an excess of visceral fat is a current problem in several commercial breeding of Nile tilapia in Brazil and it is probably related to nutritional imbalance in the diet.
Figure 3. Visceral fat percentile of Nile tilapia submitted to diets with increasing levels of digestible protein.
Regarding to the values of the other cut yields index, liver and visceral fat were not affected (p > 0.05) by the treatments, whose parameters were the carcass percentage, percentage of carcass without head, percentage of clean trunk and hepatosomatic index (Table 2).
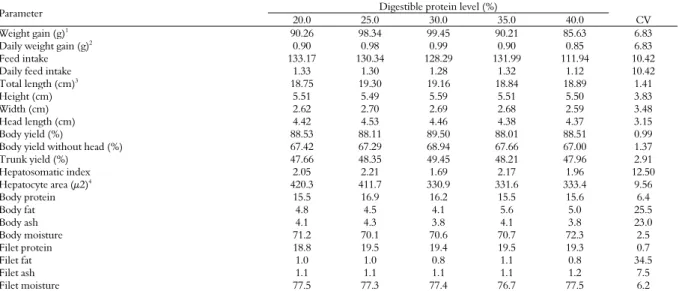
Table 2. Performance, body yield and body chemical parameters of Nile tilapia submitted to diets with increasing levels of digestible protein.
Parameter Digestible protein level (%)
20.0 25.0 30.0 35.0 40.0 CV
Weight gain (g)1 90.26 98.34 99.45 90.21 85.63 6.83
Daily weight gain (g)2
0.90 0.98 0.99 0.90 0.85 6.83
Feed intake 133.17 130.34 128.29 131.99 111.94 10.42
Daily feed intake 1.33 1.30 1.28 1.32 1.12 10.42
Total length (cm)3 18.75 19.30 19.16 18.84 18.89 1.41
Height (cm) 5.51 5.49 5.59 5.51 5.50 3.83
Width (cm) 2.62 2.70 2.69 2.68 2.59 3.48
Head length (cm) 4.42 4.53 4.46 4.38 4.37 3.15
Body yield (%) 88.53 88.11 89.50 88.01 88.51 0.99
Body yield without head (%) 67.42 67.29 68.94 67.66 67.00 1.37
Trunk yield (%) 47.66 48.35 49.45 48.21 47.96 2.91
Hepatosomatic index 2.05 2.21 1.69 2.17 1.96 12.50
Hepatocyte area (μ2)4 420.3 411.7 330.9 331.6 333.4 9.56
Body protein 15.5 16.9 16.2 15.5 15.6 6.4
Body fat 4.8 4.5 4.1 5.6 5.0 25.5
Body ash 4.1 4.3 3.8 4.1 3.8 23.0
Body moisture 71.2 70.1 70.6 70.7 72.3 2.5
Filet protein 18.8 19.5 19.4 19.5 19.3 0.7
Filet fat 1.0 1.0 0.8 1.1 0.8 34.5
Filet ash 1.1 1.1 1.1 1.1 1.2 7.5
Filet moisture 77.5 77.3 77.4 76.7 77.5 6.2
1y = 16.5853 + 5.76707x – 0.101914x2 r2 = 0.87; 2y = 0.165853 + 0.0576707x – 0.000101914x2 r2 = 0.87; 3y = 16.2626 + 0.196386x – 0.00333247x2 r2 = 0.46; 4y = 0.2923x2 - 22.615x +
766.36 r2 = 0.84;
In the presence of hepatopancreatic tissue in pancreatic acinar cells containing secretory granules numerous eosinophils was also observed. The results of this study fit to the description of liver morphology of teleost and to Nile tilapia (Vicentini et al., 2005). The cytoplasm vacuolization indicates the probable location of lipid and glycogen reserves in hepatocytes. Hepatocyte reduction with the highest protein levels was due to the decreased area of the vesicles presented in the cytoplasm. It may be justified by the higher energy expenditure as the use of the reserves of glycogen and lipids caused by the change in cell metabolism (Figure 4).
Figure 4. A - Photomicrography of the histological aspects of Nile tilapia hepatocytes fed diets based on soybean and corn meal with increasing levels of digestible protein. Arrangement of hepatocytes (H) surrounded by sinusoidal capillaries (S). B – Large vacuolization in the cytoplasm of the hepatocyte, which may indicate large deposition of lipids. The objective increase for the area measurement was 40x and the hematoxylin and eosin (H & E) staining.
The literature presents some data related to the essential amino acids requirements for Nile tilapia and according to He et al. (2013), lysine and methionine are the most limiting amino acids in
diets based on plant origin feed. The lysine requirement for Nile tilapia varies between 1.31 to 2.32% (Furuya et al., 2012, 2013; Michelato et al., 2016), the values of dietary total lysine that showed the best results in this experiment remained between 1.79 to 1.91%.
For methionine and cystine, the literature recommends values between 0.91 to 1.00% (Bomfim, Lanna, Donzele, Ferreira et al., 2008; Michelato et al., 2013) to Nile tilapia, values close to 0.90 to 0.95% for protein levels showed better performances. For threonine, the recommendation varies between 1.11 to 1.43% (Bomfim, Lanna, Donzele, Quadros et al., 2008) and the diets that showed the best values in this experiment were 1.20 to 1.70%.
Thus, one explanation for the protein levels that promoted better performance in this experiment may be related to the diets that contain these protein levels and present values of some essential amino acids close to the requirements determined in the literature for the species. It should be highlighted the difference between the results of the maximum points presented by final weight, fillet yield and fat percentage parameters. To achieve the best weight would be necessary a lower protein level (28.3%) to achieve the best fillet yield and the lowest percentage of fat deposition in the carcass (29.9% of DP).
The similarity between the requirement values of DP to the best fillet yield and lower fat percentage shows that the fillet yield is inversely proportional to the deposition of fat in the carcass. This result allows inferring that the best growth at this stage is not
B A
directly linked to better protein deposition in muscle and is necessary a slightly higher protein value for this to occurs.
However, to the results for better muscle protein deposition, less protein is wasted, since low level of visceral fat occurs. This is in agreement with the statement and Ng and Hanim (2007) that the protein is a good source of energy for fish and excess energy in this case is stored as a perivisceral adipose tissue.
As the diets were isocaloric, those with lower values of DP probably not provide the appropriate level of amino acids for growth and a relative excess of energy. Thus, the excess energy intake in form of starch and fat were stored in form of visceral fat. In the diets that contain higher protein amounts through amino acids excess in the carbon chain were probably deposited as fat and ammonia removed to the environment. In this case, it should be noted that fat synthesis is an endergonic pathway (Nelson & Cox, 2014), so eventually becomes an energy drain that competes with the growth itself, reason that this may have led to the reduction in area due to hepatocyte reduction of energy reserves of lipids and glycogen in liver cells.
The possibility of using soybean and corn meal as a food base of Nile tilapia offers advantages in relation to the fish meal. Soybean and corn meal have great availability and there is no limitation as the fish meal, which undergoes variations in price and quality according to the demand. This reduces possible future sanitary problems associated with the use of animal food in the manufacture of feed for this species. And finally, can improve the marketing of Nile tilapia production chain, with the possibility to use of green fish term, because in this case it would be fed with diet produced through plant origin ingredients.
Conclusion
Nile tilapia grows suitably with diets based on soybean meal and corn and it is recommended to use 28.3% of digestible protein (31.6% of crude protein) for Nile tilapia between 30 and 130g.
References
Abdel-Tawwab, M., & Ahmad, M. H. (2009). Effect of dietary protein regime during the growing period on growth performance, feed utilization and whole-body chemical composition of Nile Tilapia, Oreochromis
niloticus (L.). Aquaculture Research,40(13), 1532-1537.
Baumgarten, M. D. G. Z., Rocha, J. M. B., & Niencheski, L. F. H. (1996). Manual de análises em oceanografia
química. Rio Grande, RS: Furg.
Bomfim, M. A. D., Lanna, E. A. T., Donzele, J. L., Ferreira, A. S., Ribeiro, F. B., & Takishita, S. S. (2008). Exigência de metionina mais cistina, com base no conceito de proteína ideal, em rações para alevinos de tilápia-do-nilo. Revista Brasileira de Zootecnia, 37(5), 783-790.
Bomfim, M. A. D., Lanna, E. A. T., Donzele, J. L., Quadros, M., Ribeiro, F. B., & Araújo, W. A. G. de. (2008). Digestible threonine requirement of Nile tilapia fingerlings using ideal protein concept. Revista
Brasileira de Zootecnia,37(12), 2077-2084.
Botaro, D., Furuya, W. M., Silva, L. C. R., Santos, L. D., Silva, T. S. C., & Santos, V. G. (2007). Redução da proteína da dieta com base no conceito de proteína ideal para tilápias-do-nilo (Oreochromis niloticus) criadas em tanques-rede. Revista Brasileira de Zootecnia, 36(3), 517-525.
Costa, M. S., Melo, F. P., & Correia, E. S. (2009). Effect of different feeding regimes on the growth of tilapia Chitralada (Oreochromis niloticus Linnaeus, 1757) cultured in cages. Boletim do Instituto de Pesca, 35(2), 285-294.
Cyrino, J. E. P., Bicudo, Á. J. A., Sado, R. Y., Borghesi, R., & Dairik, J. K. (2010). A piscicultura e o ambiente - o uso de alimentos ambientalmente corretos em piscicultura. Revista Brasileira de Zootecnia, 39(Suppl. spe), 68-87.
Fernandes, A. C., Junior, Carvalho, P. L. P. F., Pezzato, L. E., Koch, J. F. A., Teixeira, C. P., Cintra, F. T., … Barros, M. M. (2016). The effect of digestible protein to digestible energy ratio and choline supplementation on growth, hematological parameters, liver steatosis and size-sorting stress response in Nile tilapia under field condition. Aquaculture,456, 83-93.
Furuya, W. M. (2010). Tabelas brasileiras para a nutrição de
tilápias. Toledo, PR: GFM.
Furuya, W. M., Graciano, T. S., Vidal, L. V. O., Xavier, T. O., Gongora, L. D., Righetti, J. S., & Furuya, V. R. B. (2012). Digestible lysine requirement of Nile tilapia fingerlings fed arginine-tolysine-balanced diets. Revista
Brasileira de Zootecnia,41(3), 485-490.
Furuya, W. M., Michelato, M., Graciano, T. S., Vidal, L. V. O., Xavier, T. O., Furuya, V. R. B., & Moura, L. B. (2013). Exigência de lisina digestível para a tilápia-do-Nilo de 87 a 226 g alimentada com dietas balanceadas para a relação arginina:lisina. Semina: Ciências Agrárias, 34(4), 1945-1954.
Furuya, W. M., Botaro, D., Macedo, R. M. G., Santos, V. G., Silva, L. C. R., Silva, T. C., … Sales, P. J. P. (2005). Ideal protein concept for dietary protein reduction of juvenile nile tilapia (Oreochromis niloticus).
Revista Brasileira de Zootecnia,34(5), 1433-1441.
Gatlin, D. M., Barrows, F. T., Brown, P., Dabrowski, K., Gaylord, T. G., Hardy, R. W., … Wurtele, E. (2007). Expanding the utilization of sustainable plant products in aquafeeds: a review. Aquaculture Research,38(6), 551-579.
feed utilization of Nile tilapia Oreochromis niloticus
(Linnaeus, 1758) and tilapia galilae Sarotherodon galilaeus (Linnaeus, 1758) fingerlings fed plant protein-based diets. Aquaculture Research, 38(8), 827-837.
Graciano, T. S., Natali, M. R. M., Vidal, L. V. O., Michelato, M., Righetti, J. S., & Furuya, W. M. (2010). Desempenho e morfologia hepática de juvenis de tilápia-do-nilo alimentados com dietas suplementadas com metionina e colina. Pesquisa Agropecuária Brasileira, 45(7), 737-743.
Halver, J. E., & Hardy, R. W. (2002). Fish nutrition. San Diego, CA: Academic Press.
He, J.-Y., Tian, L.-X., Lemme, A., Gao, W., Yang, H.-J., Niu, J., … Liu, Y.-J. (2013). Methionine and lysine requirements for maintenance and efficiency of utilization for growth of two sizes of tilapia
(Oreochromis niloticus). Aquaculture Nutrition,19(4),
629-640.
Jauncey, K. (2000). Nutritional requiremnt. In M. C. M. Beveridge, & B. J. McAndrew, (Eds.), Tilapias: Biology
an Exploitation (p. 327-375). Dordrecht, NL: Kluwer
Academic Publishers.
Koch, J. F. A., Esperancini, M. S. T., Barros, M. M., Carvalho, P. L. P. F. Fernandes, A. C., Junior, Teixeira, C. P., & Pezzato, L. E. (2014). Avaliação econômica da alimentação de tilápias em tanques-rede com níveis de proteína e energia digestíveis. Boletim Do
Instituto De Pesca, 40(4), 605-616.
Koroleff, F. (1976). Determination of nutrients. In F. Koroleff (Ed.). Methods of seawater analysis (pp. 117-181). Weinheim, DE: Verlag Chemie Weinhein. Li, Y., Bordinhon, A. M., Davis, D. A., Zhang, W., & Zhu,
X. (2013). Protein: energy ratio in practical diets for Nile tilapia Oreochromis niloticus. Aquaculture
International,21(5), 1109-1119.
Macêdo, J. A. B. (2001). Águas & águas: métodos laboratoriais
de análises físico-químicas e microbiológicas. [S.l.]: J.A.B. de
Macêdo.
Meurer, F., Hayashi, C., Boscolo, W. R., dos Santos, L. D., Wolf, L., & Colpini, L. M. S. (2007). Exigência de proteína digestível para juvenis de tilápia do Nilo
(Oreochromis niloticus) em baixa temperatura. Revista
Científica de Produção Animal, 9(1) 53-64.
Michelato, M., Furuya, W. M., Graciano, T. S., Vidal, L. V. O., Xavier, T. O., Moura, L. B., & Furuya, V. R. B.
(2013). Digestible methionine + cystine requirement for Nile tilapia from 550 to 700 g. Revista Brasileira de
Zootecnia,42(1), 7-12.
Michelato, M., Oliveira Vidal, L. V., Xavier, T. O., Moura, L. B., Almeida, F. L. A., Pedrosa, V. B., … Furuya, W. M. (2016). Dietary lysine requirement to enhance muscle development and fillet yield of finishing Nile tilapia. Aquaculture,457, 124-130.
Moreira, A. G. L., Teixeira, E. G., Carreiro, C. R. P., & Moreira, R. L. (2010). Eficácia do eugenol extraído da planta Eugenia aromática como anestésico para realização de biometrias em adultos de tilápia do Nilo
(Oreochromisniloticus). Acta Scientiarum. Animal Sciences,
32(4), 419-423.
National Research Council (NRC). (2011). Nutrient requirements of fish and shrimp. Washington, DC: The National Academies Press.
Nelson, D. L., & Cox, M. M. (2014). Principios de
bioqumica: Lehninger. [S.l.]: Omega.
Ng, W.-K., & Hanim, R. (2007). Performance of genetically improved Nile tilapia compared with red hybrid tilapia fed diets containing two protein levels.
Aquaculture Research,38(9), 965-972.
Puppo, D. D., Haese, D., Gomes, L. C., Kill, J. L., Brugnara, E. C., Barcellos, J., … Ton, N. C. (2017). Optimization of crude protein in diets for Nile tilapia reared in net pens: performance, hematology and water quality. Ciência Rural,47(3), 1-7.
Ribeiro, L. P., Lima, L. C., Turra, E. M., Queiroz, B. M., Ribeiro, T. G., & Miranda, M. O. T. (1998). Efeito do peso e do operador sobre o rendimento de filé em tilápia vermelha Oreochromis spp. Aqüicultura Brasil,98, 773-778.
Vicentini, C. A., Franceschini-Vicentini, I. B., Bombonato, M. T. S., Bertolucci, B., Lima, S. G., & Santos, A. S. (2005). Morphological Study of the Liver in the Teleost Oreochromis niloticus. International
Journal of Morphology,23(3), 211-21.
Received on March 15, 2017. Accepted on April 4, 2017.