ISSN 1806-9290 (on-line) www.sbz.org.br
Modeling the effect of the age of dam at calving on the weaning weight of
Charolais-Zebu crossbred calves
Fábio Luiz Buranelo Toral1, Roberto Augusto de Almeida Torres Júnior2, Paulo Sávio Lopes3, Luiz Otávio Campos da Silva2, João Cruz Reis Filho4
1Universidade Federal de Mato Grosso. 2Embrapa Gado de Corte.
3Universidade Federal de Viçosa. Bolsista do CNPq. 4Ministério da Agricultura, Pecuária e Abastecimento.
ABSTRACT - The objective of this study was to evaluate alternatives for modeling the age of dam at calving (AOD)
effect on the weaning weight of Charolais-Zebu crossbred calves. Data from 56,965 calves were analyzed, using statistical models considering the fixed effects of the contemporary groups, sire and dam genetic groups, and AOD. The AOD effect was fitted to models using annual age classes, and ordinary quadratic to quintic-ordered polynomials (OP) or segmented polynomials (SP) with two, three, four, six and twelve evenly spaced intervals. In the case of segmented polynomials, general linear and quadratic effects and only one quadratic additional term from each knot were considered. The AOD effects were nested within sex of calf in all cases. According to the fitting criteria, the F-test for the reduction of residual sum of squares, coefficient of determination, residual sum of squares and mean of squared residuals, the three interval segmented polynomial (two knots) fitted to the data as well as the more complex polynomials.
Key Words: beef cattle, environmental effects, genetic evaluation, least square
Modelagem do efeito da idade da vaca ao parto sobre o peso à desmama de
bezerros mestiços Charolês-Zebu
RESUMO -Este trabalho foi realizado com o objetivo de avaliar alternativas para a modelagem do efeito da idade da vaca
ao parto sobre o peso à desmama de bezerros mestiços Charolês-Zebu. Os dados de 56.965 bezerros foram analisados por meio de modelos estatísticos, considerando os efeitos fixos de grupo de contemporâneos, grupos genéticos do touro e da vaca e da idade da vaca ao parto. O efeito da idade da vaca ao parto foi modelado utilizando-se classes anuais de idade, polinômios ordinários (PO) de ordem quadrática até quíntica, ou polinômios segmentados com 2, 3, 4, 6 ou 12 intervalos do mesmo tamanho. No caso dos polinômios segmentados, consideraram-se os efeitos linear e quadrático gerais e apenas o quadrático a partir de cada nó. Os efeitos da idade da vaca ao parto foram considerados aninhados em sexo do bezerro em todos os casos. De acordo com os critérios de ajuste utilizados, ou seja, o teste F para diferenças de soma de quadrados, coeficiente de determinação do modelo, soma de quadrados do resíduo e média dos resíduos ao quadrado, o polinômio segmentado com três intervalos (dois nós) se ajustou tão bem aos dados quanto os polinômios mais complexos.
Palavras-chave: avaliação genética, bovinos de corte, efeitos ambientais, quadrados mínimos
Introduction
When animal performance data, for any trait, are available for genetic evaluation, the first step consists of establishing suitable models for their description. In genetic evaluation models, animal performance data are represented by a function, usually linear, of the genetic and environmental effects that influence the expression of the trait of interest. Thus, important environmental factors need to be correctly identified and modeled to obtain reliable estimates of the
genetic merits of the animals. The weaning weight is an important trait in beef cattle production systems and therefore genetic evaluations for this trait are frequently carried out.
beef cattle is at weaning. At this phase, the animals with poor performance can be sold, thus supplying financial resources and making areas available for raising animals with higher genetic value.
During the suckling phase, especially in the first third of lactation, the milk produced by the cow is the main source of nutrients for the calf. This fact contributes to the favorable phenotypic correlation of cow milk production with the calf weaning weight, that can range from 0.44 to 0.93 (Albuquerque et al., 1993; Alencar et al., 1996). Thus modifications in cow milk production can lead to modifications in the calf weaning weight. The age of the dam at calving (AOD) is a factor that can influence milk production (Teodoro et al., 2000; Cerdótes et al., 2004). If the effect of cow milk production on calf weaning weight is not correctly modeled in the genetic evaluations, differences attributed to environmental effects may be confused with genetic differences, damaging prediction of the genetic value of sires, dams and calves.
Therefore the objective of this study was to assess alternatives for modeling the age of dam at calving effect on the weaning weight of Charolais-Zebu crossbred calves.
Material and Methods
The data used in this study were supplied by the Brazilian Canchim Breeders Association (ABCCAN) and included the weight at birth (BW) and at weaning (WW) of crossbred Charolais-Zebu calves (Ch-Z) involved in obtaining animals of the Canchim breed. ABCCAN currently accepts four mating schemes to obtain animals of the Canchim breed (Table 1).
Data from twin calves, calves from embryo transfer, calves less than 160 or over 285 days old at weaning, and the offspring of cows with age at calving less than 730 days or greater than 5,490 days were not used in the analyses. The data from contemporary groups (CG) with only one observation were also not considered. The contemporary groups were formed by the concatenation
Rotational Continous
Sire1 Dam Sire Dam
Ch
Z X
Z
Ch Canchim X Z
Z X 1/2 Ch + 1/2 Z Canchim X A
Ch X 1/4 Ch + 3/4 Z Canchim X T1
5/8 Ch + 3/8 Z
Canchim X 5/8 Ch + 3/8 Z Canchim X V
Canchim Canchim
Cross and continous UEPAE
Sire Dam Sire Dam Ch
Z X
Z Ch
Canchim
Z X
Z Canchim
Canchim X T2 Ch X A
Canchim X V MA X MA
Canchim
Canchim Canchim
Table 1 - Mating schemes to obtain Canchim cattle
1Ch = Charolais; Z = Zebu; A = 5/16 Ch + 11/16 Z; T1 = 15/32 Ch + 17/32 Z; T2 = 1/2 Ch + 1/2 Z; V = 9/16 Ch + 7/16 Z; and MA = 21/32 Ch + 11/32 Z. Source: ABCCAN
of the following variables: farm, birth season (season 1 births between September and November; season 2 -births between December and February of the following year; season 3 - births between March and May and season 4 - births between June and August), sex and feed system (FS) of the calves at weaning (FS 1 - pasture; FS 2 - fertilized pasture; FS 3 - pasture fertilized and rotated grazing; FS 4 - irrigated pasture; FS 5 - supplemented pasture; and FS 6 - feedlot).
The weaning weights were standardized to the age of 225 days (W225) as:
(
225)
* 225
225 + − −
−
= i j i
i i i
i BW age
age BW WW
W β ,
[1]
where: W225i = weaning weight, standardized to 225
days of age of the animal i; WWi = weight observed at the
weaning of the animal i; BWi = birth weight of the animal i; agei= age of animal i at weaning; and βj = regression
coefficient of the W225 (fitted for the effects of contemporary groups) by the age at weaning, obtained
for each combination j of genetic group and sex of
calves. The data was standardized to the age of 225 days because this was the mean of the age at weaning of the calves belonging to the database used. For the animals without birth weight data, the birth weight mean of each combination of the genetic group and sex of calves were used. These procedures were adopted following a previous simulation study that resulted in smaller bias and smaller mean of squared residuals and greater correlation among observed and fitted values (Torres Jr. & Toral, 2006).
A preliminary analysis of variance was then carried out to obtain the studentized errors (Neter et al., 1996). In this case, when the statistical model was applied, the fixed effects of contemporary group, sire genetic group, dam genetic group and the covariable age of dam at calving (linear, quadratic and cubic effects) nested in each combination sex of calves × dam genetic group were considered. The data with absolute residue values greater than four were excluded. A further analysis of frequency was then carried out, excluding the data of the contemporary groups with only one observation.
After the previously reported procedures, the data set had 56,965 weaning weights of calves born between January 1988 and February 2005, offspring of 1,600 sires and 27,122 dams (1,929 maternal grandsires), distributed in 4,458 contemporary groups from 247 farms, located in the following regions and states of Brazil: the South (Rio Grande do Sul, Santa Catarina and Paraná), Southeast
(São Paulo, Rio de Janeiro and Minas Gerais), Central West (Mato Grosso do Sul, Mato Grosso, Goiás and the Federal District), Northeast (Bahia, Pernambuco, Piauí and Maranhão) and North (Tocantins and Pará). Analyses of means and frequencies were then carried out to characterize the data set used.
Analyses of variance were carried out for W225, using the least square methodology, considering the following statistical model:
( )ls ijklm m
l k
j
ijklm CG SGG DGG AOD e
W225 =µ+ + + + +
[2]
where: W225ijklm = weaning weight, standardized to 225
days of animal i, raised in the contemporary group j,
offspring of a sire from the genetic group k and a dam
from the genetic group l with age of dam at calving m; µ = general constant; CGj = effect of contemporary group j ( 1; ...; 4,458); SGGk = effect of the sire genetic group k (Z, 5/8 Ch + 3/8 Z, Canchim, MA and Ch); DGGl = effect
of the dam genetic group l (l = 1/4 Ch + 3/4 Z, A, T1, T2,
V, 5/8 Ch + 3/8 Z, Canchim and MA); AODm(ls) = effect of
age of dam at calving m (m = 2.00, ..., 15.00 years),
nested within each combination of dam genetic group l
with sex of calves s (s = male and female); and eijklm = random
error associated to each observation, ~
( )
0, 2e ijklm NIID
e σ .
The AOD effect, defined in years with precision to one hundredth, was modeled by using AOD classes (CLA), with ordinary (OP) or segmented polynomials (SP).
The age of dam at calving classes were formed by grouping the cows with age at calving (in years) between 2.00 and 3.00 in class 1, the cows with age at calving between 3.01 and 4.00 years in class 2, and so on, to class 13, with the cows with age at calving between 14.01 and 15.00 years. In this case, the model used was defined by equation [2], assuming AODm(ls) as a classifying effect
(13 classes) that was called CLA13.
The following model was adopted, in the general form, in the implementation of the ordinary polynomials to model the effect of AOD on W225:
( ) ijklm O
p
p m p l k
j
ijklm CG SGG DGG b AOD e
W
ls +
+ +
+ +
=
∑
=1
225 µ ,
[3]
where:
b
p( )ls = regression coefficient of order p, nestedwithin each combination of dam genetic group l and sex
of calves s; and AODm = age of dam at calving m. Four
models were assessed with ordinary polynomials in this
study, that consisted of considering the O values e
+ quartic (Q4), and L + Q2 + C + Q4 + quintic (Q5) effects, respectively. These models were named OP2, OP3, OP4 and OP5, respectively.
The following form was adopted for the general description of the models with SP:
( ) ( )
2 2 1
225ijklm CGj SGGk DGGl c AODm c AODm W
ls
ls +
+ + + +
=µ
( )
(
(
(
(
)
)
)
)
ijklm qf
m
f AOD f ti e
c
ls − + − +
+
∑
+=
2
3
2
* 2 2 ,
0
max , [4]
where:
c
f( )ls = regression coefficient f, nested withineach combination of the dam genetic group l and sex of
calves s; max(0,AODm−(2+q*ti))= greatest value between
0 and AODm−
(
2+(
f−2)
*ti)
; q = number of knots admitted;and ti = interval between knots, defined as 15,00+−12,00
q , for
15.00 and 2.00 corresponding to the oldest and youngest
age of dam at calving, respectively. As shown in [4], the general form of the AOD effect on W225 was a segmented polynomial with general linear
( )
c1( )ls and quadratic( )
c2( )lseffects of AOD on W225 and specific quadratic effect from each knot
(
cf( )ls,f ≥3)
. In this study, five models with SPwere assessed, that considered the q values equal to 1, 2,
3, 5 and 11 that corresponded to models with 2, 3, 4, 6 and 12 intervals and 3, 4, 5, 7 and 13 regression coefficients (in addition to the intercept), respectively. The models were named according to the number of regression coefficients used, that is, SP3, SP4, SP5, SP7 and SP13.
The following criteria were used to compare the models: the residual sum of the squares (RSS), the F test for the reduction of the RSS in subsequent models, the coefficient of determination (R²), the efficiency of the additional degrees of freedom of the model (EDF) and the mean of the squared residuals (MSR). The efficiencies of the degrees of freedom were obtained from the ratio between the RSS differences in two sequential models and the difference in the degrees of freedom of their errors. To obtain MSR, the error of each observation was squared and the mean for each AOD interval of interest was calculated, according to the models assessed. In this study, the F tests for the reduction of the RSS were only approximate after including new intervals in the SP because it was chosen to compare models with the smallest increase in the error degrees of freedom rather than comparing perfectly nested models.
After carrying out the analyses of variance and the statistical tests, the regression coefficients for the age of dam at calving effect on the weaning weight of the
calves, considering the statistical model with the best fit, were used to draw graphics for better visualization of the curve shapes that describe the AOD effect according to the dam genetic groups evaluated.
In this case, the intercept of each regression equation involved complex combinations of the genetic effects and the solutions for the other fixed effects may even not be estimable. Thus it was chosen to use a variable called the curve shape (CS), expressed in kilos, consisting of the difference between the estimated point for each AOD, in the interval 2.00 years - 15.00 years, and the mean of all the points, obtained at each 0.01 year, within this interval. The value of the curve shape can be calculated using:
( )
( )
( )
np x f x
f
CS m
m ls
m ls ls m
∑
=− =
00 . 15
00 .
2 [5]
where:
CS
m( )ls = curve shape value, obtained for point m(m = 2.00, 2.01, 2.02, ..., 15.00), for regression equation
(not considering the intercept value) obtained for each
combination of the dam genetic group l and sex of
calves s; fls
( )
xm = point m of each l×scombination; and np = number of points in the interval 2.00 – 15.00years (np = 1,301).
The consistency and statistical analyses were performed using the FREQ, GLM, GPLOT, IML and MEANS procedures of SAS (SAS, 2003).
Results and Discussion
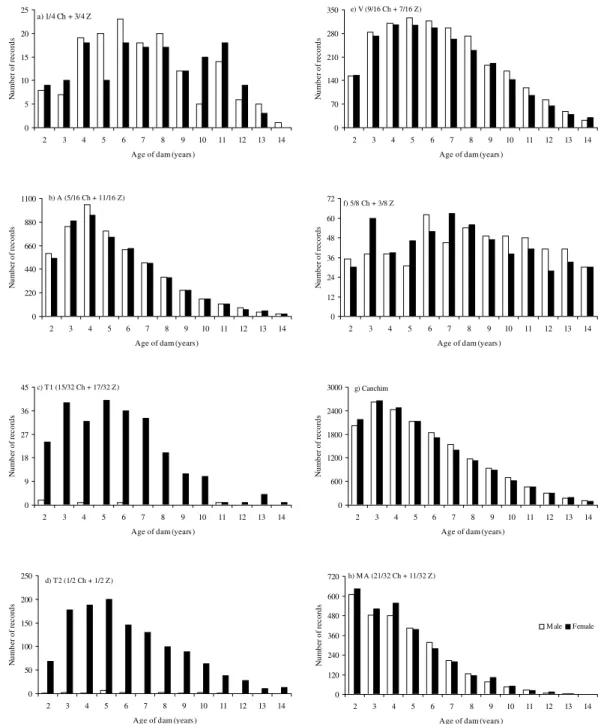
Figure 1 - Number of records of the weaning weight in the age of dam at calving intervals, for each dam genetic group, according to the sex of calves (Ch = Charolais, Z = Zebu).
Table 2 - Number of weaning weight data in the dam and sire genetic groups
Dam genetic group1 Sire genetic group1
Z 5/8 Ch + 3/8 Z Canchim MA Ch Total
1/4 Ch + 3/4 Z 3 1 4 3 1 4
A 1 2 4 10,569 10,693
T 1 7 2 5 2 2 5 9
T 2 3 9 1,232 1,271
V 4,973 4,973
5/8 Ch + 3/4 Z 2 9 7 8 2 7 1,124
Canchim 2 0 32,631 32,651
MA 3,390 2,290 5,680
Total 6 6 2 9 7 43,429 2,290 10,883 56,965
1Ch = Charolais; Z = Zebu; A = 5/16 Ch + 11/16 Z; T1 = 15/32 Ch + 17/32 Z; T2 = 1/2 Ch + 1/2 Z; V = 9/16 Ch + 7/16 Z; and MA = 21/32 Ch + 11/32 Z.
0 5 10 15 20 25
2 3 4 5 6 7 8 9 10 11 12 13 14 Age of dam (years)
N um be r o f re co rd s
a) 1/4 Ch + 3/4 Z
0 220 440 660 880 1100
2 3 4 5 6 7 8 9 10 11 12 13 14 Age of dam (years)
N um be r o f re co rd s
b) A (5/16 Ch + 11/16 Z)
0 9 18 27 36 45
2 3 4 5 6 7 8 9 10 11 12 13 14 Age of dam (years)
N um be r o f re co rd s
c) T1 (15/32 Ch + 17/32 Z)
0 50 100 150 200 250
2 3 4 5 6 7 8 9 10 11 12 13 14 Age of dam (years)
N um be r o f re co rd s
d) T2 (1/2 Ch + 1/2 Z)
0 70 140 210 280 350
2 3 4 5 6 7 8 9 10 11 12 13 14 Age of dam (years)
N um be r o f re co rd s
e) V (9/16 Ch + 7/16 Z)
0 12 24 36 48 60 72
2 3 4 5 6 7 8 9 10 11 12 13 14 Age of dam (years)
N um be r o f re co rd s
f) 5/8 Ch + 3/8 Z
0 600 1200 1800 2400 3000
2 3 4 5 6 7 8 9 10 11 12 13 14 Age of dam (years)
N um be r o f re co rd s g) Canchim 0 120 240 360 480 600 720
2 3 4 5 6 7 8 9 10 11 12 13 14 Age of dam (years)
respectively. That is, P(initial age-final age) = PRnc; where: PR = pregnancy rate and nc = number of calves necessary for the cow to remain in the herd. Furthermore, as discussed previously, when directed crossings are carried out, there are fewer data for some genetic groups, as was the case of the male offspring of T1 and T2 dams (V = 9/16Ch + 7/16Z, approximately). Although the males of genetic group V could not be used as sires in the schemes to form the Canchim breed, their data could have been collected and thus contributed to the evaluation of the ancestors and the breed as a whole.
The descriptive statistics for W225 are shown (Table 3) only to characterize the data set, because it was not the objective of this study to compare the W225 of the different genetic groups nor to analyze in detail the causes of these variations. Further details on the growth traits of crossbred Charolais-Zebu calves can be obtained in Alencar et al. (1998) and Trematore et al. (1998). Nevertheless, an important point in this case is that the means of the calf age at weaning were close to the value used in the present study to standardize the data, that was 225 days.
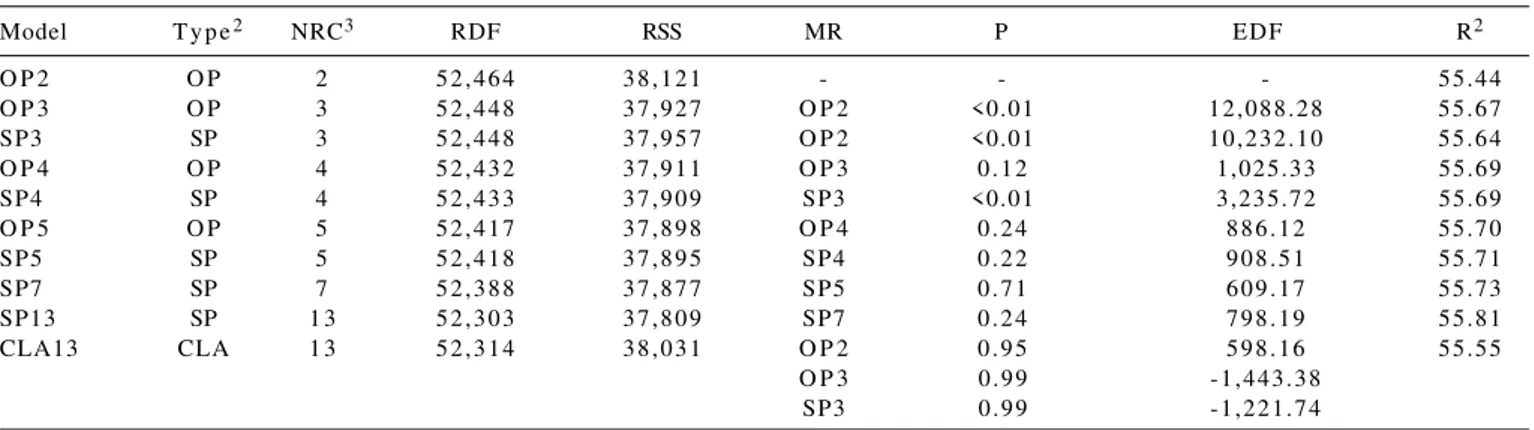
The differences in the RSS and R² were less than 1% (Table 4). The F test proved that there was no better fit of the CLA13 model compared to the fit of some less parameterized models, such as the OP2, OP3 and SP3 models. With the grouping of the AOD into annual classes for use in the CLA13 model, AOD classes were formed with a
small number of observations for some genetic groups, such as for the greater AOD. Thus the estimates of the effects for these classes may present errors greater than those of the estimates of the polynomial models. Furthermore, when considering precision to one hundredth in the AOD definition, 100 AOD subclasses were grouped in a single annual class, and it was presumed that the effect of these 100 subclasses was the same, that in reality cannot be stated. Thus using continuous functions to model the AOD effect on W225 seems to be a better alternative than using the classifying variable, because it discriminates more precisely the differences among the adjacent AOD.
According to the F test for RSS reduction, models OP3 and SP3 showed better fit than the OP2 model. The same test showed that the models SP4 (SP with three intervals) and OP3 (cubic OP) could be used to model the AOD effect on W225 because there was no significant increase (P>0.10) in the fit for the more complex models. A tendency to reduction in the EDF variable was observed as the complexity of the models increased and, in this case, a quick reduction in the EDF corroborated the lack of significance of the increase in fit of the more complex models. The greater EDF of the models with three regression coefficients (OP3 and SP3) and the segmented polynomials with four regression coefficients (SP4) corroborated the results of the F test (Table 4).
Table 3 - Statistics1 for weight and age at weaning of crossbred Charolais-Zebu calves according to sex and genetic group
Weight at weaning (kg) Age at weaning (days)
Genetic group2 M SD MIN MAX M SD MIN MAX N
Male
1/4 Ch + 3/4 Z
A 254.9 20.9 240.1 269.7 221.5 23.3 205.0 238.0 2
T 1 191.5 25.7 153.1 224.5 227.4 11.1 208.0 235.0 5
V 213.5 30.7 169.6 275.0 226.7 24.4 169.0 280.0 2 4
5/8 Ch + 3/4 Z 215.7 36.2 122.2 289.0 227.3 28.1 167.0 284.0 1 5 8
Canchim 213.4 41.6 79.5 424.1 226.7 24.6 165.0 285.0 22,367
MA 214.0 34.9 85.2 332.1 226.9 25.0 165.0 285.0 5,418
Total 213.5 40.3 79.5 424.1 226.7 24.7 165.0 285.0 27,974
Female
1/4 Ch + 3/4 Z 175.4 34.4 119.4 255.0 220.4 33.4 175.0 276.0 4 6
A 189.0 22.0 155.1 238.2 231.0 24.3 190.0 264.0 1 8
T 1 182.0 30.7 96.2 258.5 223.8 23.4 165.0 284.0 1 1 9
V 184.8 34.4 87.3 297.4 227.0 25.5 166.0 285.0 1,460
5/8 Ch + 3/4 Z 208.5 34.0 111.0 275.9 227.8 29.3 165.0 285.0 1 5 6
Canchim 197.9 36.2 80.0 354.5 227.1 24.4 165.0 285.0 22,041
MA 203.2 31.8 79.6 338.2 226.4 24.6 165.0 285.0 5,151
Total 198.1 35.6 79.6 354.5 226.9 24.5 165.0 285.0 28,991
1M = mean; SD = standard deviation; MIN = minimum value; MAX = maximum value; and N = number of observations.
Table 4 - Criteria1 for the different statistical models for the effect of age of dam at calving on weaning weight of crossbred
Charolais-Zebu calves
Model T y p e2 NRC3 RDF RSS MR P EDF R2
O P 2 O P 2 52,464 38,121 - - - 55.44
O P 3 O P 3 52,448 37,927 O P 2 <0.01 12,088.28 55.67
SP3 SP 3 52,448 37,957 O P 2 <0.01 10,232.10 55.64
O P 4 O P 4 52,432 37,911 O P 3 0.12 1,025.33 55.69
SP4 SP 4 52,433 37,909 SP3 <0.01 3,235.72 55.69
O P 5 O P 5 52,417 37,898 O P 4 0.24 886.12 55.70
SP5 SP 5 52,418 37,895 SP4 0.22 908.51 55.71
SP7 SP 7 52,388 37,877 SP5 0.71 609.17 55.73
SP13 SP 1 3 52,303 37,809 SP7 0.24 798.19 55.81
CLA13 CLA 1 3 52,314 38,031 O P 2 0.95 598.16 55.55
O P 3 0.99 -1,443.38
SP3 0.99 -1,221.74
1NRC = number of regression coefficients, RDF = residual degrees of freedom, RSS = residual sum of squares x 10-3, MR = model used as reference for the F test and calculation
of the efficiency of the additional degrees of freedom (EDF), P values for the F test (P), efficiency of the additional degrees of freedom (EDF) and coefficient of determination (R²).
2CLA = classifying; OP = ordinary polynomial; SP = segmented polynomial. 3Corresponds to the number of AOD classes for CLA13.
The approximate F test for the difference between the SP4 and OP3 models indicated that the first showed significantly better fit (P=0.04) than the second to model the AOD effect on W225. However, it should be noted that the SP4 model had one regression coefficient more than the OP3 model. These results are similar to those reported by Paz et al. (1999), who verified that the fit given by an SP with the general linear + quadratic and quadratic effects starting at eight years of age was greater than the fit given by a quadratic OP for the AOD effect on the daily weight gain in the pre-weaning in Nellore cattle. For better comparisons between the SP and OP, it is important to use models with the same number of regression coefficients.
Results from Table 4 show that the differences in the RSS and the R² between the SP and OP models with the same number of regression coefficients (models OP3 and SP3, models OP4 and SP4, models OP5 and SP5) were less than 0.1%.
The differences in the MSR in the SP and OP models, within the intervals determined by the SP knots (Table 5) or annual intervals (Figure 2), considering the models with the same number of regression coefficients, although small, helped to discriminate these polynomials.
The SP formed a class of models that showed good local fit, but also presented a good global fit. This was observed when the SP4 and OP4 models were compared, that have the same number of parameters. In this case, in addition to presenting the best fit for the first and last interval (Table 5), the SP4 model also presented the smallest RSS (Table 4).
The segmented polynomials showed the best local fit because they considered one equation for each interval,
while the OP fitted one equation along all the dominion of the independent variable (in this case, AOD). The least squares estimates of the OP regression coefficients were most influenced by the regions of greatest data concentration, giving the worst estimates for the AOD effect on W225 at the extremes of the distribution, where the number of data is usually smaller (Figure 1). Consequently, the SP showed the best fits for the data on the older cows, in function of the segmentation of the curve.
Figure 3 - Curve shape of the age of dam at calving effect on the on weaning weight of crossbred Charolais-Zebu calves according to sex of calves and dam genetic group (Ch = Charolais, Z = Zebu).
Curve shape (kg)
-50 -40 -30 -20 -10 0 10 20
2 3 4 5 6 7 8 9 10 11 12 13 14 15 Age of dam (years)
Male
Curve shape (kg)
-50 -40 -30 -20 -10 0 10 20
2 3 4 5 6 7 8 9 10 11 12 13 14 15
Age of dam (years)
1/4 Ch + 3/4 Z A (5/16 Ch + 11/16 Z) T1 (15/32 Ch + 17/32 Z) T2 (1/2 Ch + 1/2 Z) V (9/16 Ch + 7/16 Z) 5/8 Ch + 3/8 Z Canchim
MA (21/32 Ch + 11/32 Z)
Female
Table 5 - Number of regression coefficients (NRC), mean of the squared residuals (MSR) and number of observations (N) for each interval, for the different models for the age of dam at calving effect on the weaning weight of crossbred Charolais-Zebu calves
Model T y p e1 NRC MSR (kg²)
2.00 - 8.50 8.51 - 15.00
P O 3 P O 3 651.087 728.860
PS3 PS 3 651.662 729.149
N 46,187 10,778
2.00 - 6.33 6.34 - 10.66 10.67 - 15.00
P O 4 P O 4 641.509 694.703 742.460
PS4 PS 4 641.503 694.715 741.897
N 35,144 17,493 4,328
2.00 - 5.25 5.26 - 8.50 8.51 - 11.75 11.76 - 15.00
P O 5 P O 5 644.755 659.388 716.072 768.106
PS5 PS 5 644.750 659.341 715.996 767.636
N 27,456 18,731 8,347 2,431
1OP = ordinary polynomial; SP = segmented polynomial.
600 670 740 810 880 950
2 3 4 5 6 7 8 9 10 11 12 13 14
Age of dam (years)
M
ea
n
of
s
qua
re
d r
es
idu
al
s (
kg²
)
OP2
OP3
OP4
OP5
SP3
SP4 SP5
SP7
SP13
CLA13
model the age of dam at calving effect on weaning weight and can be implemented in the genetic evaluation of the Canchim breed.
Literature Cited
ALBUQUERQUE, L.G.; ELER, J.P.; COSTA, M.J.R.P. et al. Produção de leite e desempenho do bezerro na fase de aleitamento em três
raças bovinas de corte. Revista da Sociedade Brasileira de
Zootecnia, v.22, n.5, p.745-754, 1993.
ALENCAR, M.M.; TULLIO, R.R.; CRUZ, G.M. et al. Produção de leite da vaca e desenvolvimento do bezerro em gado de
corte. Revista da Sociedade Brasileira de Zootecnia, v.25,
n.1, p.92-101, 1996.
ALENCAR, M.M.; TREMATORE, R.L.; OLIVEIRA, J.A.L. Características de crescimento até a desmama de bovinos da
raça Nelore e cruzados Charolês-Nelore. Revista Brasileira
de Zootecnia, v.27, n.1, p.40-46, 1998.
ASSOCIAÇÃO BRASILEIRA DE CRIADORES DE CANCHIM
-ABCCAN [2008]. Novos esquemas de acasalamento para
obtenção do Canchim. Disponível em: <http://www.canchim. com.br/raca.asp#esquemas> Acesso em: 18/6/2008.
CERDÓTES, L.; RESTLE, J.; ALVES FILHO, D.C. et al. Produção e composição do leite de vacas de quatro grupos genéticos submetidas a dois manejos alimentares no período de lactação.
Revista Brasileira de Zootecnia, v.33, n.3, p.610-622, 2004. ELZO, M.A.; BORJAS, A.R. Perspectivas da avaliação genética
multirracial em bovinos no Brasil. Ciência Animal
Brasileira, v.5, n.4, p.171-185, 2004.
FREUND, R.J.; LITTELL, R.C. SAS system for regression. 3.ed.
Cary: SAS Institute, 2000. 235p.
NETER, J.; KUTNER, M.H.; NACHTSHEIN, C.J. et al. Applied
linear statistical models. 4.ed. Chicago: Irwin, 1996. 1408p.
PAZ, C.C.P.; ALBUQUERQUE, L.G.; FRIES, L.A. Efeitos ambientais sobre ganho de peso no período do nascimento ao
desmame em bovinos da raça Nelore. Revista Brasileira de
Zootecnia, v.28, n.1, p.55-64, 1999.
RUMPH, J.M.; Van VLECK, L.D. Age of dam adjustement factors for birth and weaning weight records of beef cattle: a review.
Genetics and Molecular Biology, v.3, n.1, p.1-17, 2004.
STATISTICAL ANALYSIS SYSTEM - SAS. User’s guide. Version
9.1. Cary: SAS Institute, 2003. (CD-ROM).
TEODORO, R.L.; MARTINEZ, M.L.; VERNEQUE, R.S. et al. Parâmetros genéticos e fatores de ajuste da produção de leite
para o efeito de idade da vaca ao parto na raça Guzerá. Revista
Brasileira de Zootecnia, v.29, n.6, p.2248-2252, 2000 (supl.2).
TORRES JR., R.A.A.; TORAL, F.L.B. Alternative methods for the adjustement of weaning weights of beef cattle. In: WORLD CONGRESS ON GENETICS APPLIED TO LIVESTOCK PRODUCTION,
8., 2006, Belo Horizonte. Proceedings... Belo Horizonte:
Permanent International Committee for World Congresses on Genetics Applied to Livestock Production, 2006. p.67. TREMATORE, R.L.; ALENCAR, M.M.; BARBOSA, P.F. et al.
Estimativas de efeitos aditivos e heteróticos para características de crescimento pré-desmama em bovinos Charolês-Nelore.
Revista Brasileira de Zootecnia, v.27, n.1, p.87-94, 1998. Generally, there were fewer MSR differences among
the different models than among the different intervals for AOD, and the MSR increased in function of AOD. This fact suggested the need to carry out further studies on the heterogeneity of variances for modeling the AOD effect on the weaning weight.
Thus it was chosen to use segmented polynomials with three intervals, with knots at 6.33 years and 10.66 years of age (SP4) to obtain the curve shape variable (Figure 3).
In Figure 3, the points related to the male calves, offspring of cows T1 (15/32 Ch + 17/32 Z) and T2 (1/2 Ch + 1/2 Z), were not shown because the curves estimated were inconsistent. This result can be explained by the fact that there were few data for male offspring from dams T1 and T2 (Table 2; Figure 1).
Generally the performance observed for the curve shape was in agreement with the reports revised by Rumph & Van Vleck (2004), that is, the calves of dams with extreme ages are lighter than the calves of dams of intermediate ages. During the pre-weaning phase, the calf weight is positively correlated to the milk production of its dam (Albuquerque et al., 1993; Alencar et al., 1996) and thus it is expected that alterations in milk production would reflect on the weaning weight of the calves. Young cows produce less milk than those that are approaching physiological maturity, because the nutrients ingested also need to be used for body growth as well as milk production, maintenance and gestation (Rumph & Van Vleck, 2004). However, for the older cows, reduction in milk production can be partly attributed to their reduced efficiency in converting the ingested nutrients to milk (Rumph & Van Vleck, 2004).
Conclusions