Milk composition and its relationship with weaning weight in Charolais cattle
Víctor Inocencio Pacheco Contreras1, Gaspar Manuel Parra Bracamonte1, Luis Arístides López Bustamante2, Víctor Ricardo Moreno Medina1, Ana María Sifuentes Rincón1
1 Instituto Politécnico Nacional, Centro de Biotecnología Genómica, Laboratorio de Biotecnología Animal, Reynosa, Tamaulipas, México. 2 Charolais Herd Book de México A.C., Guadalupe, Nuevo León, México.
ABSTRACT - To determine the effects of a number of non-genetic factors on milk components and estimate their indirect relationships with weaning weight (WW205), the percentages of protein, fat, lactose and solids non-fat in Charolais cows from Mexico were estimated. Lactation period (LP) and calving season (CS) had significant effects on protein and fat, whereas lactose and solids non-fat were only affected by the LP. Sire line and age of the dam had significant effects on calf birth weight, while CS affected WW205. Residual correlations between milk components and WW205 suggest a low but significant correlation with lactose. These results demonstrate the importance of several non-genetic factors on the composition of milk from Charolais cows managed under extensive cow-calf production systems and the indirect relationships between these factors and the weaning weight of a calf.
Key Words: beef cattle, lactation curve, milk components
ISSN 1806-9290
www.sbz.org.br R. Bras. Zootec., 44(6):207-212, 2015
Received September 24, 2014 and accepted February 24, 2015. Corresponding author: [email protected]
http://dx.doi.org/10.1590/S1806-92902015000600002
Copyright © 2015 Sociedade Brasileira de Zootecnia. This is an Open Access article distributed under the terms of the Creative Commons Attribution Non-Commercial License, which permits unrestricted non-commercial use, distribution, and reproduction in any medium, provided the original work is properly cited.
Introduction
In beef production systems, the survival and development of calves are determining factors for productivity (Martínez, 2009) that greatly depend on maternal ability (additive genetic and permanent maternal effects) and the genetic potential of the animal (additive direct genetic effect) (Quintero et al., 2007; Cañas et al., 2008; Palacios-Espinosa et al., 2010; Guillén Trujilloet al., 2012). Milk is the primary food consumed by calves from birth to weaning. Therefore, milk production is considered a key component of maternal ability (Cerdótes et al., 2004; Martínez, 2009), and in beef cattle, milk production is a main factor influencing pre-weaning growth (Clutter and Nielsen, 1987, Meyer et al., 1994). Consequently, the contents of milk components and their variations have been proposed as significant factors influencing the development of calves during the pre-weaning period (Brown et al., 2002; Brown and Lalman, 2010; Martínez Velázquez et al., 2010). Previous studies have examined the percentages of milk components and their relationships with pre-weaning growth (Rutledge et al., 1971; Totusek et al., 1973; Mondragon et al., 1983), and other studies have examined the same correlations of growth with milk
components by weight (Jeffery and Berg, 1971; Marston et al., 1992; Martínez Velázquez et al., 2012). However, the milk composition in Charolais cattle and its relationship with pre-weaning growth have not yet been assessed.
Charolais is a globally widespread beef cattle breed that has been extensively used for beef production, predominantly in France, USA, Canada, Argentina, and Mexico, mainly because of its characteristics of growth, adaptability, muscularity, and maternal ability (FAO, 2007; Sifuentes-Rincón et al., 2007a; Parra-Bracamonte et al., 2009). Since its introduction to Mexico in 1930, Charolais has been one of the primary beef cattle breeds reared in the northern region, where breeders are committed to the continuous improvement of their herds and aim to achieve the competitive standards required by present-day markets (Asociación Charolais Charbray Herd Book de México, 2013). Given the importance of the maternal ability in the survival and development of calves in beef cattle and the milk being their main component, the present study was conducted to estimate the main components of the milk of Charolais cows and their indirect relationships with the pre-weaning growth of calves.
Material and Methods
in the state of Sonora (H4 = eight cows). A total of 16 Charolais sires from French and American lines were included. Of these 16 sires, seven (four of French origin and three of American origin) belonged to H1; three sires of American origin belonged to H2; three sires of French origin belonged to H3; and three sires of American origin belonged to H4. In all four herds, the cows were managed under rotations of native grasslands. Groups H1, H2, and H3 also grazed on pastures containing klein grass (Panicum coloratum), bermuda grass (Cynodon dactylon), and buffel grass (Cenchrus ciliaris), respectively. The cows of the four herds were supplemented with sorghum silage fodder and with commercial products containing between 36 and 100% protein bases (0.750 to 3 kg/head/d). The animals had free access to a mix of minerals (12% phosphorous, 12% calcium, 15% salt, 1.7% magnesium and trace minerals) throughout the year.
Calves that remained with their mothers until seven months of age were weighed at birth and at weaning. The weaning weight was adjusted to that at 205 d of age (WW205). The cows in the four herds were separated from their calves eight hours before sampling because of the difficulties in handling beef cows for sample collections. Samples of the cisternal fraction were collected manually at 30±10 d intervals for four to six months, beginning at the first week of lactation and under the stimulus of visual contact with the calf. Cows were milked between 09.00 h and 11.00 h, and 50 mL to 100 mL of milk was collected twice. Samples were identified, stored in 50 mL falcon tubes with Bronopol® added as a preservative, and
refrigerated (4 to 6 ºC) until they were analyzed twice at the milk quality lab of the Mexican Holstein Association. A LactoScop FTIR instrument was used for analysis, and the percentages of protein, fat, lactose, and solids non-fat were determined using the medium-infrared method.
The analyzed variables included the percentages of protein, fat, lactose, and solids non-fat contained in the milk from the sampled cows. The birth weight (BW) and weaning weight (WW205) of the progeny of the milked cows were recorded. The non-genetic factors recorded included the lactation period (LP), calving season (CS), age of cow at calving (ACC), and herd. The LP was divided into six stages of 30±10 d for four to six months beginning at the first week of lactation. The following four CS were considered, according to the periods of rain reported in the states of Nuevo Leon and Sonora, Mexico (Denogean et al., 2012; UGRNL, 2012): 1) first rainy period (May-June), with heavy rains and abundant grass; 2) first dry period (July-August), when grass quality decreases; 3) second rainy period (September-October), with sporadic rains and
decreasing grass quality and quantity; and 4) second dry period (November-April), when grass begins to dry out and availability decreases. The ACC was grouped into six classes according to the calving age: ≤3, 4, 5, 6, 7, and ≥8 years.
For protein, fat, lactose, and solids non-fat, the following statistical model was used for the repeated measures analysis:
Ytijklm= μ + Ci(j) + Hj+ LPk+ CSl+ ACCm+εtijklm,
in which Ytijklm= protein, fat, lactose, or solids non-fat in the
k-th LP for the i-th cow of the j-th herd; µ = overall mean; Ci(j) = random effect of the i-th cow in the j-th herd; Hj=
random effect of the j-th herd; LPk= fixed effect of thek-th LP; CSl= fixed effect of thel-th CS; ACCm= fixed effect of the m-th age of cow at calving; and εijklm= residual random effects. These analyses were performed using the MIXED procedure in SAS (Statistical Analysis System, version 9.0).
For each variable, five covariance structures were analyzed to choose the most adequate for adjusting the model associations for milk components and non-genetic factors: the simple compound symmetry (CSC); first-order autoregressive (AR 1); first-first-order ante-dependence (ANTE 1); and unstructured (NE) covariance structures. The covariance structure was selected by comparing Akaike’s information criterion for finite samples (AICC). The AR 1 structure best adjusted the data for the percentages of lactose and solids non-fat, while the NE and ANTE 1 covariance best adjusted the data for the percentages of protein and fat, respectively.
A slightly different model was fit for BW and WW205, including the sex of the calf (SX), sire line (SL), herd (H), CS, and age of the dam (AOD) as follows:
Yijklm= μ + SXi + SLj+ Hk+ CSl+ AODm+ εijklm, in which Yijklm= BW or WW205; SXi= fixed effect of the
i-th sex of the calf; Lj= fixed effect of thej-th SL (French or American); Hj= random effect of the k-th herd; CSl= fixed effect of the l-th CS; AODm= fixed effect of them-th AOD; and εijklm= residual random effects. These analyses were performed using the GLM procedure in SAS (Statistical Analysis System, version 9.0).
A complementary Pearson correlation analysis of the correlations of the residuals of protein, fat, lactose, and solids non-fat with WW205 was performed using the PROC CORR procedure of the SAS statistical package (Statistical Analysis System, version 9.0). A p-value of 0.05 was considered significant for all analyses.
Results and Discussion
crosses with Bosindicus (Melton et al., 1967; Daley et al., 1986; Cerdótes et al., 2004; Brown and Lalman, 2010; Martínez Velázquez et al., 2010).
Conversely, a low mean fat content was observed (Table 1), likely because the samples were collected from the cistern fraction of milk from the mammary gland, which is less lipid-rich than milk obtained from the alveoli but directly correlated with the alveolar fraction of milk (Lollivier et al., 2002; Ayadi et al., 2004; El-Loly, 2011). Several previous studies have reported milk fat contents for beef cattle. For instance, Melton et al. (1967) reported a value of 2.87% fat in Charolais cows and 2.79% fat for other beef breeds (Angus and Hereford) assessed under the same management practices, and similar results were reported by Marston et al. (1992) for Angus and Simmental cows (3.7% and 3.6% fat, respectively). A recent study also reported a mean fat level of 2.92% in Creole and Guzerat cows and their F1 crosses, with no observed differences among these genetic groups (Martínez Velázquez et al., 2010).
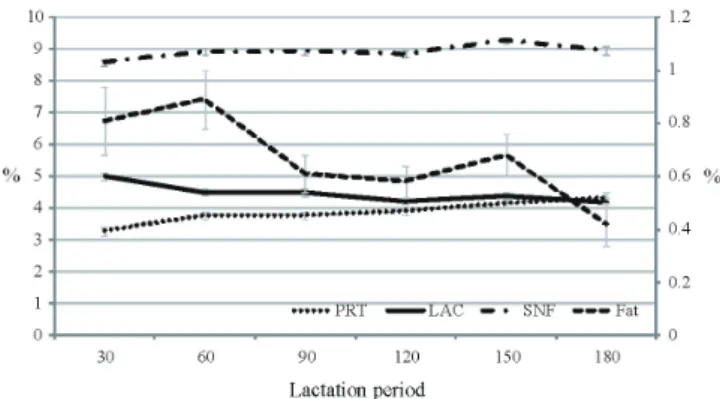
Our milk component analysis revealed that LP had a highly significant (P<0.01) effect on protein, fat, lactose, and solids non-fat. The mean protein increased from 3.28% at the first sampling (30 d) to 4.23% at the end of the study (180 d) (P<0.01; Figure 1). The mean fat level decreased from 0.81% to 0.42%, with the lowest mean at 180 d. Similarly, the mean lactose level decreased with an increase in LP; the highest mean lactose level was observed at 30 d (5.02%), while the lowest was found at 180 d (4.18%).
These trends are similar to those reported recently by Rodrigues et al. (2014) for Angus and Angus-derived cattle, which were also analyzed according to protein, fat, and lactose from the beginning of lactation (18 to 58 d) to the end of lactation (152 to 242 d). Similar mean levels were observed between studies, with the exception of fat, for which the lower mean lipid percentage in this study mainly resulted from the analysis of milk extracted from the mammary gland cistern, which is 2.5- to 5-fold less lipid rich
than milk from the alveoli. This difference was not observed for the protein, lactose, and solids non-fat components, which remain at a constant concentration throughout the entire LP (Lollivier et al., 2002; El-Loly, 2011).
In contrast, Cerdótes et al. (2004), in a study of four genetic groups (Nellore, Charolais, and their reciprocal crosses), reported that the protein, fat, and lactose levels did not vary significantly during the LP. Similarly, Martínez Velázquez et al. (2010) reported significant differences among genetic groups but no effect of LP on protein, fat, or lactose in Criollo cows, Guzerat cows, and their F1 crosses at 70, 126, and 182 d of lactation.
In the particular case of lactose, as the main disaccharide in milk, the lactose content greatly influences the rate of water secretion into the milk attributed to milk osmolality, which, in turn, is positively correlated with milk production. In fact, lactose is considered to be an indirect indicator of milk production (Miglior et al., 2007; Ptak et al., 2012). A correlation between lactose and milk yield of 0.979 has been reported for Holstein cows (Miglior et al., 2007); however, this correlation considered lactose yield, rather than lactose percentage, as the trait of analysis. Furthermore, there have been no reports of this relationship for beef cattle; thus, this assumed correlation requires further confirmation.
The CS showed a significant effect on the levels of protein (P<0.01) and fat (P<0.05) (Table 2). For protein, the highest mean was observed in the September-October season, with a peak content of 4.41%. This season is associated with a higher availability of rainfall and better grazing opportunities for animals. For fat, the largest difference occurred in the November-April season, with the highest mean fat content of 0.87% (Table 2). The seasonal and regional differences in milk fat and protein composition are most likely attributed to local differences
Table 1 - Overall means and standard errors of milk components (%) and growth traits (kg) of the studied Charolais animals
Traits Mean SE
Milk components (n = 71)
Protein 3.74 0.81
Fat 0.77 0.48
Lactose 4.27 0.92
Solids non-fat 8.79 0.69
Growth traits (n = 71)
Birth weight 40.12 6.63
WW205 218.63 48.87
WW205 - weaning weight adjusted to 205 days.
PRT - protein; LAC - lactose; SNF - solids non-fat.
in feed supplies (Palmquist, 2006). If the observed increase in the fat level is associated with the availability of feed or certain strategic supplemental management programs, then the protein intake may also exert subtle effects on milk fatty acid levels by providing precursors for the synthesis of various branched-chain fatty acids via the ruminal degradation of dietary protein (Palmquist et al., 1993). In the case of protein, for each 1% increase in dietary crude protein, milk protein may increase by 0.02% (Emery, 1978). In dairy cattle, the intensification in selection for milk solids is highly related to profit; however, although not as stressed, the milk yield and milk composition have also been proposed as key components for maternal ability and pre-weaning growth in beef cattle production systems. Hence, growth traits were assessed to examine the effects of a number of non-genetic factors on growth, as well as their relationship with the previously discussed milk composition traits.
Regarding BW, SL and AOD exerted a highly significant effect on BW (P = 0.001) (Table 3). The effect of SL is related to the genetic background of an animal and is directly related to the breeding objectives of the genetic origin. In this case, Full French animals are heavier at birth (>6 kg) compared with those of American origin (Table 3). Sifuentes-Rincón et al. (2007b) analyzed Charolais populations in Mexico and reported that the genetic structure conditioned by breeding lines is maintained by the genetic material preference of breeders, which maintains the observed level of differentiation, even phenotypically. In addition, the association of AOD with feed requirements and cow size is well known, and heifers and younger cows generally produce smaller calves at birth that are lighter at weaning than older cows (Robinson et al., 2013). Considering WW205, only CS exerted a significant effect (Table 4); this factor, as discussed previously, is directly related to the availability
of feed during the period from the month of birth to the weaning time. In extensive production systems, seasonal changes can produce variations in forage quality (Waterman et al., 2007), although CS did not exert a significant effect in that study on BW or WW205.
Our results from the analysis of residual correlations revealed that only lactose showed a small but significant (P = 0.001) relationship with WW205 (Table 5). The relationship between lactose and this growth trait may be explained by the effect of milk yield on WW205 because the amount of lactose is associated with milk production; therefore, a larger supply of milk to a calf might result in a pre-weaning weight gain. Relationships between pre-weaning weights and milk components have been previously studied. Martínez Velázquez et al. (2010), in a study with Criollo and Guzerat cows and their crosses,
Table 2 - Least square means and standard errors for milk components (%) of Charolais cows with different ages at calving (years) and different calving seasons
Effect Protein Fat Lactose Solids non-fat
Age at calving
≤3 3.86±0.13 0.76±0.08 4.40±0.12 8.89±0.12
4 3.76±0.12 0.58±0.07 4.44±0.11 8.84±0.11
5 3.89±0.16 0.62±0.09 4.71±0.14 9.13±0.14
6 3.76±0.16 0.62±0.10 4.67±0.15 9.22±0.15
7 3.82±0.29 0.64±0.18 4.39±0.29 8.87±0.28
≥8 4.11±0.20 0.76±0.11 4.24±0.18 8.80±0.18
Calving season ** *
May-June 3.67±0.12b 0.66±0.09b 4.68±0.12 9.04±0.12
July-August 3.82±0.20b 0.57±0.11b 4.37±0.18 8.81±0.18
September-October 4.41±0.21a 0.55±0.12b 4.25±0.19 9.14±0.19
November-April 3.57±0.09b 0.87±0.06a 4.59±0.08 8.85±0.08
Means followed by different letters are significantly different (*P<0.05; **P<0.01).
Table 3 - Least squares means and standard errors for birth weight of Charolais calves by sex, sire line, calving season, and age of dam
Factor Birth weight (kg)
Sex of calf
Female 45.68±2.31
Male 43.71±1.95
Sire line **
French 47.97±2.42a
American 41.42±2.33b
Calving season
May-June 41.59±1.89
July-August 45.70±3.02
September-October 50.00±6.15
November-April 41.49±1.28
Age of dam (years) **
≤3 41.68±2.51b
4 45.09±2.20ab
5 44.85±2.54ab
6 49.05±2.46a
7 42.36±4.54ab
≥8 45.142±4.25ab
reported significant correlations (P<0.05) between WW205 and the percentages of protein (r = –0.18), fat (r = 0.16), lactose (r = 0.21), and solids non-fat (r = 0.19). Similarly, Daley et al. (1978) reported significant correlations (P<0.05) between the pre-weaning weight and kilograms of fat (r = 0.37), protein (r = 0.39), lactose (r = 0.42), and solids non-fat (r = 0.42) for B. taurus and B. indicus × B. Taurus. Quiroz (1994), in a study with B. taurus and its crosses with
B. indicus, also observed significant correlations (P<0.05) between the pre-weaning weight and the kilograms of fat (r = 0.27), protein (r = 0.47), and total solids (r = 0.36) of milk. Finally, Melton et al. (1967) reported significant correlations between the total weight gain in calves and the amounts of lipids (r = 0.31), solids non-fat (r = 0.43), total solids (r = 0.41) and milk (r = 0.40) for Angus, Hereford, and Charolais cows.
Conclusions
The composition and amount of milk components consumed by Charolais calves are determinant of their pre-weaning performance. In addition, the calving season, sire line, and age of the dam are factors that affect the
composition and amount of milk produced by Charolais cows, which in turn, affect the calf weight at weaning.
Acknowledgments
The authors thank the herd owners for supporting the cattle sampling. Special thanks to Dr. G. Martínez-Velazquez for revising the manuscript. We acknowledge the financial support from research grants SIP-IPN 20131206 and FOMIX 177460.
References
Asociación Charolais Charbray Herd Book de México. 2013. Available at: <http://charolais.org.mx/index.html> Accessed on: Oct. 21, 2013.
Ayadi, M.; Caja, G.; Such, X.; Rovai, M. and Albanell, E. 2004. Effect of different milking intervals on the composition of cisternal and alveolar milk in dairy cows. Journal of Dairy Research 71:304-310. Brown, M. A.; Brown Jr., A. H. and Sandelin, B. A. 2002. Relationship
of milk yield and quality to preweaning gain of calves from Angus, Brahman and reciprocal-cross cows on different forage system. Journal of Animal Science 80:2522-25227.
Brown, M. A. and Lalman, D. L. 2010. Milk yield and quality in cows sired by different beef breeds. The Professional Animal Scientist 26:393-397.
Cañas, A. J.; Ramirez, T. J.; Arboleda, A. O.; Ochoa, S. J.; Vergara, G. O. and Cerón-Muñoz, M.2008. Estimation of genetic parameters for weaning weight in white orejinegro cattle in the colombian northewest. Revista MVZ Córdoba 13:1138-1145. Cerdótes, L.; Restle, J.; Alves Filho, D. C.; Nörnberg, M. F. B. L.;
Nörnberg, J. L.; Heck, I. and Silveira, M. F. 2004. Produção e composição do leite de vacas de quatro grupos genéticos submetidas a dois manejos alimentares no período de lactação. Revista Brasileira de Zootecnia 33:610-622.
Clutter, A. C. and Nielsen, M. K. 1987. Effect of level of beef cow milk production on Pre- and Postweaning calf growth. Journal of Animal Science 64:1313-1322.
Daley, D. R.; McCuskey, A. and Bailey, C. M. 1978. Composition and yield of milk from beff-type Bos Taurus and Bos Indicus x Bos
Taurus dams. Journal of Animal Science 64:373-784.
Daley, D. R.; McCuskey, A. and Bailey, C. M. 1986. Characterization of milk constituents of Bostaurus and Bosindicus x Bostaurus breed types. p.308-313. In: Proceedings of the 3rd World Congress on Genetics Applied to Livestock Production, Lincoln, Nebraska.
Denogean, B. F. G.; Moreno, M. S.; Ibarra, F. F. A.; Martín, R. M. H.; Retes, L. R.; Martínez, D. A. B.; Aguilar, V. A. and Moreno, A. C. Y. 2012. The rainfall and production cattle in Sonora. Revista Mexicana de Agronegocios 16:146-153.
El-Loly, M. 2011. Composition, properties and nutritional aspects of milk fat globule membrane. Polish Journal of Food and Nutrition Sciences 61:7-32.
Emery, R. S. 1978. Feeding for increased milk protein. Journal of Dairy Science 61:825-828.
FAO - Food and Agriculture Organization of the United Nations. 2007. The State of the World’s Animal Genetic Resources for Food and Agriculture. Rischkowsky, B. and Pilling, D., eds. FAO, Rome. Guillén Trujillo, A.; Guerra Iglesias, D.; Ávila Serrano, N.; Palacios
Espinosa, A.; Ortega Pérez, R. and Espinoza Villavicencio, J. L. Table 5 - Pearson correlation coefficients (r) among milk components
and adjusted weaning weight
Milk component r
Protein –0.09
Fat 0.02
Lactose 0.15**
Solids non-fat 0.08
**P<0.001.
Table 4 - Least squares means and standard errors for weaning weight adjusted to 205 days of Charolais calves by sex, sire line, calving season and age of dam
Factor Weaning weight (kg)
Sex of calf
Female 229.10±12.73
Male 248.87±15.18
Sire line
French 245.98±15.84
American 232.00±15.19
Calving season **
May-June 229.05±12.66ab
July-August 195.27±19.80b
September-October 298.53±40.29a
November-April 233.14±8.41ab
Age of dam (years)
≤3 240.60±16.94
4 248.15±14.74
5 238.52±16.73
6 250.30±16.19
7 246.26±29.78
≥8 210.09±27.78
2012. Parameters and genetic trends for weight at weaning and 18 months of age in red Zebu cattle in Cuba. Revista Mexicana de Ciencias Pecuarias 3:19-31.
Jeffery, H. B. and Berg, R. T. 1971. Evaluation of milk variables as measures of milk effect on preweaning performance of beef cattle. Canadian Journal of Animal Science 51:21-30.
Lollivier, V.; Guinard-Flament, J.; Ollivier-Bousquet, M. and Marnet, P. G. 2002. Oxytocin and milk removal: two important sources of variation in milk production and milk quality during and between milkings. Reproduction Nutrition Development 42:173-186. Marston, T. T.; Simms, D. D.; Schalles, R. R.; Zoellner, K. O.; Martin,
L. C. and Fink, G. M. 1992. Relationship of milk production, milk expected progeny difference and calf weaning weight in Angus and Simmental cow-calf pairs. Journal of Animal Science 70:3304-3310.
Martínez, G. 2009. Comparison of models to estimate genetic parameters of growth traits in registered Brahman cattle. Revista de la Facultad de Agronomía, Universidad Central de Venezuela 35:34-42. Martínez Velázquez, G.; Borrayo Zepeda, A.; Montaño Bermúdez, M.;
Bustamante Guerrero, J. J.; Palacios Fránquez, J. A.; Vega Murillo, V. E. and Ríos Utrera, A. 2012. Milk yield and its relationship to weaning weight of calves from Criollo, Guzerat and F1 reciprocal cross cows. Revista Mexicana de Ciencias Pecuarias 3:501-514. Martínez Velázquez, G.; Palacios Fránquez, J. A.; Bustamante
Guerrero, J. J.; Ríos Utrera, A.; Vega Murillo, V. E. and Montaño Bermudez, M. 2010. Milk composition in Criollo, Guzerat and F1 cows and its influence on weaning weight of calves. Revista Mexicana de Ciencias Pecuarias 1:311-324.
Melton, A. A.; Riggs, J. K.; Nelsom, L. A. and Cartwright, T. C. 1967. Milk production, composition and calf gains of Angus, Charolais and Hereford cows. Journal of Animal Science 26:804-809. Meyer, K.; Carrick, M. J. and Donnelly, B. J. 1994. Genetic parameters
for milk production of Australian beef cows and weaning weight of their calves. Journal of Animal Science 72:1155-1165. Miglior, F.; Sewalem, A.; Jamrozik, J.; Bohmanova, J.; Lefebvres, D.
M. and Moores, R. K. 2007. Genetic analysis of milk urea nitrogen and lactose and their relationships with other production traits in Canadian Holstein cattle. Journal of Dairy Science 90:2468-2479. Mondragon, I.; Wilton, J. W.; Allen, O. B. and Song, H. 1983. Stage
of lactation affects, repeatabilities and influences on weaning weights of yield and composition of milk in beef cattle. Canadian Journal of Animal Science 63:751-761.
Palacios-Espinosa, A.; Ezpinosa-Villavicencio, J. L.; Guerra-Iglesias, D.; Gonzalez-Peña, F. D. and De Luna de la Peña, R. 2010. Direct and maternal genetic effects for weaning weight in a Zebu beef cattle population in Cuba. Revista Mexicana de Ciencias Pecuarias 1:1-11. Palmquist, D. L.; Denise Beaulieu, A. and Barbano, D. M. 1993. Feed
and animal factors influencing milk fat composition. Journal of Dairy Science 76:1753-1771.
Palmquist, D. L. 2006. Milk fat: Origin of fatty acids and influence of nutritional factors thereon. p.44-92. In: Advanced dairy chemistry. Volume 2: Lipids. Fox, F. P. and McSweeney, P. H. L., eds. Springer, New York.
Parra-Bracamonte, G. M.; Sifuentes-Rincón, A. M.; Arellano-Vera, W.; Almanza-González, A. and De la Rosa-Reyna, X. F. 2009. Three commercial-trait-related genetic markers typification in Charolais cattle: implications for Mexican beef cattle production. Revista Colombiana de Ciencias Pecuarias 22:257-266.
Ptak, E.; Brzozowski, P. and Bieniek, J. 2012. Genetic parameters for lactose percentage in the milk of Polish Holstein-Friesians. Journal of Animal and Feed Sciences 21:251-262.
Quintero, J. C.; Triana, J. G.; Quijano, J. H. and Arboleda, E. 2007. Influence of maternal effect in estimating genetic parameters for weaning weight in a beef cattle herd. Revista Colombiana de Ciencias Pecuarias 20:117-123.
Quiroz, V. J. 1994. Producción y components de leche en vacas
Bos indicus y Bos Taurus x Bos indicus. Thesis (Maestría).
Universidad Nacional Autónoma de México, México DF. Robinson, D. L.; Cafe, L. M. and Greenwood, P. L. 2013.
Developmental programming in cattle: Consequences for growth, efficiency, carcass, muscle and beef quality characteristics. Journal of Animal Science 91:1428-1442.
Rodrigues, P. F.; Menezes, L. M.; Azambuja, R. C. C.; Suñé, R. W.; Barbosa Silveira, I. D. and Cardoso, F. F. 2014. Milk yield and compostion from Angus and Angus-cross beef cows raised in southern Brazil. Journal of Animal Science 92:2668-2676. Rutledge, J. J.; Robinson, O. W.; Ahlschwede, W. T. and Legates, J.
E. 1971. Milk yield and its influence on 205-day weight of beef calves. Journal of Animal Science 33:536-567.
Sifuentes-Rincón, A. M.; Puentes-Montiel, H. E.; Moreno-Medina, V. R.; De la Rosa-Reyna, X. F. and Rosales-Alday, J. 2007a. Frequency of the myostatin Q204X allele in Charolais breed beef cattle from northeast Mexico. Técnica Pecuaria en México 45:85-92.
Sifuentes-Rincón, A. M.; Puentes-Montiel, H. and Parra-Bracamonte, G. M. 2007b. Assessment of genetic structure in Mexican charolais herds using microsatellite markers. Electronic Journal of Biotechnology 10:492-499.
Totusek, R.; Arnett, D. W.; Holland, G. L. and Whiteman, J. V. 1973. Relation of estimation method, sampling interval and milk composition to milk yield of beef cows and calf gain. Journal of Animal Science 37:153-158.
UGRNL. 2012. Unión Ganadera Regional de Nuevo León. Comunicación ganadera 15:11.