https://doi.org/10.5194/cp-13-1901-2017 © Author(s) 2017. This work is distributed under the Creative Commons Attribution 4.0 License.
The climate of the Common Era off the Iberian Peninsula
Fátima Abrantes1,2, Teresa Rodrigues1,2, Marta Rufino2,3, Emília Salgueiro1,2, Dulce Oliveira1,2,4, Sandra Gomes1, Paulo Oliveira1, Ana Costa5, Mário Mil-Homens1, Teresa Drago1,6, and Filipa Naughton1,2
1Portuguese Institute for Sea and Atmosphere (IPMA), Divisão de Geologia Marinha (DivGM),
Rua Alferedo Magalhães Ramalho 6, 1495-006 Lisbon, Portugal
2CCMAR, Centro de Ciências do Mar, Universidade do Algarve, Campus de Gambelas, 8005-139 Faro, Portugal 3IFREMER – Centre Atlantique (French Research Institute for Exploitation of the Sea),
Département Ecologie et Modèles pour l’Halieutique (EMH), Rue de l’Ile d’Yeu – BP 21105, 44311 Nantes CEDEX 3, France
4Paléoclimatologie et paléoenvironnements marins, Université de Bordeaux, EPOC, UMR 5805, 33615 Pessac, France 5Centro de Investigação em Biodiversidade e Recursos Genétics (EnvArchCIBIO/InBIO) and Archaeosciences
Laboratory (LARC/DGPC), Rua da Bica do Marquês, 2, 1300-087 Lisbon, Portugal
6Instituto Dom Luiz, Universidade de Lisboa, 1749-016 Lisbon, Portugal
Correspondence:Fátima Abrantes ([email protected])
Received: 12 June 2017 – Discussion started: 27 June 2017
Revised: 17 November 2017 – Accepted: 2 December 2017 – Published: 21 December 2017
Abstract.The Mediterranean region is a climate hot spot,
sensitive not only to global warming but also to water avail-ability. In this work we document major temperature and pre-cipitation changes in the Iberian Peninsula and margin dur-ing the last 2000 years and propose an interplay of the North Atlantic internal variability with the three atmospheric cir-culation modes (ACMs), (North Atlantic Oscillation (NAO), east atlantic (EA) and Scandinavia (SCAND)) to explain the detected climate variability.
We present reconstructions of sea surface temperature (SST derived from alkenones) and on-land precipitation (es-timated from higher plant n-alkanes and pollen data) in sed-imentary sequences recovered along the Iberian Margin be-tween the south of Portugal (Algarve) and the northwest of Spain (Galiza) (36 to 42◦N).
A clear long-term cooling trend, from 0 CE to the begin-ning of the 20th century, emerges in all SST records and is considered to be a reflection of the decrease in the Northern Hemisphere summer insolation that began after the Holocene optimum. Multi-decadal/centennial SST variability follows other records from Spain, Europe and the Northern Hemi-sphere. Warm SSTs throughout the first 1300 years encom-pass the Roman period (RP), the Dark Ages (DA) and the Medieval Climate Anomaly (MCA). A cooling initiated at 1300 CE leads to 4 centuries of colder SSTs contemporary
with the Little Ice Age (LIA), while a climate warming at 1800 CE marks the beginning of the modern/Industrial Era.
Novel results include two distinct phases in the MCA: an early period (900–1100 years) characterized by intense pre-cipitation/flooding and warm winters but a cooler spring–fall season attributed to the interplay of internal oceanic vari-ability with a positive phase in the three modes of atmo-spheric circulation (NAO, EA and SCAND). The late MCA is marked by cooler and relatively drier winters and a warmer spring–fall season consistent with a shift to a negative mode of the SCAND.
The Industrial Era reveals a clear difference between the NW Iberia and the Algarve records. While off NW Iberia variability is low, the Algarve shows large-amplitude decadal variability with an inverse relationship between SST and river input. Such conditions suggest a shift in the EA mode, from negative between 1900 and 1970 CE to positive after 1970, while NAO and SCAND remain in a positive phase. The particularly noticeable rise in SST at the Algarve site by the mid-20th century (±1970), provides evidence for a regional response to the ongoing climate warming. The re-ported findings have implications for decadal-scale predic-tions of future climate change in the Iberian Peninsula.
1 Introduction
Today’s anthropogenically induced global warming poses a pressing problem for societies’ sustainability (IPCC, 2013a, b). Regions such as the Arctic and the Mediterranean are highlighted as the most sensitive and potentially vulnerable to ongoing global warming (Climate, 2011; Giorgi, 2006).
Global and regional model simulations for the Iberian Peninsula forecast temperatures rising above the predicted global mean and changes in precipitation consistent with long dry summers and a short and wetter rainy season par-ticularly for the southern region (Guiot and Cramer, 2016; Miranda et al., 2002). Most of this knowledge is based on the analysis of instrumental data and modeling of global and hemispheric average conditions. However, given the limited time span covered by the instrumental data and to better comprehend the impact of climate warming, it is essential to analyze and understand the response of the climate sys-tem from the perspective of a longer timescale. In light of the current warming, previous warm periods and warming transitions such as those occurring over the last 2000 years are of particular interest. Proxy-based climate reconstruc-tions and modeling of the climate for the last 1 or 2 millennia in the Northern Hemisphere have identified the late Roman period (RP; 0–500 CE), the Dark Ages (DA; 500–900 CE) and the Medieval Climate Anomaly (MCA; 900–1300 CE), also known as Medieval Warm Period (MWP), and the Lit-tle Ice Age (LIA; 1350–1850 CE) and attribute this climate variability mainly to external forcing such as solar and vol-canic activity (Fernandez-Donado et al., 2013; Hegerl et al., 2006; Jones et al., 2001; McKim, 1998; Schurer et al., 2014). After 1900 CE, the rise in global mean atmospheric temper-ature is mainly attributed to the unprecedented increase in greenhouse gases in the atmosphere (IPCC, 2013a).
Throughout the last 2 decades, many high-resolution 2000 years climate records have been generated from Iberian lake sediments (e.g., Hernández et al., 2015; Jambrina-Enríquez et al., 2016; Morellón et al., 2009; Moreno et al., 2008; Valero-Garcés et al., 2006); speleothems (e.g., Martín-Chivelet et al., 2011) and marine sediments (e.g., Abrantes et al., 2005; Abrantes et al., 2011; Desprat et al., 2003; Diz et al., 2002; Lebreiro et al., 2006; Pena et al., 2010). These individual evaluations of climate evolution over Iberia, and compiled ones (e.g., Moreno et al., 2011; Sánchez-López et al., 2016), reveal multi-decadal to centennial climate vari-ability in accordance with the main patterns identified for the Northern Hemisphere (Ahmed et al., 2013; Büntgen et al., 2011; Cook et al., 2004; Esper et al., 2002; Luterbacher et al., 2016; Moberg et al., 2005).
Additionally, given the dominance of the North Atlantic Oscillation (NAO) (Hurrell, 1995) in the Northern Hemi-sphere, most of the above works attribute the variability to changes in the prevailing modes of the NAO (Abrantes et al., 2005, 2011; Lebreiro et al., 2006). In recent years it has been proposed that the east Atlantic (EA) and Scandinavia
(SCAND) modes also play a significant role in North At-lantic climate evolution (Comas-Bru and McDermott, 2014; Hernández et al., 2015; Jerez and Trigo, 2013). Sánchez-Lopez et al. (2016), on the basis of a spatiotemporal inte-gration of several climate reconstructions, attempted to iden-tify the role of those atmospheric patterns over the Iberian Peninsula. Their results reveal E–W and N–S humidity gra-dients from 0 to 500 CE and between 500 and 900 CE, re-spectively, while between 900 and 1850 CE temperature and humidity conditions are more homogenous throughout the peninsula. These conclusions support atmospheric pathways as the main control of climate variability in western Europe on multi-decadal timescales. However, Yamamoto and Pal-ter (2016) observed a clear relationship between the Atlantic Multidecadal Oscillation (AMO) and the atmospheric circu-lation over Europe, with northerly winds associated with a positive state of the AMO and zonal winds with a negative state of the AMO. To better understand the role of oceanic and atmospheric processes on past climate and their rele-vance to the Iberian Peninsula’s future climate, it is piv-otal to obtain more high-resolution climate archives of the most recent centuries and millennia. Here, we explore the main oceanic and atmospheric processes that drive complex spatial climate patterns over the Iberia Peninsula across the last 2000 years by integrating new records from the Iberian Margin, Galiza, Minho and Algarve, with published datasets (Porto and Tagus; Abrantes et al., 2005, 2011; Lebreiro et al., 2006).
2 Oceanographic conditions
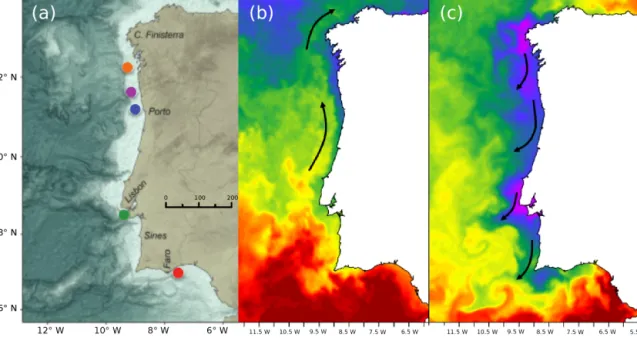
The western coast of the Iberian Peninsula (Fig. 1) is char-acterized by contrasting oceanographic conditions between a spring–summer (April to October) coastal upwelling regime and a surface equatorward current (Fiúza, 1982, 1983; Peliz et al., 2002; Relvas et al., 2007) and a winter alongshore pole-ward warm counter current (Fiúza and Frouin, 1986; Peliz et al., 2005).
The spring–summer upwelling constitutes the northern part of the eastern North Atlantic upwelling/Canary System and is connected to the presence of the Azores high-pressure system and the development of northerly alongshore winds (Fiúza, 1983). Upwelled waters are transported southwards by a jet-like surface current (Fig. 1c), the Portuguese Coastal Current, which is the coastal component of the Portuguese Current that branches of the North Atlantic Current, (Fiúza, 1982, 1983; Fiúza and Macedo, 1982). On the southern coast (Algarve), upwelling favorable conditions are rare, but west-ern upwelled waters flow around Cape S. Vicente and along the south coast, (Fiúza, 1982, 1983; Fiúza and Macedo, 1982; Sánchez and Relvas, 2003) and can spread to its easternmost sector (Cardeira et al., 2013). This eastward flow of cold western upwelled waters alternates with the propagation of westward flows related to warm water and increased vertical
Figure 1.(a): Core locations over Iberian Margin bathymetry: Geoß11033-1/Galiza in orange; DIVA09 GC/Minho in magenta; PO287-6B, -6G/Porto (Douro Mud Belt) in blue; PO287-26B, -26G, D130902, D13882 Tagus (Tagus Mud Belt) in green; POPEI VC2B/Algarve in red. The color assigned to each core location will be applied in all figures. (b): Winter satellite-derived sea surface temperature (SST) image (23 January 2003) showing the surface signature of the Iberian Poleward Current. (c): Summer SST image illustrating coastal upwelling conditions (colder coastal SST) along the western Iberian Margin (3 August 2005). Panels (b) and (c): land covered areas appear in white; the color shades were selected to highlight the main oceanographic structures; the image source is JPL-PODAAC (https://mur.jpl.nasa.gov/).
stratification showing a direct relationship between flow ve-locity and water temperature (Garel et al., 2016; Relvas and Barton, 2002).
In winter, the prevalence of westerly or southwesterly winds leads to the intensification of the Iberian Poleward Current (Fig. 1b). This current, which is a branch of the Azores Current, consists of an upper-slope–shelf-break pole-ward flow that transports saltier and warmer (subtropical) waters (Peliz et al., 2005) depending mostly on the inten-sity of the southerly winds (Teles-Machado et al., 2015). Another important feature of the winter circulation over the western margin is the formation of coastal buoyant plumes, characterized by low salinities and temperature lower than the ambient shelf waters (Peliz et al., 2005). Such plumes result from the freshwater discharge from rivers, thus reflect-ing continental precipitation. Precipitation occurs mainly in winter, as a result of the moisture carried onto the peninsula by the westerly winds, and has important latitudinal differ-ences, from 500 mm yr−1in the southeast to > 3000 mm yr−1 in the northwestern area (Miranda et al., 2002). As a conse-quence, buoyant plumes are mainly associated with the major northern Portuguese rivers (Minho, Douro, Mondego) but are also linked to the Tagus River and can either develop into in-shore currents (under typical winter downwelling conditions) or spread offshore under northerly wind conditions (Iglesias et al., 2014; Marta-Almeida et al., 2002; Mendes et al., 2016; Oliveira et al., 2007; Otero et al., 2008).
3 Material and methods
This study combines proxy data previously published for sedimentary sequences collected off the Tagus River (PO287-26B and -26G, D13902 and D13882 designated as Tagus; Abrantes et al., 2005; Rodrigues et al., 2009) and Douro River (PO287-6B and -6G, designated as Porto; Abrantes et al., 2011) with new data from three other sites on the Iberian Margin (Table 1, Fig. 1). Two of the new sites are located in the northern area, off Vigo (GeoB11033-1 referred to as Galiza) and off the Minho River mouth (DIVA09 GC, referred to as Minho in this paper), and one core is from the southern Iberian/Algarve margin (POPEI VC2B, referred to as Algarve). With the exception of the Galiza deep-sea core, all other sedimentary sequences were collected on the inner shelf in areas directly affected by river discharge.
Age models of the three new cores (Galiza, Minho and Algarve), were constructed using the methods of Abrantes et al. (2005, 2011) and are based on accelerator mass spec-trometry radiocarbon (AMS 14C) and 210Pb-inferred dates (Sect. 1, Table S1, Figs. S1 and S2 in the Supplement). Raw AMS14C dates were corrected for marine reservoir ages of 400 years ±36 (Abrantes et al., 2005) and converted to cal-endar ages using INTCAL04 (Reimer et al., 2004). The ob-tained calendar ages correspond to years Anno Domini, now designated by Common Era (CE; McKim, 1998).
Sea surface temperature (SST) was determined based on the ratio of alkenones (Uk0) synthesized by coccolithophores
Table 1. ID, water depth, geographic location, core type, sampling cruise, sedimentation rate (SR) and age-model origin of the seven sedimentary sequences used in this study.
Site ID Water Lat N Long W Core type Cruise SR Age model
depth
(m) (mm yr−1)
Galiza GeoB11033-1 1873 42.1698 −9.5360 Box RV Poseidon 342 – Galiomar 0.4 This work Minho DIVA09GC 119 41.9168 −9.0735 Gravity RV Sarmiento de Gamboa 0.5 This work
Porto PO287-6B, 6G 84 41.3356 −8.9888 Gravity RV Poseidon – PALEO1 6.3 Abrantes et al. (2011) Tagus D13902 90 38.5540 −9.3355 Long piston RV Discovery 249 7.0 Abrantes et al. (2005) Tagus PO287-26B, 26G 96 38.5582 −9.3640 Box/gravity RV Poseidon – PALEO1 7.0 Abrantes et al. (2005) Tagus D13882 88 38.6450 −9.4542 Long piston RV Discovery 249 0.2 Rodrigues et al. (2009) Algarve POPEI VC2B 96 36.8800 −8.0700 Vibrocore NRP Auriga – POPEI0108 1.2 This work
(phytoplankton group) (e.g., Eglinton et al., 1992; Rosell-Melé et al., 1994; Villanueva and Grimalt, 1997). Lipid compounds synthesized by higher plants, such as C23–C33 n-alkanes ([n-alk]) (e.g., Eglinton and Hamilton, 1967), and the total pollen concentration (TPC) were used as indicators of river discharge intensity and on-land precipitation regime (e.g., Rodrigues et al., 2009). Major changes in vegetation cover, that is, continental temperature and moisture condi-tions, were evaluated from pollen assemblages (Naughton et al., 2007).
Alkenones and higher plant n-alkanes were analyzed on 2 g of homogenized sediment using a Varian gas chromato-graph Model 3800 equipped with a septum programmable injector and a flame ionization detector at the DivGM-IPMA (Divisão de Geologia Marinha – Instituto do Mar e da Atmosfera) laboratory according to the methods de-scribed in Villanueva (1996) and Villanueva et al. (1997). The analytical error was 0.5◦C. The concentration of each compound was determined using hexatriacontane as an in-ternal standard. For the calculation of SST, we selected the globally defined calibration of Muller et al. (1998) (Uk370 =0.033 × SST −0.044). Both alkenone-based SST and [n-alk] are widely accepted proxies for SST and river input, but to better understand our regional records, the significance of our high-resolution sediment data was assessed by com-parison to NOAA daily Optimum Interpolation Sea Surface Temperature (OISST, V2 AVHRR-only) dataset (Fig. S3) and the river discharge dataset at Sistema Nacional de In-formação de Recursos Hídricos (SNIRH).
Sample preparation procedures for pollen analyses fol-lowed the methods described in Naughton et al. (2007). Pollen and spores were counted using a Nikon light mi-croscope at ×550 and ×1250 (oil immersion) magnifica-tion. Pollen identification was done via comparison with the pollen atlases of Moore et al. (1991) and Reille (1992). A minimum of 100 Lycopodium grains, 20 pollen types and 100 pollen grains, excluding the overrepresented Pinus, have been counted (Naughton et al., 2007). Pollen was gathered in two main groups: AP (arboreal pollen) including all trees and shrubs but excluding the overrepresented pine taxa; the
semi-desert plants, which groups xerophytic shrubs of semi-semi-desert habitats (Artemisia, Chenopodiaceae, Ephedra).
To reduce the local variability signal and better evaluate the multi-decadal record at the regional level, a stack of all the cores was generated from the SST and n-alkanes orig-inal records on their origorig-inal age models. Each record was standardized (subtracting each value by the mean) and scaled (dividing the centered columns by their standard deviation). This technique weights high-resolution records more heavily and prevents interpolation across gaps or hiatuses from af-fecting the stack (Lisiecki and Raymo, 2005). Additionally, a test of the sensitivity of the stack to the bin size and the inadequacies of the proxy data (Supplementary Material) re-veals that the stack is insensitive to bin sizes (20–50 years) and independent of data deficiencies (Fig. S4). To focus on lower-variability periods, a similar stack was built using a 5-year bin size and the Porto, Tagus and Algarve cores with a sedimentation rate > 0.4 cm yr−1(Fig. S3, bottom panel).
To investigate the existence of periodic signals and poten-tial changes in their amplitude through time, we carried out a continuous time series transformation with a Morlet wavelet analysis on each dataset and stack (Torrence and Compo, 1998) after interpolation of the series to regular time steps. Interpolation was done using a cubic-splines method, and the temporal resolution of the interpolation was established as half of the absolute median difference between every consec-utive time interval. Data were then detrended using a modi-fied negative exponential curve, as required for the analysis. All statistical analysis was done using the libraries bi-wavelet (Akima and Gebhardt, 2016; Gouhier et al., 2016), from R project (R Core Team, 2016).
4 Results
All the sedimentary sequences selected for this study have exceptionally high sedimentation rates in the upper levels, allowing for a very high temporal resolution of 2–3 years in the top sediments. In the older part of the sequences, larger sampling intervals and/or lower sedimentation rates provide a temporal resolution of ±30 years. Additionally, the anal-yses of SST and multiple proxies for on-land precipitation
AMO index AMO index (j) (i) (h) (g) (f) (e) (d) (c) (b) (a) European summer stack
Figure 2.Comparison of Uk370-SST over the last 2000 years at sites Galiza (orange), Minho (magenta), Porto (blue), Tagus (green) and Algarve (red) (a); SST stack constructed from all Iberian Margin records (b); Uk370-SST at Ria de Vigo (Diz et al., 2003) (c); Northern Hemisphere annual mean atmospheric temperature anomaly (Moberg et al., 2005) (d); northern Spain atmospheric temperature anomaly (Martín-Chivelet et al., 2011) (e); European spring–fall atmospheric temperature anomaly (Luterbacher et al., 2016) (f); volcanic activity as aerosol optical depth (AOD) (Crowley and Unterman, 2013) (g); radionuclide-derived total solar irradiance (TSI) (Bard et al., 2007) (h); Northern Atlantic Ocean SST anomaly and AMO index (gray – Mann et al., 2010; black – Gray et al., 2004) (i); NAO index (Luterbacher et al., 2002; brown, Trouet et al., 2009) (j). Light gray band marks the RP; the pink band marks the MCA; the blue band marks the LIA.
from the same sediments allows us to accurately evaluate the coupled ocean and land variability without chronological ambiguity. Furthermore, to better assess the regional value of Uk370-SST and [n-alk], sediment-derived variables were com-pared to climatological datasets (Sects. S2 and S3 in the Sup-plement). Results validate the proxies and reveal that in the west coast, SST compares to winter climatological data but in the Algarve, SST mimics spring–fall (Fig. S2), providing the opportunity to disentangle winter from spring–fall condi-tions in the region.
4.1 Sea surface temperature
SSTs are minimal off Porto (14 to 16◦C) and maximal in the Algarve (17 to 20◦C), while average temperatures are ob-served in the Tagus, Minho and Galiza (15 to 18◦C) as shown in Fig. 2a by the alkenone-derived SST reconstructions for all seven Iberian Margin records. The temperature difference be-tween the areas is maintained throughout the last 2000 years, but the amplitude of decadal–secular variability is higher at the Tagus and Algarve sites (3◦C) than the 1.5◦C detected in the northern sites (Porto, Minho and Galiza) (Fig. 2a). More-over, the SST stack (Fig. 2b) reveals an overall long-term cooling trend from 0 CE to the beginning of the 20th cen-tury, with a stronger gradient at the Tagus (2.5◦C/2000 years) than at the other sites (1◦C/2000 years) (Fig. 2a). This long-term cooling follows the gradual decrease in Northern Hemi-sphere summer insolation across the Holocene reported for this region by Rodrigues et al. (2009) but also observed in other European and worldwide records (Ahmed et al., 2013; Luterbacher et al., 2016; McGregor et al., 2015).
Superimposed on the long-term cooling, both the individ-ual SST records (Fig. 2a) and the SST stack (Fig. 2b) dis-play century-scale variability comparable with that recorded in both the oceanic and continental environments of northern Spain (Fig. 2c, d) as well as in other European and North-ern Hemisphere records (Fig. 2e, f) (Diz et al., 2002; Luter-bacher et al., 2016; Martín-Chivelet et al., 2011; Moberg et al., 2005). Relatively high SSTs occur during the first nine centuries encompassing the late RP and the DA (Fig. 2a, b), mainly at the southern sites (Tagus and Algarve; Table 2). Consistently warmth conditions are also recognized at all sites between 900 and 1300 CE within the MCA (Fig. 2a, b). The western Iberia records reveal a warmer first phase in the MCA in agreement with data for the NE North Atlantic (Cunningham et al., 2013). However, at the Algarve site SST decreases during the MCA, between 800 and 1100 CE, fol-lowed by an increase of ±1◦C between 1100 and 1300 CE.
A transition from warm to cold climatic conditions starts around 1300 CE (Fig. 2b) associated with the Wolf solar min-imum (Fig. 2h) (Bard et al., 2007). Cold conditions prevail for most of the 15th to 18th centuries in western Iberia, dur-ing the well-known LIA (Bradley and Jones, 1993). SSTs are colder than during the MCA by an average 0.5◦C at the northern sites and 1.2◦C at the southern sites, particularly
in the high-resolution LIA record from the Algarve (Fig. 2a). Abrupt cold episodes are synchronous with solar minima and major volcanic events (Fig. 2g, h) (e.g., Crowley and Un-terman, 2013; Solanki et al., 2004; Steinhilber et al., 2012; Turner et al., 2016; Usoskin et al., 2011).
At 1800 CE an increase in SST marks the transition to warm modern times referred to as the Industrial Era. During the 20th century, unusually large decadal-scale SST oscilla-tions are recorded at the southern sites, in particular in the Algarve, where a more abrupt rise in SST occurs by the mid-20th century at around 1970 CE (Fig. 2a), coinciding with the Great Solar Maximum (1940–2000) (Usoskin et al., 2011).
Such an increase in the amplitude of SST variation during the last 50 years, in particular at the Algarve site, although attributable to better proxy preservation in the more recent sediments (Calvert and Pedersen, 2007), is certainly also a reflection of the regional reaction to an intensification of cli-matic extremes, an expected response to the ongoing climate warming (IPCC, 2013a; Miranda et al., 2002).
4.2 Continental precipitation
At present there is a clear north–south difference in the pre-cipitation regime, with higher mean annual prepre-cipitation in the north versus the southern region (Miranda et al., 2002). In our records, the lowest lipid compounds synthesized by continental plants ([n-alk]) (100–700 ng g−1) are found at Galiza, the deepest (1873 m) and more oceanic site, while the highest [n-alk] (1000 to 7000 ng g−1) mainly reflect the large Douro River discharge. The Minho, Tagus and Al-garve sites that are influenced by the intermediate mean an-nual discharge rivers Minho, Tagus and Guadiana (Miranda et al., 2002), show intermediate [n-alk] (700–4000 ng g−1) (Fig. 3a).
The total [n-alk] stack (Fig. 3b) highlights abrupt decadal-scale variability in river discharge throughout the first 900 years, with relatively lower mean values during the DA (Fig.3b). In the MCA, a strong positive deviation occurs in the early MCA (980–1100 CE), mainly reflecting the ex-treme river discharge in Porto, since reduced river discharge is recorded at the Tagus and Algarve sites (Fig. 3a). From 1100 to 1200 CE, river discharge is still low in the southern cores, and Porto reaches minimum values. After 1200 CE, throughout the late MCA to the beginning of the LIA, a grad-ual increase in the total [n-alk] reflects a persistent river flow at all latitudes (Fig. 3a, b). As found for SST, river input dur-ing the Industrial Era shows large-amplitude variability in the southern cores and the Algarve in particular.
Iberian precipitation variability reflects changes in river discharge intensity, which can also be estimated from oscil-lations in TPC (Naughton et al., 2009). TPC data, although at a very low temporal resolution, are available for three lo-cations: Minho, Tagus and the Algarve (Fig. 3c). The TPC data suggest a much larger river discharge during the RP at the Tagus (core D13882) than in the Minho or the
Al-Table 2.Mean Uk370 SST at the Iberian Margin during the major climatic periods of the last 2000 years. The italic and bold font highlight, respectively, colder and warmer periods.
Mean SST
Common Era Galiza Minho Douro Tagus Algarve Roman–Dark Ages < 900 16.0 16.5 – 17.5 19.1 Medieval Warm 900–1300 16.6 16.2 15.3 17.1 18.7 Period
Little Ice Age 1350–1850 16.1 15.9 14.7 15.6∗ 17.8 Modern times > 1900 15.5 – 14.7 15.5 18.3
∗Existing sediment hiatus likely affected estimated value.
garve. During the DA and the MCA, TPC-derived riverine input/precipitation is higher in the Minho and Tagus hydro-logical basins than in the Algarve, but at 1400 CE the Algarve record rises to higher values, comparable to those observed at the Minho, in accordance with [n-alk] (Fig. 3a, c).
To substantiate our [n-alk] and TPC records of on-land precipitation, we compared our data to various reconstruc-tions and historical documents of Iberian flood events. For the Tagus, flood reconstructions were based on the hydro-logical basin terraces (Benito et al., 2005, 2004, 2003) and the Taravilla Lake sediment record from the headwaters of the Tagus River (Moreno et al., 2008). Historical documenta-tion was provided by Tullot (1988) for the Douro and Minho rivers and by Barriendos and Rodrigo (2006) for most Iberian Peninsula basins including the coastal Mediterranean, and there were daily journals for the most recent flood events of the Guadiana River (Barriendos and Martin-Vide, 1998; Bar-riendos and Rodrigo, 2006; Cabrita, 2007; Varzeano, 1976) (Table 3; Fig. 3). Despite age uncertainties, the stack [n-alk] maxima between 980 and 1100 CE coincide with reports of major flooding events in both the Douro and Minho rivers (Tullot, 1988). Other periods marked by strong precipitation occur in the MCA between 1180 and 1200 CE and again at the beginning of the LIA, from 1450 to 1470 CE (Tul-lot, 1988). At the Tagus site, the [n-alk] record also agrees with significant river flooding phases (1200–1300 CE; 1950– 1980 CE) (Benito et al., 2003, 2004; Benito and Hudson, 2010). The Algarve site, located 80 km to the west of the Guadiana River mouth, appears to record not only the most recent flooding events (1876 and 1979 CE) reported in news-papers (Cabrita, 2007; Varzeano, 1976) but also the Atlantic Basin flooding events (Barriendos and Rodrigo, 2006; Ben-ito et al., 2004). The similarity of the independently identified records of storm or flooding periods for the various regions leads to the conclusion that the maxima in [n-alk] can indeed be attributed to extreme precipitation and flooding conditions (Fig. 3).
4.3 Atmospheric temperature
Arboreal (AP) and semi-desert pollen variability at the Minho, Tagus and Algarve sites were compared with the same pollen curves from the Ria de Vigo (Desprat et al., 2003) and were found to reflect the main forest and climate changes over the last 2000 years (Fig. 4a, b). Major forest ex-pansion, revealed by increasing AP percentages, occurs dur-ing the RP and the MCA, indicatdur-ing relatively warm condi-tions on-land (Fig. 4b). In contrast, a reduction of the forest cover, revealed by the decrease in arboreal pollen, suggests relatively cold conditions during the LIA (Fig. 4b). Between 1700–1800 CE there is a strong decrease in arboreal pollen in the Algarve and Minho, suggesting an abrupt cooling episode over Iberia (Fig. 4b). After 1800 CE a new increase in AP re-flects climate warming over the continent. AP variability in western Iberia over the last 2000 years shows no clear match with European summer atmospheric temperature or spring precipitation (Fig. 4f, g) but agrees with the general trend of northern Spain’s stalagmite T anomaly (Fig. 4e) (Martín-Chivelet et al., 2011) and AP variability at the Ria de Vigo (Fig. 4b) (Desprat et al., 2003).
Semi-desert plant values are highest in the Algarve (al-though with a modest 8 % contribution), lower at the Tagus site and further reduced at the Minho site, showing clearly the north to south precipitation contrast (Fig. 4a). Between 1700 and 1800 CE (within the LIA), a marked decrease in both ar-boreal taxa and semi-desert plants is observed and co-occurs with abrupt shifts between periods of an increased frequency of strong rain events (Barriendos and Martin-Vide, 1998) and periods of prolonged drought (Barriendos, 2002; Benito and Hudson, 2010). Furthermore, this interval also coincides with a period of stable temperature in northern Spain and minima in European seasonality and spring atmospheric temperature in Europe (Fig. 4e, h, i) (Luterbacher et al., 2004) as well as a minimum in spring–summer and winter precipitation (Fig. 4c, j, k) (Martín-Chivelet et al., 2011; Romero-Viana et al., 2011; Touchan et al., 2005).
(f) (e) (d) (c) (b) (a)
Atlantic basin flooding
Douro and Minho flooding Tagus and Guadiana floodingDouro and Tagus flooding
[n-alk] ng g - river input
-1
stack
[n-alc] stack
Mediterranean coast / Guadiana - Tagus
- Tagus
Figure 3.(a): [n-alk] (ng g−1) variability over the last 2 millennia and the five Iberian Margin sites; colors are as in Fig. 3. (b): The [n-alk] stack anomaly. (c): Total pollen concentration (TPC, no pollen grains cm−3sediment). (d): SST stack anomaly. (e): SST NW Atlantic cores KNR140-2-59GGC and CH07-98-MC22 (Saenger et al., 2011). (f): NAO index (black line – Luterbacher et al., 2002; green line – Cook et al., 2002; gray line – Trouet et al., 2009; brown line – Ortega et al., 2015). Dark gray bands mark the periods of Atlantic flooding as listed in Table 3. Light gray band marks the RP; the pink band marks the MCA; the blue band marks the LIA.
5 Discussion
5.1 Climate forcing mechanisms
Climate reconstructions for the Iberian Peninsula are com-plex because the seasonal variation in the oceanographic system along the Iberian Peninsula margin generates
mul-tiple conditions, the combination of which is likely to vary through time. Nevertheless, the use of multiple proxies for each core and at several sites, together with the regional anomaly stack, allows for more robust climatic configura-tions to be identified. Furthermore, our assessment of the re-gional SST records (Fig. S2) indicates that SSTs are
compa-[n-alc] stack
stack
Figure 4.Variability in semi-desert plant percentages over the 2000 years in cores DIVA, Tagus, POPEI and Ria de Vigo (magenta, green, red and black, respectively) (Desprat et al., 2003) (a); arboreal pollen percent abundance (b); the SST stack (c); the [n-alk] stack (d); northern Spain atmospheric temperature anomaly (Martín-Chivelet et al., 2011) (e); European spring–fall atmospheric temperature anomaly (Luterbacher et al., 2016) (f); spring precipitation central Europe (Büntgen et al., 2011) (g); European seasonality (h); spring AT (Luterbacher et al., 2004) (i); May–August precipitation (Touchan et al., 2005) (j); winter (DJFM) precipitation (Romero-Viana et al., 2011) (k). Light gray band marks the RP; the pink band marks the MCA; the blue band marks the LIA.
Table 3.Compilation of flooding and drought events on the western Iberian Peninsula, according to published information for the MCA, the LIA and the modern/Industrial Era. The italic font refers to the documentary sources.
Floods
Period/region Atlantic Basin Douro & Minho Tagus Guadiana References Observations
MCA
785–1205∗ Benito et al. (2003) Increased magnitude and frequency
1000–1100 Tullot (1988) Doc. sources
1000–1200∗ Benito et al. (2003) Sediment records
1150–1200 Benito et al. (2010) Max from doc. sources
1150–1290 Benito et al. (2003) Sediment records
1180–1200 Tullot (1989) Doc. sources
LIA
1430–1685∗ Benito et al. (2010) Sediment records & doc. sources
1434 – LCF 1434–LCE Barriendos and Rodrigo (2010) Doc. sources
1450–1470 1450–1500 Tullot (1988) Doc. sources
1450–1500 Benito et al. (2003) High-frequency lower magnitude
1545 – LCF 1545–LCE Barriendos and Rodrigo (2010) Doc. sources
1570–1630 Barriendos and Martín-Vide (1998) Mediterranean area – doc. sources
1590–1610 Benito et al. (2004) Doc. sources
1626 – VLCF∗ 1626–VLEF∗ 1626 – VLCF∗ Barriendos and Rodrigo (2010) Doc. sources 1636 – LCF 1637–LCE Barriendos and Rodrigo (2010) Doc. sources
1730–1810∗ Benito et al. (2010) Doc. sources
1730–1760 Benito et al. (2003, 2004) Sediment records & doc. sources
1830–1870 Barriendos and Martín-Vide (1998) Mediterranean area – doc. sources 1778 – LEF 1778–LCE Barriendos and Rodrigo (2010) Doc. sources
1780–1810 Benito et al. (2004) Doc. sources
Modern
1853 – LEF Barriendos and Rodrigo (2010) Doc. sources
1860 – LCF 1860 – LCF Barriendos and Rodrigo (2010) Doc. sources
1870–1900 Benito et al. (2003) Sediment records
1930–1950 Benito et al. (2003) Sediment records
1960–1980 Benito et al. (2003) Sediment records
1670–1950∗ 1876 Benito et al. (2003) High-frequency lower magnitude
1950–1980 1979 Benito et al. (2004) Doc. sources
Droughts
MWP 1361–1390 Barriendos and Martín-Vide (1998)
LIA
1511–1540 Barriendos and Martín-Vide (1998)
1540–1570 Barriendos (2002) Severe
1625–1640 Barriendos (2002) Severe
1750–1760 Barriendos (2002) Less severe
1810–1830 Barriendos (2002) Less severe
1880–1950 Barriendos and Martín-Vide (1998)
Modern 1880–1910 Barriendos (2002) Less severe
LCF – large catastrophic flood; LEF – large extraordinary flood; VLCF – very large catastrophic flood; VLEF – very large extraordinary event; LCE – large catastrophic event.∗Catastrophic event.
rable with winter temperatures on the west coast, while in the Algarve SST match spring–fall temperatures (Fig. S2), giv-ing us the opportunity to disentangle winter from sprgiv-ing–fall conditions in the region.
The Iberian Peninsula margin was relatively warm from 0 to 1300 CE, in particular during the final stage of the RP and the MCA (900–1300 CE), while SST slightly decreases during the DA (Fig. 2b). The LIA, which is clearly colder, lasts from 1350 to 1850 CE, when a rise in SST marks the transition to modern times/Industrial Era. This initial aug-mentation in SST is followed by a second more abrupt mid-20th-century SST rise, particularly evident at the southern-most site (Fig. 2a).
In terms of on-land precipitation, the early MCA is a pe-riod of extreme precipitation and flooding, mainly from the Douro River (Porto site) (Fig. 3a, b). During the LIA,
fre-quent but less extreme precipitation is inferred at all sites, with apparent periods of flooding that are in agreement with other flooding records (e.g., Barriendos and Martin-Vide, 1998; Benito et al., 2005; Cabrita, 2007; Moreno et al., 2008; Tullot, 1988; Varzeano, 1976). Southern Iberian Mar-gin records also show evidence of the well-known major storm events of the 20th century.
The dominant large-scale climate mode operating in the Northern Hemisphere is the NAO (Hurrell, 1995). Being mainly a winter season mode that varies on scales of days to decades, it translates into strong northerly winds and conditions favorable to coastal upwelling during positive phases, while during NAO-negative phases (also known as “blocked”), westerly/southwesterly winds predominate and result in very cold winters and increased storm activity (Hur-rell, 1995; Trigo et al., 2004).
Other prominent atmospheric circulation modes, the EA and the SCAND (Comas-Bru and McDermott, 2014; Jerez and Trigo, 2013), constitute second leading modes that in-terplay with the NAO. Their temporal variability must also have played a role in climatic evolution in the Northern Hemisphere. The EA has a strong influence on the strength and location of the NAO dipoles mainly on multi-decadal timescales and exerts a major control on winter and sum-mer temperature over the Iberian Peninsula (Hernández et al., 2015). The SCAND functions as a blocking high-pressure system that changes the westerly wind path and influences southwestern Europe mainly during its positive phase, when it contributes to below-average temperatures and above-average precipitation (Hernández et al., 2015). The regional effect of all three atmospheric circulation modes (ACMs) on SST and precipitation over the Iberian Peninsula, for win-ter and summer periods, is presented in Fig. 5 of Hernán-dez et al. (2015). With regard to the Atlantic coast, besides the negative relationship observed between NAO and winter precipitation, the EA and SCAND are also positively related to winter precipitation, particularly on the northern Iberian Peninsula. In summer, there is a slight positive relationship between SCAND and precipitation in the north but an impor-tant negative effect with temperature in most of the south.
The compilation of Sánchez-Lopes et al. (2015) concludes that the climate of the Iberian Peninsula during the last 2000 years has been modulated by the combined effect of two main modes of atmospheric circulation: the NAO and the EA. Negative NAO and positive EA generate warm at-mospheric temperatures and higher humidity in the west and south of the Iberian Peninsula during the RP. positive NAO and negative EA cause a more humid north with a W-E hu-midity gradient during the DA. Consistently warm and dry conditions during the MCA throughout the Iberian Peninsula are attributed to NAO-positive and EA-positive modes. By contrast, NAO and EA negative modes are considered to ex-plain the cold and wet winters, as well as, the cold summers proposed for the LIA.
Although our results might be explained by the above-described mechanisms proposed by Sánchez-Lopez for the RP, the DA and the LIA (Figs. 2, 3, 4), the climate conditions detected in the MCA and the Industrial Era need further dis-cussion.
5.2 The particular case of the MCA and the Industrial Era
5.2.1 The MCA: precipitation distribution and the storm track
Dry and warm winters as well as warm summers are likely to be generated by the prevalence of NAO- and EA-positive modes as proposed by Sánchez-Lopes et al. (2015). Stronger coastal upwelling conditions have also been suggested to ex-plain the productivity record of the Tagus site. This would
imply prevailing northerly winds and an active Portuguese Current, which would equate to a positive NAO-like state or frequent occurrence of extreme NAO maxima during the MCA (Abrantes et al., 2005), which agrees with the NAO reconstruction of Ortega et al. (2015). Furthermore, forest expansion indicates relatively warm conditions in both the northwestern and southern Iberian Peninsula (Fig. 4b), and these are in good agreement with atmospheric temperatures over NE Spain (Fig. 4e) (Martín-Chivelet et al., 2011), sug-gesting similar on-land conditions across northern Iberia.
However, our records show distinct conditions for the early MCA (900–1100 CE) where warm winters, cooler spring–fall and extreme precipitation characterize the north-ern Iberian Peninsula (Fig. 5). Increased fluvial input dur-ing the MCA, particularly intense around 1000 CE is also observed at other sites in northern Iberia; Ria de Vigo (Ál-varez et al., 2005) and Ria de Muros (Lebreiro et al., 2006). By contrast, the late MCA (1200–1300 CE) shows relatively cooler and stormy winters and warmer spring–fall (Fig. 5).
At present, precipitation occurs mainly as a result of the moisture carried by westerly winds that become predomi-nant during NAO-negative phases (Trigo et al., 2004). How-ever, Yang and Myers (2007) have proposed that persistent positive NAO conditions have also generated strong heat and moisture transport from the Atlantic.
A clear relationship between the NAO-derived atmo-spheric circulation over Europe and the decadal variability in north Atlantic surface temperatures (AMO), with northerly winds over Europe associated with a positive state of the AMO and zonal winds with its negative state has been shown by Yamamoto and Palter (2016). However, the clear imprint of AMO variability on European summer temperatures is not observed during wintertime. This is an absence attributed to a cancelation of the ocean SST expression by strong cold winds (Yamamoto and Palter, 2016).
Previous work from the Iberian/Atlantic ocean region (Abrantes et al., 2011) suggests coherence between SST at Porto and the AMO reconstructed instrumentally and by tree rings, implying a connection between the Iberian Peninsula coastal circulation and multidecadal variability in North At-lantic Ocean SSTs (Gra et al., 2004; Mann et al., 2010).
Frankcombe et al. (2010) propose that the AMO is dom-inated by two main timescales: 20–30 years associated with the AMOC (Atlantic Meridional Overturning Circulation), and so of ocean-internal origin, and 50–70 years related to the atmospheric exchange between the Atlantic and the Arc-tic Ocean. More recently, Buckley and Marshall (2016) re-vised the periodicities shown by various instrumental and proxy records and grouped them into decadal (20 years) and multidecadal (±40–70 years) and showed a statistical sig-nificance for the 70-year periodicity, supporting the notion that ocean dynamics play a significant role in the variability in European climate on multi-decadal timescales (Yamamoto and Palter, 2016; Zhang, 2007).
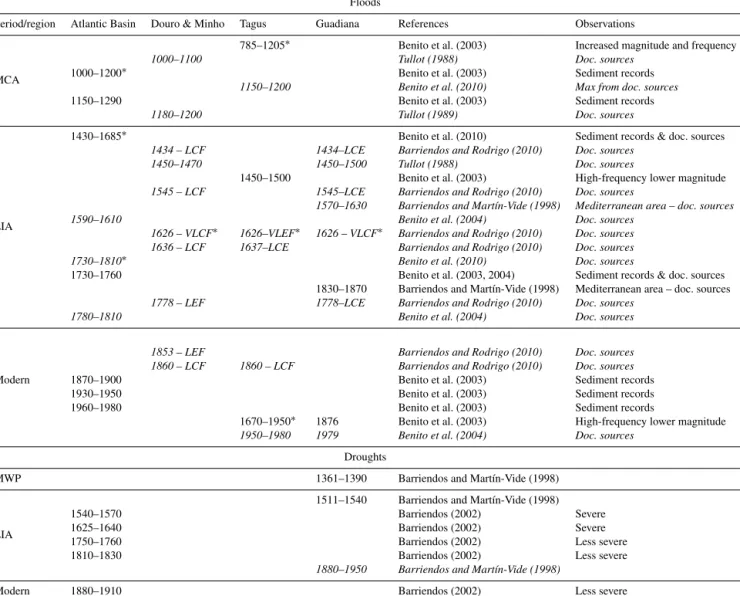
Early Late Anomaly Anomaly E Winter temperature Spring–fall temperature Algarve NW Iberia Continental T and humidity Continental T and humidity River input River input
Figure 5.SST and river-input ([n-alk] stacks for NW Iberia (Galiza, Minho and Porto) and continental T and humidity conditions extracted from arboreal pollen (% AP) at Minho are compared to the Algarve SST and [n-alk] anomalies (for easier comparison) and % AP. Pink bars mark the warmer periods (RP; MCA; Industrial Era – IE), and the blue bar marks the cold LIA. Periods of increased AMO that impact on either IP region are marked by AMO. The dominant state of the ACMs in the North Atlantic for the major climatic periods of the last 2000 years is depicted at the top of the figure (NAO; EA; SCAND). The consecutive negative and/or positive signs given for IE in the top bar (ACM) correspond to the early IE, 1850–1970, and the late IE, after 1970 CE.
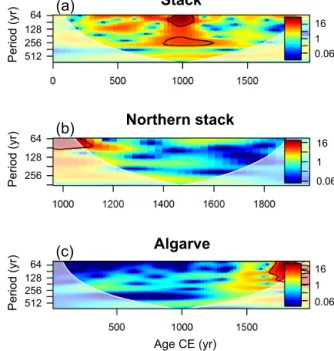
To investigate the influence of the AMO on the weather regime over the Atlantic Iberian Peninsula, we performed wavelet analysis on our SST and [n-alk] records (Figs. 6, 7). Results reveal a 74-year periodicity for SST and precipitation on the west coast mainly before 1300 CE and on the south coast after 1580 CE. In addition, longer-period processes (100–180 years) are found throughout the three SST records and before 1200 CE in the precipitation stack (256 years). If our wavelet results are interpreted in the light of the above-presented information, multi-decadal variability in the North Atlantic dynamics associated with the Atlantic and Arctic Ocean exchange have an important impact on SST and pre-cipitation over the Atlantic sector of the Iberian Peninsula, mainly between 900 and 1200 CE in the north and after 1580 CE in the Algarve.
However, to explain the occurrence of big storms clustered in the early MCA on the northwestern Iberian Peninsula, the modern path of westerly winds under NAO-positive condi-tions would have to be positioned southward of 41◦N, a shift
that could have been caused by an increase in midlatitude blocking anticyclones.
We must consider that (1) SCAND is related to ma-jor blocking anticyclones over Scandinavia and has a posi-tive mode associated with above-average precipitation across southern Europe (Comas-Bru and McDermott, 2014; Jerez and Trigo, 2013), (2) the negative relation observed be-tween NAO and precipitation in winter and the EA and SCAND positive relation to winter precipitation in the north-ern Iberian Peninsula, and (3) the slight positive relation of SCAND with precipitation in the north but with an impor-tant negative effect on temperature in the southern Iberian Peninsula in summer (Hernández et al., 2015). One possible explanation for the observed strong precipitation in the north and lower SST in the Algarve during the early MCA may be the effect of a positive SCAND (Fig. 5).
In summary, the interplay between North Atlantic multi-decadal variability associated with the Atlantic and Arctic Ocean exchange and the positive modes of the NAO, EA and SCAND are inferred to explain extreme precipitation
associ-Stack Algarve Northern stack 8 0.5 0.125 64 128 256 512 64 128 256 512 64 128 256 4 1 0.25 16 1 0.062 (a) (b) (c) Age CE (yr) Period (yr) Period (yr) Period (yr) 2
Figure 6.The continuous wavelet power spectrum of the SST stack (a); the north SST stack (b); and the Algarve SST record (c). The thick black contour designates the 95 % confidence level, and the lighter shaded area represents the cone of influence (COI) where edge effects might distort the results.
ated with warm winters and cool summers observed in the Iberian Peninsula during the early MCA. By contrast, the cold stormy winters and warm summers of the late MCA are attributed to a shift in the SCAND to a negative mode.
5.2.2 The warming of the Industrial Era: atmospheric forcing and oceanographic circulation changes The transition to the Industrial Era starts at 1750–1850 CE with an increase in SSTs to values similar to those detected prior to 1300 CE in all but the Porto record (Figs. 2a, 5) (Abrantes et al., 2011). The same warming is detectable in all the AP pollen records (Fig. 4b), a pattern that coincides with the atmospheric temperature rise detected in NE Spain, Eu-rope and the Northern Hemisphere (Luterbacher et al., 2016; Martín-Chivelet et al., 2011; Moberg et al., 2005) (Fig. 2d, e, f).
In contrast the SST stack anomaly curve shows a smooth signal when compared to the SST data during the same time frame (Fig. 2a, b). Indeed, the Porto and Algarve records show opposite SST patterns that cancel out and result in a leveled SST in the stack (Figs. 2a, 2b, 5). Superimposed on the 20th-century trend are decadal-scale oscillations of un-usually large amplitude, but an inverse signal is detected for SST and river input in the Algarve (Figs. 2a, 5). Of partic-ular note is the second rise of SST by the mid-20th century (±1970) (Fig. 2a), which coincides with the highest global
Stack Algarve Northern stack 16 1 0.062 64 128 256 512 64 128 256 512 64 128 256 16 1 0.062 16 1 0.062 Age CE (yr) Period (yr) Period (yr) Period (yr) (a) (b) (c)
Figure 7.The continuous wavelet power spectrum of the [n-alk] stack record (a); the north [n-alk] stack (b) and the Algarve [n-alk] record (c). The thick black contour designates the 95 % confidence level, and the lighter shaded area represents the cone of influence (COI) where edge effects might distort the results.
temperatures of the last 1400 years (Ahmed et al., 2013) and agrees with a second warming phase in the western Mediter-ranean (Lionello et al., 2006).
Zampieri et al. (2016) proposed that the rapid warming periods of the Northern Hemisphere, including the last one in the 1990s, are mainly modulated by shifts in the AMO from negative (cold) to positive (warm) phases. A close look at the AMO index records of Gray et al. (2004) and Mann et al. (2010) (Fig. 2h) reveals that both warming steps (1850 and 1970 CE) do indeed occur during warming transitions in the AMO index, supporting the notion of a stronger influence of the North Atlantic SST pattern on southern Iberian climate as found for the central–western Mediterranean Sea (Cisneros et al., 2016).
In the Algarve, the highest SSTs are likely to reflect the warm inner-shelf counter current associated with large-scale northerly winds during the upwelling season (Garel et al., 2016), which in turn are known to have registered a substantial intensification during the peak summer months (July to September) in the last 50 years in SW Iberia (Rel-vas et al., 2009). Furthermore, the occurrence of periods of strong precipitation when SST is low appears to be re-lated to the change from a negative mode of the EA between 1900 and 1970 to a positive EA after 1970, while NAO and SCAND remain positive (Fig. 5; NOAA historical archive and indices – http://www.cpc.ncep.noaa.gov/data/teledoc/
telecontents.shtml; and http://www.cpc.ncep.noaa.gov/data/ teledoc/telecontents.shtml)
In summary, the mid-20th-century rise in SST in the Al-garve emerges as a regional response to the unequivocal warming of the global ocean since the 1960s (IPCC, 2013b). The reverse trend registered at the Porto site compared to the southern records clearly demonstrates the regional differ-ences that are likely to result from global warming via the complexities of the regional ocean dynamics (Seidov et al., 2017).
Considering the high relevance of such environmental changes to ecosystem organization and sustainability, a more in-depth discussion of its effect on the regional scale is nec-essary.
6 Conclusions
The combination of SST and terrestrial input or river dis-charge records from five sites distributed along the Iberian Margin (36 to 42◦N) captures the spatial distribution of temperature as well as continental precipitation for the last 2000 years on different timescales. Furthermore, the new re-gional stacks for SST and [n-alk] provide a meaningful form to understand the role of global and hemispheric vs. regional variability.
Orbital-scale summer insolation imposes long-term cool-ing from 0 CE to the beginncool-ing of the 20th century, at all lati-tudes with maximum amplitude at the southern sites. Century and decadal-scale climate changes follow the overall climatic patterns of the extratropical Northern Hemisphere and Eu-rope. The RP and the DA climate records are explained by the mechanisms proposed by Sánchez-Lopez et al. (2015). The MCA shows two climate phases: the early MCA (900– 1100 CE) with warm winters, cool summers and extreme flooding implies a link between AMO and a high-pressure blocking system over northwestern Europe (positive-like mode of the SCAND) as well as NAO and EA on a positive phase; the late MCA (1200–1300 CE) cold stormy winters and warm summers suggest a shift in SCAND to a negative mode
The LIA is marked by the coldest SSTs and frequent but not extreme storms attributed to a dominant negative NAO and EA modes. The Industrial Era starts by 1800 CE and is marked with an SST rise in consonance with increasing in-fluence from the internal North Atlantic ocean variability on the Atlantic Iberian Peninsula climate. A second increase in SST at ±1970 CE is particularly marked at the Algarve site as a regional imprint of the global warming impact previ-ously simulated for southern Iberia.
Data availability. Primary data for the new sed-imentary sequences are archived in PANGEA (https://doi.org/10.1594/PANGAEA.882269).
The Supplement related to this article is available online at https://doi.org/10.5194/cp-13-1901-2017-supplement.
Author contributions. FA: PI of the various projects that funded all the data combined in this paper; she had the idea and wrote the paper. TR: responsible for the biomarker analysis in all cores. MR: statistical data analysis. FN: responsible for the pollen interpretation and age models of DIVA and POPEI. ES: data from GeoB11033-1 core. DO: pollen analysis of the DIVA core. SD: pollen analysis for the Tagus site D13882 and POPEI core. AC: age model for core GeoB11033-1. PO processed the satellite-derived and OISST data. TD provided the Algarve core (POPEI). MMH participated in the DIVA cruise.
Competing interests. The authors declare that they have no con-flict of interest.
Acknowledgements. The authors express their gratitude to the captain, crew and participants of the cruises Discovery 249, Po-seidonPALEO I, RV Poseidon 342 – Galiomar and B/O Mytilus DIVA09 for their contribution during the retrieval of the various cores used in this study. Thanks are due in particular to Guil-hermo F. Pedraz and the Departamento de Geociencias Marinas y Ordenación del Territorio (Universidade de Vigo) for allowing the recovery of the DIVA core on their DIVA09 cruise. Special ac-knowledgments are due to the anonymous referees of previous ver-sions of this paper, who greatly contributed to its improvement.
Funding was provided by the projects INGMAR (FCT ARIPIPI Program – Support for State Labs De-velopment), HOLSMEER (EVK2-CT-2000-00060), CLIMHOL (PTDC/AAC-CLI/100157/2008), MIÑO-MINHO (0234_NATURA_MM_1_E), POPEI (PDCT/MAR/55618/2004), CALIBERIA (PTDC/MAR/102045/2008, national funds from FCT – Foundation for Science and Technology and COMPETE/FEDER-FCOMP-01-0124-FEDER-010599), CIIMAR (20132017 CIMAR) and CCMAR (Associated Lab PEstC/MAR/LA0015/2013 and UID/Multi/04326/2013). Funding also came from fellowships to Filipa Naughton (SFRH/BPD/36615/2007), Teresa Ro-drigues (SFRH/BPD/66025/2009) and Emília Salgueiro (Ref. SFRH/BPD/26525/2006 & SFRH/BPD/111433/2015). Marta Rufino was funded by contrato ciência 2007 and by a post-doctoral grant of the IPMA, within the EU project SAFI (FP7-SPACE-2013-1, grant agreement no. 607155). Finally, we thank Apolonia Inês, Daniel Ferreira, Cremilde Monteiro for their help and support with the laboratory analysis and Zuzanna Stroynowski for revision of the English.
Edited by: David Thornalley
Reviewed by: two anonymous referees
References
Abrantes, F., Lebreiro, S., Rodrigues, T., Gil, I., Bartels-Jónsdóttir, H., Oliveira, P., Kissel, C., and Grimalt, J.
O.: Shallow-marine sediment cores record climate variabil-ity and earthquake activvariabil-ity off Lisbon (Portugal) for the last 2000 years, Quaternary Sci. Rev., 24, 2477–2494, https://doi.org/10.1016/j.quascirev.2004.04.009, 2005. 2005. Abrantes, F., Rodrigues, T., Montanari, B., Santos, C., Witt, L.,
Lopes, C., and Voelker, A. H. L.: Climate of the last millennium at the southern pole of the North Atlantic Oscillation: an inner-shelf sediment record of flooding and upwelling, Clim. Res., 48, 261–280, 2011.
Ahmed, M., Anchukaitis, K. J., Asrat, A., Borgaonkar, H. P., Braida, M., Buckley, B. M., Buntgen, U., Chase, B. M., Christie, D. A., Cook, E. R., Curran, M. A. J., Diaz, H. F., Esper, J., Fan, Z.-X., Gaire, N. P., Ge, Q., Gergis, J., Gonzalez-Rouco, J. F., Goosse, H., Grab, S. W., Graham, N., Graham, R., Grosjean, M., Hanhijarvi, S. T., Kaufman, D. S., Kiefer, T., Kimura, K., Ko-rhola, A. A., Krusic, P. J., Lara, A., Lezine, A.-M., Ljungqvist, F. C., Lorrey, A. M., Luterbacher, J., Masson-Delmotte, V., Mc-Carroll, D., McConnell, J. R., McKay, N. P., Morales, M. S., Moy, A. D., Mulvaney, R., Mundo, I. A., Nakatsuka, T., Nash, D. J., Neukom, R., Nicholson, S. E., Oerter, H., Palmer, J. G., Phipps, S. J., Prieto, M. R., Rivera, A., Sano, M., Severi, M., Shanahan, T. M., Shao, X., Shi, F., Sigl, M., Smerdon, J. E., Solomina, O. N., Steig, E. J., Stenni, B., Thamban, M., Trouet, V., Turney, C. S. M., Umer, M., van Ommen, T., Verschuren, D., Viau, A. E., Villalba, R., Vinther, B. M., von Gunten, L., Wagner, S., Wahl, E. R., Wanner, H., Werner, J. P., White, J. W. C., Yasue, K., and Zorita, E.: Continental-scale temperature vari-ability during the past two millennia, Nat. Geosci., 6, 339–346, https://doi.org/10.1038/ngeo1797, 2013.
Akima, H. and Gebhardt, A.: akima: Interpolation of Irregularly and Regularly Spaced Data, R package version 0.6-2, 2016. Álvarez, M. C., Flores, J. A., Sierro, F. J., Diz, P., Francés, G.,
Pele-jero, C., and Grimalt, J.: Millennial Surface water dynamics in the Ria de Vigo during the last 3000 years as revealed by coccol-iths and molecular biomarkers, Paleogeogr. Paleocl., 218, 1–13, 2005.
Bard, E., Raisbeck, G., Yiou, F., and Jouzel, J.: Comment on “So-lar activity during the last 1000 years inferred from radionuclide records” by Muscheler et al. (2007), Quaternary Sci. Rev., 26, 2301–2308, 2007.
Barriendos, M.: Los riesgos climáticos a través de la historia: avances en el estudio de episodios atmosféricos extraordinarios, in: Riesgos naturales, edited by: Ayala-Carcedo, F. J. and Olcina, J., Ariel, Barcelona, 2002.
Barriendos, M. and Martin-Vide, J.: Secular climatic oscillations as indicated by catastrophic floods in the Spanish Mediterranean coastland area, Climate Change, 38, 473–491, 1998.
Barriendos, M. and Rodrigo, F. S.: Study of historical flood events on Spanish rivers using documentary data, Hydrolog. Sci. J., 51, 765–783, 2006.
Benito, G. and Hudson, P.: Flood hazards: The context of fluvial Ge-omorphology, in: Geomorphological Hazards and Disaster Pre-vention, edited by: Alcántara-Ayala, I. and Goudie, A., Cam-bridge University Press 2010.
Benito, G., Sopeña, A., Sánchez-Moya, Y., Machado, M. A. J., and Pérez-González, A.: Palaeoflood record of the Tagus River (Cen-tral Spain) during the Late Pleistocene and Holocene, Quaternary Sci. Rev., 22, 1737–1756, 2003.
Benito, G., Díez-Herrero, A., and Fernández de Villalta, M.: Flood Response to Solar Activity in the Tagus Basin (Central Spain) over the Last Millennium, Climatic Change, 66, 27–28, 2004. Benito, G., Barriendos, M., Llasat, M. C., Machado, M. J., and
Thorndycraft, V. R.: Impacts on natural hazards of climatic ori-gin, A. Flood risk, in: Preliminary Evaluation of the Impacts of Climate Change in Spain, edited by: Moreno, J. M., Ministerio de Medio Ambiente, Madrid, 2005.
Bradley, R. S. and Jones, P. D.: Little Ice Age’ summer temperature variations: their nature and relevance to recent global warming trends, Holocene, 3, 367–376, 1993.
Buckley, M. W. and Marshall, J.: Observations, inferences, and mechanisms of the Atlantic Meridional Overturning Circulation: A review, Rev. Geophys., 54, 5–63, 2016.
Büntgen, U., Tegel, W., Nicolussi, K., McCormick, M., Frank, D., Trouet, V., Kaplan, J. O., Herzig, F., Heussner, K.-U., Wanner, H., Luterbacher, J., and Esper, J.: 2500 Years of European Cli-mate Variability and Human Susceptibility, Science, 331, 578– 582, 2011.
Cabrita, A. N.: A Cheia Grande no Guadiana, 7 de Dezembro de 1876, in: Eventos Meteorológicos, Estremoz, 2007.
Calvert, S. E. and Pedersen, T. F.: Chapter Fourteen Elemental Proxies for Palaeoclimatic and Palaeoceanographic Variability in Marine Sediments: Interpretation and Application, in: Develop-ments in Marine Geology, edited by: Claude, H. M. and Anne De, V., Elsevier, 2007.
Cardeira, S., Rita, F., Relvas, P., and Cravo, A.: Chlorophyll a and chemical signatures during an upwelling event off the South Por-tuguese coast (SW Iberia), Cont. Shelf Res., 52, 133–149, 2013. Cisneros, M., Cacho, I., Frigola, J., Canals, M., Masqué, P., Mar-trat, B., Casado, M., Grimalt, J. O., Pena, L. D., Margaritelli, G., and Lirer, F.: Sea surface temperature variability in the central-western Mediterranean Sea during the last 2700 years: a multi-proxy and multi-record approach, Clim. Past, 12, 849–869, https://doi.org/10.5194/cp-12-849-2016, 2016.
Climate, E.: ESPON CLIMATE – Climate Change and Territorial Effects on Regions and Local Economies in Europe, Applied Re-search 2013/1/4, Draft Final Report Version 25/2/2011, TU Dort-mund University, Germany, 2011.
Comas-Bru, L. and McDermott, F.: Impacts of the EA and SCA patterns on the European twentieth century NAO – winter climate relationship, Q. J. Roy. Meteor. Soc., 140, 354–363, 2014. Cook, E., D’Arrigo R. D., and ME, M.: A well-verified,
multi-proxy reconstruction of the winter North Atlantic Oscillation in-dex since A.D. 400, J. Clim., 15, 1754–1764, 2002.
Cook, E. R., Esper, J., and D’Arrigo, R. D.: Extra-tropical North-ern Hemisphere land temperature variability over the past 1000 years, Quaternary Sci. Rev., 23, 2063–2074, 2004.
Crowley, J. and Unterman, M. B.: Technical details concern-ing development of a 1200-yr proxy index for global volcan-ism, Crowley AOD-Reff, Earth Syst. Sci. Data, 5, 187–197, https://doi.org/10.5194/essd-5-187-2013, 2013.
Cunningham, L. K., Austin, W. E. N., Knudsen, K. L., Eiríksson, J., Scourse, J. D., Wanamaker, A. D., Butler, P. G., Cage, A. G., Richter, T., Husum, K., Hald, M., Andersson, C., Zorita, E., Lin-derholm, H. W., Gunnarson, B. E., Sicre, M.-A., Sejrup, H. P., Jiang, H., and Wilson, R. J. S.: Reconstructions of surface ocean conditions from the northeast Atlantic and Nordic seas during the last millennium, Holocene, 23, 921–935, 2013.
Desprat, S., Sánchez Goñi, M. A. F., and Loutre, M.-F.: Reveal-ing climatic variability of the last three millennia in northwest-ern Iberia using pollen influx data, Earth Planet. Sc. Lett., 213, 63–78, 2003.
Diz, P., Francés, G., Pelejero, C., Grimalt, J. O., and Vilas, F.: The last 3000 years in the Ría de Vigo (NW Iberian Margin): climatic and hydrographic signals, Holocene, 12, 459–468, 2002. Eglinton, G. and Hamilton, R. J.: Leaf epicuticular waxes, Science,
156, 1322–1335, 1967.
Eglinton, G., Bradshaw, S. A., Rosell, A., Sarnthein, M., Pflaumann, U., and Tiedemann, R.: Molecular record of secular sea surface temperature changes on 100-year timescales for glacial termina-tions I, II and IV, Nature, 356, 423–426, 1992.
Esper, J., Cook, E. R., and Schweingruber, F. H.: Low-Frequency Signals in Long Tre-Ring Chronologies for Reconstructing Past Temperature, Science, 295, 2250–2253, 2002.
Fernández-Donado, L., González-Rouco, J. F., Raible, C. C., Am-mann, C. M., Barriopedro, D., García-Bustamante, E., Jungclaus, J. H., Lorenz, S. J., Luterbacher, J., Phipps, S. J., Servonnat, J., Swingedouw, D., Tett, S. F. B., Wagner, S., Yiou, P., and Zorita, E.: Large-scale temperature response to external forcing in simu-lations and reconstructions of the last millennium, Clim. Past, 9, 393–421, https://doi.org/10.5194/cp-9-393-2013, 2013. Fiúza, A.: The Portuguese Coastal Upwelling, Lisbon, 45–71, 1982. Fiúza, A.: Upwelling patterns off Portugal, in: Coastal Upwelling its sediment record, edited by: Suess, E. and Thiede, J., Plenum, New York, 1983.
Fiúza, A. and Macedo, M. E.: Climatological space and time vari-ation of the Portuguese coastal upwelling, Oceanol. Acta, 5, 31– 40, 1982.
Fiúza, A. A. and Frouin, T. B. R.: Observations of a Warm Oceanic Current Flowing Northward along the Coasts Of Potugal and Spain During November–December 1983, Eos Trans. AGU, 67, 867–1302, https://doi.org/10.1029/EO067i044p00867, 1986. Frankcombe, L. M., von der Heydt, A., and Dijkstra, H. A.: North
Atlantic Multidecadal Climate Variability: An Investigation of Dominant Time Scales and Processes, J. Clim., 23, 3616–3638, 2010.
Garel, E., Laiz, I., Drago, T., and Relvas, P.: Characterisation of coastal counter-currents on the inner shelf of the Gulf of Cadiz, J. Marine Syst., 155, 19–34, 2016.
Giorgi, F.: Climate change hot-spots, Geophys. Res. Lett., 33, L08707, https://doi.org/10.1029/2006GL025734, 2006. Gouhier, T. C., Grinstead, A., and Simko, V.: biwavelet:
Con-duct univariate and bivariate wavelet analyses (Version 0.20.10), 2016.
Gray, S. T., Graumlich, L. J., Betancourt, J. L., and Pederson, G. T.: A tree-ring based reconstruction of the Atlantic Multidecadal Oscillation since 1567 A.D., Geophys. Res. Lett., 31, L12205, https://doi.org/10.11029/12004GL019932, 2004.
Guiot, J. and Cramer, W.: Climate change: The 2015 Paris Agree-ment thresholds and Mediterranean basin ecosystems, Science, 354, 465–468, 2016.
Hegerl, G. C., Crowley, T. J., Hyde, W. T., and Frame, D. J.: Climate sensitivity constrained by temperature reconstructions over the past seven centuries, Nature, 440, 1029–1032, 2006.
Hernández, A., Trigo, R. M., Pla-Rabes, S., Valero-Garcés, B. L., Jerez, S., Rico-Herrero, M., Vega, J. C., Jambrina-Enríquez, M., and Giralt, S.: Sensitivity of two Iberian lakes to North Atlantic
atmospheric circulation modes, Clim. Dynam., 45, 3403–3417, 2015.
Hurrell, J.: Decadal trends in the North Atlantic Oscillation – re-gional temperatures and precipitation, Science, 269, 676–679, 1995.
Iglesias, I., Avilez-Valente, P., Couvelard, X., and Caldeira, R.: Geostrophic influence in the River Douro plume: a climatolog-ical study, V Conferência Nacional de Mecânica dos Fluidos, Termodinâmica e Energia MEFTE 2014, 11–12 Setembro 2014, Porto, Portugal APMTAC, 2014.
IPCC: Annex II: Climate System Scenario Tables In: Climate Change 2013: The Physical Science Basis, Contribution of Working Group I to the Fifth Assessment Report of the Inter-governmental Panel on Climate Change, edited by: Stocker, T. F., Qin, D., Plattner, G.-K., Tignor, M., Allen, S. K., Boschung, J., Nauels, A., Xia, Y., Bex, V., and Midgley, P. M., Cambridge University Press, Cambridge, United Kingdom and New York, NY, USA, 2013a.
IPCC: Climate Change 2013: The Physical Science Basis. Contri-bution of Working Group I to the Fifth Assessment Report of the Intergovernmental Panel on Climate Change, Cambridge Uni-versity Press, Cambridge, United Kingdom and New York, NY, USA, 2013b.
Jambrina-Enríquez, M., Sachse, D., and Valero-Garcés, B. L.: A deglaciation and Holocene biomarker-based reconstruction of climate and environmental variability in NW Iberian Peninsula: the Sanabria Lake sequence, J. Paleolimnol., 56, 49–66, 2016. Jerez, S. and Trigo, R. M.: Time-scale and extent at which
large-scale circulation modes determine the wind and solar poten-tial in the Iberian Peninsula, Enviro. Res. Lett., 8, 044035, https://doi.org/10.1088/1748-9326/8/4/044035, 2013.
Jones, P. D., Osborn, T. J., and Briffa, K. R.: The Evolution of Cli-mate Over the Last Millenium, Science, 292, 662–667, 2001. Lebreiro, S. M., Francés, G., Abrantes, F. F. G., Diz, P.,
Bartels-Jónsdóttir, H. B., Stroynowski, Z. N., Gil, I. M., Pena, L. D., Rodrigues, T., Jones, P. D., Nombela, M. A., Alejo, I., Briffa, K. R., Harris, I., and Grimalt, J. O.: Climate change and coastal hydrographic response along the Atlantic Iberian margin (Tagus Prodelta and Muros Ría) during the last two millennia, Holocene, 16, 1003–1015, 2006.
Lionello, P., Malanott-Rizzoli, R., Boscolo, R., Alpert, P., Artale, V., Li, L., Luterbacher, J., May, W., Trigo, R., Tsimplis, M., Ulbrich, U., and Xoplaki, E. T.: The Mediterranean climate: An overview of the main characteristics and issues, in: Mediterranean Climate Variability (MedClivar), Elsevier, Amsterdam, 2006.
Lisiecki, L. E. and Raymo, M. E.: A Pliocene-Pleistocene stack of 57 globally distributed benthic δ18O records, Paleoceanography, 20, https://doi.org/10.1029/2004PA001071, 2005.
Luterbacher, J., Xoplaki, E., Dietrich, D., Jones, P. D., Davies, T. D., Portis, D., Gonzalez-Rouco, J. F., von Storch, H., Gyalistras, D., Casty, C., and Wanner, H.: Extending North Atlantic Oscillation Reconstructions Back to 1500, Atmos. Sci. Lett., 2, 114–124, 2002.
Luterbacher, J., Dietrich, D., Xoplaki, E., Grosjean, M., and Wan-ner, H.: European Seasonal and Annual Temperature Variabil-ity, Trends, and Extremes Since 1500, Science, 303, 1499–1503, https://doi.org/10.1126/science.1093877, 2004.
Luterbacher, J., Werner, J. P., Smerdon, J. E., Fernández-Donado, L., González-Rouco, F. J., Barriopedro, D., Ljungqvist, F. C.,


![Figure 5. SST and river-input ([n-alk] stacks for NW Iberia (Galiza, Minho and Porto) and continental T and humidity conditions extracted from arboreal pollen (% AP) at Minho are compared to the Algarve SST and [n-alk] anomalies (for easier comparison) and](https://thumb-eu.123doks.com/thumbv2/123dok_br/18927637.938196/12.918.227.692.114.580/continental-humidity-conditions-extracted-arboreal-compared-anomalies-comparison.webp)