SCRS/2017/049 Collect. Vol. Sci. Pap. ICCAT, 74(4): 1579-1600 (2017)
STANDARDIZED CPUE AND SIZE DISTRIBUTION OF THE SHORTFIN MAKO
SHARK IN THE PORTUGUESE PELAGIC
LONGLINE FISHERY IN THE ATLANTIC
Rui Coelho1*, Daniela Rosa1 & Pedro G. Lino1
SUMMARY
This document provides fishery indicators for the shortfin mako shark captured by the Portuguese pelagic longline fishery in the Atlantic (standardized CPUEs and size distribution). The analysis was based on data collected from fishery observers, port sampling and skippers logbooks (self sampling), between 1995 and 2015. The mean sizes were compared between years, seasons (quarters), stocks (north and south) and sampling areas. The CPUEs were analyzed for the North Atlantic and compared between years, and were standardized with Tweedie and Delta GLM approaches. In general, there was a large variability in the nominal CPUE trends in the North Atlantic, and the final standardized series was flatter than the nominal. For the size distribution there were no major trends in the time series, with the sizes tending to be larger in the South Atlantic. The data presented in this document can be considered for use in the upcoming 2017 shortfin mako stock assessment, specifically the standardized CPUE for the North Atlantic and the size distribution for both hemispheres.
RÉSUMÉ
Le présent document fournit des indicateurs de la pêche du requin-taupe bleu capturé par la pêcherie palangrière pélagique portugaise opérant dans l'Atlantique (CPUE standardisées et distribution des tailles). L'analyse se basait sur les données collectées par les observateurs des pêcheries, l’échantillonnage au port et les carnets de pêche des capitaines (auto-échantillonnage), entre 1995 et 2015. Les tailles moyennes ont été comparée entre les années, saisons (trimestres), stocks (Nord et Sud) et les zones d'échantillonnage. Les CPUE ont été analysées pour l’Atlantique Nord et comparées par années et ont ensuite été standardisées au moyen de méthodes tweedie et delta GLM. En général, il y a eu une grande variabilité dans les tendances de la CPUE nominale dans l'Atlantique Nord, les séries standardisées finales étant plus plates que les nominales. Pour la distribution des tailles, aucune forte tendance ne s'est dégagée dans les séries temporelles, les tailles ayant tendance à être plus grandes dans l'Atlantique Sud. On peut envisager l'utilisation des données présentées dans ce document dans la prochaine évaluation du stock de requin-taupe bleu de 2017, plus précisément la CPUE standardisée pour l’Atlantique Nord et la distribution des tailles pour les deux hémisphères.
RESUMEN
En este documento se presentan los indicadores pesqueros para el marrajo dientuso capturado por la pesquería de palangre pelágico portuguesa en el Atlántico (CPUE estandarizadas y distribución de tallas). El análisis se basó en datos recopilados por los observadores pesqueros, en los muestreos en puerto y en los cuadernos de pesca de los patrones (automuestreo), recopilados entre 1995 y 2015. La talla media se comparó entre años, temporadas (trimestres), stocks (norte y sur) y zonas de muestreo. Se analizaron las CPUE para el Atlántico norte y se compararon entre los años, estandarizándose con enfoques Tweedie y Delta GLM. En general, se observó una gran variabilidad en las tendencias de la CPUE nominal en el Atlántico norte, y las series estandarizadas finales eran más planas que las nominales. Para la distribución por tallas no había tendencias destacadas en la serie temporal, y las tallas tendían a ser mayores en el Atlántico sur. Los datos presentados en este documento pueden ser considerados para su uso en la próxima evaluación de marrajo dientuso de 2017, específicamente la CPUE estandarizada para el Atlántico norte y la distribución por tallas para ambos hemisferios.
KEYWORDS: Bycatch, fishery indicators, nominal CPUE, pelagic longline fishery, sharks, size distribution
1. Introduction
Pelagic sharks are commonly by-catch in pelagic longline fisheries (e.g., Mejuto et al., 2009; Coelho et al., 2012a; Santos et al., 2013a). The Portuguese pelagic longline fishery started in the late 1970’s. In the North Atlantic area the fishery started to develop mainly after 1986, while in the South Atlantic it gained importance after 1989 (Santos et al., 2002). The Portuguese fleet usually deploys a pelagic drift longline for targeting mainly swordfish (Xiphias gladius). Still, this is a multi-species fishery, where some other bony fishes as well as pelagic sharks (mainly blue shark Prionace glauca, and shortfin mako Isurus oxyrinchus) are frequently captured. In recent years, mostly as a consequence of changes on the market which increased the demand and value of shark products, there has been higher catches of pelagic sharks in the ICCAT Convention area.
These facts have raised wide-world concern and ICCAT has adopted a number of Recommendations and Resolutions regarding sharks. Moreover, the SCRS Shark working group has consistently been carrying out stock assessments for the main shark species, and has been addressing the need for improved data and biological information required to produce better assessments for the different shark species that are of concern to ICCAT. The ICCAT SCRS is carrying a stock assessment of shortfin mako shark in 2017. The first standardized CPUE series for the shortfin mako from the Portuguese fleet was presented to the SCRS in 2012 (Coelho et al., 2012b) to be used in that assessment. Following that previous work and the preliminary information shown in 2016 in preparation to the 2017 assessment (Coelho et al., 2016), this paper now presents updated indicators including the standardized CPUE series to be considered for use in the 2017 assessment.
2. Materials and methods
2.1. Data collection
The data used for this study was collected by IPMA (Portuguese Institute for the Ocean and Atmosphere) from several different sources, namely 1) fishery observers onboard Portuguese pelagic longline vessels, 2) landings on Portuguese ports, and 3) skippers logbooks (self sampling) voluntarily provided to IPMA.
The fishery observer data is usually the most complete and detailed, apart from set data there is also the collection of individual information on the catch sizes and sex for all specimens. During the landings, detailed information is also collected, although due to some procedure logistics sometimes it is difficult to collect individual size and/or sex data for the major species caught (e.g. blue shark). The skippers’ logbooks have the data recorded and reported voluntarily by the vessel skippers, and usually also have detailed information regarding the catch, effort and location of the fishing sets. For some species, including the major fishery species (i.e. swordfish, tunas and sharks as blue and shortfin mako) detailed individual specimen information is usually recorded, including individual specimen sizes or weights.
2.2. Data analysis
The data analyzed in this work refers to data from the fishery between 1995 and 2015 for the Atlantic Ocean. The CPUE standardization analysis was restricted to the North Atlantic (separated by the 5ºN, as used in the ICCAT shark stocks delimitation), as most of the effort and data from the fishery comes from that area. Data from a total of 1,846 trips or sub-trip (consecutive sets in the same trip, area and month) is available for the entire Atlantic, and from that, a subset of 1,615 trips of sub-trips exclusively from the North Atlantic were used in the analysis (Table 1). The coverage of the sample used in this study, in terms of the shortfin mako shark total catch, varied between minimums of 1.2% and maximums of 9.3% (Table 1).
The CPUEs were calculated as Kg (live weight) / 1000 hooks, and were mapped in 5*5 degrees to provide an overview of the catch locations of shortfin mako by the fleet. The yearly nominal CPUEs were calculated and the time series plotted.
For the CPUE standardization, the data from the first years of the series (1995-1998) was excluded from the model runs due to low number of observations and effort covered. The final CPUE time series was therefore analyzed for the period 1999 to 2015. For the CPUE standardization, the response variable considered was CPUE measured as biomass of live fish (kg) per 1000 hooks deployed. The standardized CPUE series was estimated with Generalized Linear Models (GLM).
As the shortfin mako shark is a bycatch from the fishery, there were some trips or sub-trips with zero catches that results in a response variable of CPUE=0. As these zeros can cause mathematical problems for fitting the models, two alternative approaches were chosen, specifically a tweedie model and the Delta lognormal approach (following the models used in the previous SMA assessment, as described in Coelho et al., 2012b).
With the delta-method two separate models are estimated. For our study the first model assumed a binomial error distribution with a logit link function, and was used to model the proportion of fishing sets with positive catches. For this model, the binomial response variable was coded with 1 = set with positive catches of SMA and 0 = set with zero catches of SMA. The second model was used to estimate the expected CPUE of the positive sets of SMA, assuming that those positive sets follow a normal error distribution after a log-transformation of the nominal CPUE data.
The tweedie model uses a different approach in which only one model is fitted to the data, with that model handling this mixture of continuous positive values with a discrete mass of zeros. The tweedie distribution is part of the exponential family of distributions, and is defined by a mean (μ) and a variance (φμp), in which φ is the dispersion parameter and p is an index parameter. In this study, the index parameter (p-index) was calculated by maximum likelihood estimation (MLE).
The covariates considered and tested in the models were: • Year: analyzed between 1999 and 2015;
• Quarter of the year: 4 categories: 1 = January to March, 2 = April to June, 3 = July to September, 4 = October to December;
• Area: using the areas represented in Figure 1 and considering the aggregations mentioned below; • Targeting: based on the SWO/SWO+BSH ratio of captures; see explanations below.
Interactions were considered and tested in the analysis but not used in the final models. Specifically, interactions not involving the year factor were considered as fixed factors in the GLM, while interactions involving the year factor were considered as random variables within GLMMs. However, due to the lack of sufficient data in the various levels of some covariates considered for the interactions, some of the models involving random effects had convergence problems. As such, the final models used in the standardization process only involved simple effects and interactions without the year effect.
In terms of targeting effects, the differences in fishing strategy reflect the increased economic importance of sharks among the Portuguese pelagic longline fleets which traditionally targeted swordfish almost exclusively. These changes in target species were incorporated into the model by a proxy based on the ratio of the swordfish retained catch and the combined swordfish + blue shark retained catches by trip (or sub-trip). This ratio is in general considered a good proxy indicator of target criteria more clearly directed at swordfish vs. a more diffuse fishing strategy aimed at the two main species (SWO and BSH). Moreover, it has been consistently applied both to the Portuguese and other fleets that have a similar method of operation, such as the Spanish fleet, with applications both to the Atlantic and the Indian Ocean longline fisheries (e.g., Ramos-Cartelle et al., 2011; Mejuto et al., 2012; Santos et al., 2013b; Coelho et al., 2014). This ratio factor used as proxy for targeting was calculated by trip or sub-trips and categorized into ten levels using the 0.1 quantiles.
Other approaches to include targeting effects into the CPUE standardization process for the Portuguese pelagic longline fishery have been tested in the past. Coelho et al. (2015a) tested a cluster analysis based on the catch composition of the 10 major species or species-groups, in an analysis as suggested by He et al. (1997) and that has been successfully applied for CPUE standardization of other fleets (e.g. Wang and Nishida, 2014, for the Taiwanese fleet in the Indian Ocean). Coelho et al. (2015a) demonstrated that for the Portuguese pelagic longline fleet, given that the catches are largely dominated by the two major species, specifically swordfish and the blue shark, the use of ratios or clusters resulted in very similar results.
The catches were assigned to fishing areas according to Figure 1, which were defined by Ortiz et al. (2010) for swordfish and used before for other CPUE standardizations of the Portuguese fleet, as Santos et al. (2013b) and Coelho et al. (2015a) for swordfish and blue shark, respectively. In this specific study some of these areas were aggregated into larger zones due to the low number of trips or sub-trips with positive shortfin mako catches in some of the areas. Even though those areas were defined originally for swordfish and tested for blue shark, they reflect the activity of the fleet that is mainly catching those two species.
The significance of the explanatory variables in the CPUE standardization models was assessed with likelihood ratio tests comparing each univariate model to the null model (considering a significance level of 5%), and by analyzing the deviance explained by each covariate. Goodness-of-fit and model comparison was carried out with the Akaike Information Criteria (AIC) and the pseudo coefficient of determination (R2). Model validation was carried out with a residual analysis. The final estimated indexes of abundance were calculated by least square means (LSMeans or Marginal Means), that for comparison purposes were scaled by the mean standardized CPUE in the time series.
In terms of sizes, data from both hemispheres was analyzed. The size data was analyzed with exploratory size frequency plots and time series of the mean sizes in each stock. Size data was tested for normality with Kolmogorov-Smirnov tests with Lilliefors correction (Lilliefors, 1967) and for homogeneity of variances with Levene tests (Levene, 1960). Catch sizes were compared between years, quarters, sampling areas and stocks using non-parametric k-sample permutation tests (Manly, 2007) given that the data was not normally distributed and the variances were heterogeneous.
Data analysis for this paper was carried out in the R language for statistical computing 3.2.0 (R Core Team, 2015). The plots were designed using library "ggplot2" (Wickham, 2009) and the maps using libraries "maps" (Richard et al., 2014), "maptools" (Bivand and Lewin-Koh, 2013), "mapplots" (Gerritsen, 2014) and "shapefiles" (Stabler, 2013). Additional libraries used in the analysis included "classInt " (Bivand, 2013), "nortest" (Gross and Ligges, 2012), "car" (Fox and Weisberg, 2011), "perm" (Fay and Shaw, 2010), "doBy" (Højsgaard et al., 2014), "tweedie" (Dunn, 2014), "statmod" (Smyth et al., 2015) and "lsmeans" (Lenth, 2015).
3. Results and Discussion
3.1. Distribution and trends in the size distribution
Size data for shortfin mako sharks was available for 17,705 specimens, with the sizes ranging between 50 and 340 cm FL, on both hemispheres.
The size distribution data was not normally distributed (Lilliefors test: D = 0.076, p-value < 0.001) and there was heterogeneity of variances between sampling areas (Levene test: F = 103.5; df = 4; p-value < 0.001), stocks (Levene test: F = 443.8; df = 1; p-value < 0.001) and quarters of the year (Levene test: F = 158.1; df = 3; p-value < 0.001). Significant differences in the size distributions were detected between years (Permutation test: chi2 = 3072.4; df = 17; p-value < 0.001), sampling areas (Permutation test: chi2 = 1377.3; df = 4; p-value < 0.001), stocks (Permutation test: chi2 = 513.1; df = 1; p-value < 0.001), and quarters of the year (Permutation test: chi2 = 375.5; df = 3 p-value < 0.001).
Mapping the catch by size classes seems to indicate that the smaller specimens occur mostly in more temperate waters of both the north and south Atlantic, while the larger specimens are more captured in tropical and equatorial regions (Figure 2). This is similar to the patterns found for other pelagic sharks, as for example the blue shark (Coelho et al., 2015b), but contrary to other pelagic species as for example the bigeye thresher (Fernandez-Carvalho et al., 2015).
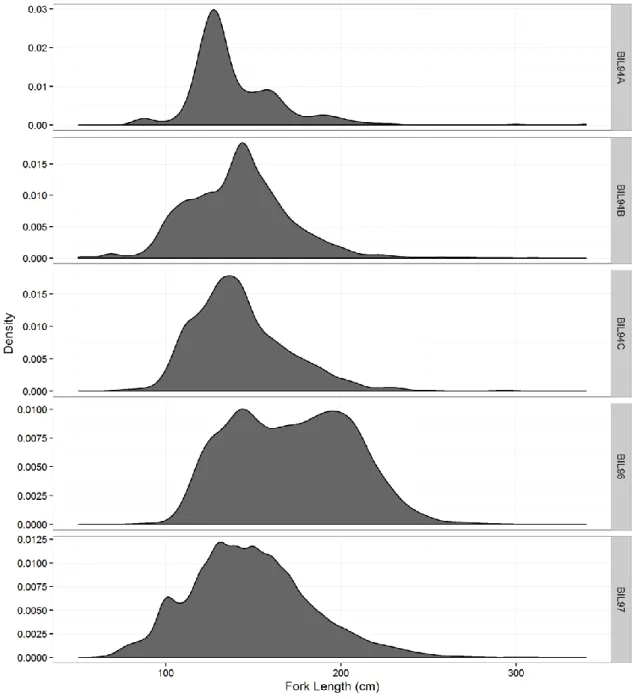
There was some variability observed in the size frequency distribution of shortfin mako sharks in the Atlantic regions. In some areas such as the BIL94C the size distribution was mostly unimodal, while in other areas such as BIL96 there was some evidence of bimodal distributions (Figure 3). This is an issue that will need further investigation in the future and a possible revision of the sampling areas, in order to define areas with more unimodal distributions of the size classes that can more easily be used in integrated stock assessment models.
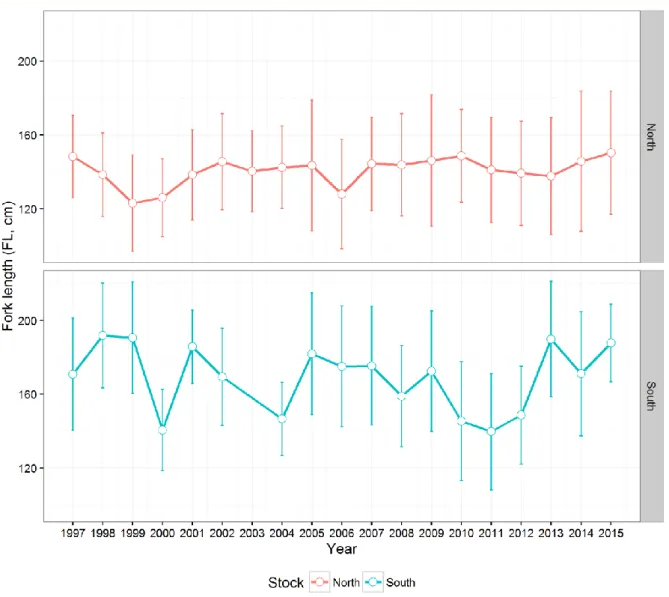
The time series of the catch at size distribution for the Portuguese fleet was mostly stable both for the north and south Atlantic stocks (Figure 4). However, in general, the variability was higher in the south Atlantic when compared to the north, and the mean sizes tended to be larger in the south (Figure 4). In terms of size frequencies distribution, there was some inter-annual variability but no evidence of any major trends towards smaller or larger sizes during the period for any of the two stocks (Figure 5).
3.2. Distribution of the catch and effort in the North Atlantic
The shortfin mako shark nominal CPUEs in the North Atlantic were mainly concentrated in temperate waters of the central north region west of the Azores islands, and also in more tropical waters of the northeast Atlantic, closer to the African continent (Figure 6). Such spatial distribution of the nominal CPUEs might be related with the species spatial and seasonal trends, but also with the spatial and seasonal dynamics of the fleet.
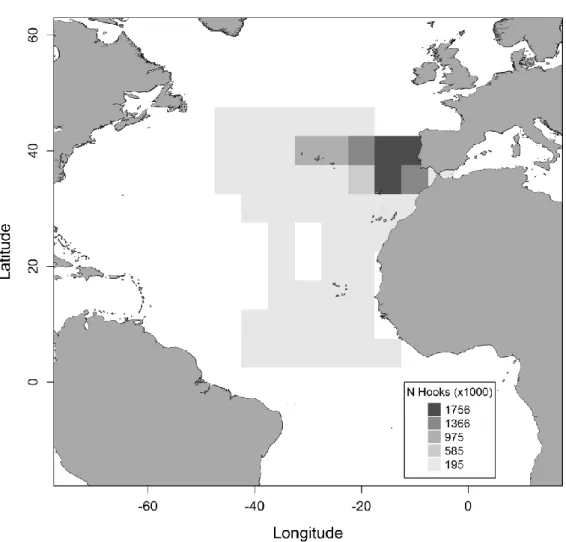
Regarding the fishery, most of the effort that was sampled took place in the temperate northeast area, as that is a major area of operation of the Portuguese pelagic longline fleet in the Atlantic (Figure 7). However, the effort is also distributed along a wide spatial distribution, including both temperate and tropical waters mainly along the eastern Atlantic (Figure 7).
3.3. CPUE data characteristics
The shortfin mako is the 2nd most captured shark species, after the blue shark. It is a bycatch of the fishery, targeting mainly swordfish, but the captures of this shark are relatively common.
Specifically, 24.7% of the trips or sub-trips considered in this study had zero shortfin mako shark catches in the North Atlantic, ranging annually from 13.0% to 36.6%. There were some noticeable trends in the proportion of zeros along the study period, with general higher proportions of zeros in the earlier years decreasing until 2007, and then higher again in 2008 and decreasing until 2012, from which the proportion of zeros increased again (Figure 8). For the nominal CPUE time series there was a general and slight overall increase in the series between 1999 and 2015 (Figure 9). There is one specific year with very high CPUEs, specifically 2007.
The nominal shortfin mako shark CPUE distribution was highly skewed to the right due to the presence of the large mass of zeros (Figure 10). Once log-transformed (positives only) the distribution became more normal shaped (Figure 10).
In terms of seasonality of the SMA CPUEs, it was noticeable that higher catch rates tended to occur in the 2nd semester, particularly between June and December, while lower catch rates occur between January and May (Figure 11).
3.4. Standardized CPUE for the North Atlantic
All the explanatory variables tested for the shortfin mako CPUE standardization were significant and contributed significantly for explaining part of the deviance (Table 2). In general, the factors that contributed most for the deviance explanation were the year, quarter, and targeting effects. The interactions in the tweedie model also contributed significantly (Table 2).
In terms of model validation, the residual analysis, including the residuals distribution along the fitted values, the QQ plots and the residuals histograms, showed that the models were in general adequate with no major outliers or trends in the residuals (Figure 12).
In terms of comparisons between the 2 model approaches tested (tweedie and Delta) there were some differences in the final series (Figure 13). In summary, the tweedie model tended to follow the nominal series while the Delta produced a flatter series, and did not seem to be so sensitive to the high peak in catches in 2007. It is not possible to truly compare those models, as the approaches are different. Even the residuals are not fully comparable as the tweedie is producing residuals for the entire series while the Delta is divided into its 2 components (binomial model for the zero/non-zeros and continuous model (log scale) for the positives). Still, the residuals for the continuous component of the Delta model seemed better distributed (Figure 12), and there were no problems identified in terms of combinations for the binomial (sufficient zeros/non-zeros on all variables). As such, for this species and in this case, we would recommend using the results of the Delta approach as the final index of abundance (Figure 14).
The final standardized shortfin mako CPUE index (kg/1000 hooks) for the Portuguese pelagic longline fishery in the North Atlantic stock area between 1999-2015 shows a general increase until the middle of the series (2006-2007) followed by a general decrease for the more recent years (Figure 14). The final standardized CPUE series suggested to be used in the 2017 shortfin mako assessment for this fleet is presented in Table 3.
5. Acknowledgments
Sampling and data collection from the Portuguese fishery were mainly obtained and funded by PNAB -
Programa Nacional de Amostragem Biologica within the scope of the EU Data Collection Framework (DCF).
The authors wish to thank the fishery observers for the onboard data collection, and the skippers for participating in the self sampling data collection program. Additional data and samples were obtained through project "MAKO-WIDE: A wide scale inter-hemispheric and inter-disciplinary study aiming the conservation of the
shortfin mako shark in the Atlantic Ocean (Ref FAPESP/19740/2014, funded by FCT and FAPESP)". Rui
Coelho is supported by an Investigador-FCT contract from the Portuguese Foundation for Science and Technology (FCT, Fundação para a Ciência e Tecnologia) supported by the EU European Social Fund and the Programa Operacional Potencial Humano (Ref: IF/00253/2014).
References
Bivand, R. 2013. classInt: choose univariate class intervals. R package version 0.1-21. http://CRAN.R-project.org/package=classInt.
Bivand, R., Lewin-Koh, N. 2013. maptools: Tools for reading and handling spatial objects. R package version 0.8-27. http://CRAN.R-project.org/package=maptools.
Coelho R., Fernandez-Carvalho J., Lino P.G. & Santos M.N. 2012a. An overview of the hooking mortality of elasmobranchs caught in a swordfish pelagic longline fishery in the Atlantic Ocean. Aquatic Living
Resources, 25: 311-319.
Coelho, R., Lino, P.G., Santos, M.N. 2012b. Standardized CPUE for the shortfin mako (Isurus oxyrinchus) caught by the Portuguese pelagic longline fishery. ICCAT SCRS/2012/072. 15pp.
Coelho, R., Santos, M.N., Lino, P.G. 2014. Blue shark catches by the Portuguese pelagic longline fleet between 1998-2013 in the Indian Ocean: Catch, effort and standardized CPUE. IOTC-2014-WPEB10-24. 32pp. Coelho, R., Santos, M.N., Lino, P.G. 2015a. Standardized CPUE of blue shark in the Portuguese pelagic longline
fleet operating in the north Atlantic. ICCAT SCRS/2015/037. 31pp.
Coelho, R., Mejuto, J., Domingo, A., Liu, K-M., Cortés, E., Yokawa, K., Hazin, F., Arocha, F., Silva, C., Mwilima, A.M., García-Cortés, B., Ramos-Cartelle, A.M., Lino, P.G., Forselledo, R., Mas, F., Ohshimo, S., Tsai, W-P-, Carvalho, F., Santos, M.N. 2015b. Distribution patterns of the blue shark
Prionace glauca in the Atlantic Ocean, from observer data of the major fishing fleets. ICCAT
SCRS/2015/039. 24pp.
Coelho, R., Rosa, D., Lino, P.G. 2016. Fishery indicators for the shortfin mako shark (Isurus oxyrinchus) caught by the Portuguese pelagic longline fishery in the Atlantic: nominal CPUEs, catch-size and at-haulback mortality. ICCAT SCRS/2016/072. 13pp.
Dunn, P.K. 2014. tweedie: Tweedie exponential family models. R package version 2.2.1.
Fay, M.P., Shaw, P.A. 2010. Exact and asymptotic weighted logrank tests for interval censored data: the interval R package. J. Stat. Softw., 36 (2): 1-34.
Fernandez-Carvalho, J., Coelho, R., Mejuto, J., Cortés, E., Domingo, A., Yokawa, K., Liu, K.M., García-Cortés, B., Forselledo, R., Ohshimo, S., Ramos-Cartelle, A.M., Tsai, W.P., Santos, M.N. 2015. Pan-Atlantic distribution patterns and reproductive biology of the bigeye thresher, Alopias superciliosus. Reviews in
Fox, J., Weisberg, S. 2011. An R Companion to Applied Regression, Second Edition. Thousand Oaks CA: Sage. Gerritsen, H. 2014. mapplots: Data Visualisation on Maps. R package version 1.5.
http://CRAN.R-project.org/package=mapplots.
Gross, J., Ligges, U. 2012. nortest: tests for normality. R package version 1.0-2. http://CRAN.R-project.org/package=nortest.
He, X., Bigelow, K.A., Boggs, C.H. 1997. Cluster analysis of longline sets and fishing strategies within the Hawaii-based fishery. Fish. Res., 31: 147-158.
Højsgaard, S., Halekoh, U., Robison-Cox, J., Wright, K., Leidi, A.A. 2014. doBy: Groupwise statistics, LSmeans, linear contrasts, utilities. R package version 4.5-13. http://CRAN.R-project.org/package=doBy. Lenth, R. 2015. lsmeans: Least-Squares Means. R package version 2.20-2.
http://CRAN.R-project.org/package=lsmeans
Levene, H. 1960. Robust tests for equality of variances. In: Olkin, I., Ghurye, S.G., Hoeffding, W., Madow, W.G., Mann, H.B. (Eds) Contributions to Probability and Statistics: Essays in Honor of Harold Hotelling. Stanford University Press, pp 278-292.
Lilliefors, H.W. 1967. On the Kolmogorov-Smirnov test for normality with mean and variance unknown. J Am
Statist Assoc, 62: 399-402.
Manly, B. 2007. Randomization Bootstrap and Monte Carlo Methods in Biology, 3rd ed. Chapman & Hall/CRC, New York.
Mejuto, J., García-Cortés, B., Ramos-Cartelle, A., Serna, J.M. 2009. Scientific estimations of by-catch landed by the Spanish surface longline fleet targeting swordfish (Xiphias gladius) in the Atlantic Ocean with special reference to the years 2005 and 2006. Collect Vol Sci Pap ICCAT, 64: 2455-2468.
Mejuto, J., García-Cortés, B., Ramos-Cartelle, A., De la Serna, J.M., González-González, I. 2012. Standardized catch rates of shortfin mako (Isurus oxyrinchus) caught by the Spanish surface longline fishery targeting swordfish in the Atlantic Ocean during the period 1990-2010. ICCAT SCRS/2012/046. 12pp. Col. Vol. Sci. Pap., ICCAT, Madrid, 69(4): 1657-1669.
Ortiz, M., Mejuto, J., Paul S., Yokawa, K., Santos M.N. 2010. An updated biomass index of abundance for north Atlantic swordfish 1963-2008. Col. Vol. Sci. Pap., ICCAT, 65(1): 171-184.
R Core Team. 2015. R: A language and environment for statistical computing. R Foundation for Statistical Computing, Vienna, Austria. URL http://www.R-project.org/.
Ramos-Cartelle, A., García-Cortés, B., Fernández-Costa, J., Mejuto, J. 2011. Standardized catch rates for the swordfish (Xiphias gladius) caught by the Spanish longline in the Indian Ocean during the period 2011-2012. IOTC-2011-WPB09-23. 19pp.
Richard, A. Becker, R.A., Wilks, A.R., Brownrigg, R., Minka, T.P. 2014. maps: Draw Geographical Maps. R package version 2.3-9. http://CRAN.R-project.org/package=maps.
Santos, M.N., Garcia, A., Pereira, J.G. 2002. A historical review of the by-catch from the Portuguese surface long-line fishery: observations on blue shark (Prionace glauca) and short-fin mako (Isurus oxyrinchus). Col.
Vol. Sci. Pap. ICCAT, 54: 1333-1340.
Santos, M.N., Coelho, R., Lino, P.G., Fernandez-Carvalho, J. 2013a. Preliminary observations on the elasmobranchs bycatch-at-size and sex-ratios on the Portuguese pelagic longline fishery in the Atlantic Ocean. Standing Committee on Research and Statistics Document, SCRS/2013/039. 17pp.
Santos, M.N., Coelho, R., Lino, P.G. 2013b. Standardized CPUE for swordfish (Xiphias gladius) caught by the Portuguese pelagic longline fishery in the North Atlantic. ICCAT SCRS/2013/104. 11pp.
Smyth, G., Hu, Y., Dunn, P., Phipson, B., Chen, Y. 2015. statmod: Statistical Modeling. R package version 1.4.21. http://CRAN.R-project.org/package=statmod.
Stabler, B. 2013. shapefiles: read and write ESRI shapefiles. R package version 0.7.
http://CRAN.R-project.org/package=shapefiles.
Wang, S-P., Nishida, T. 2014. CPUE standardization with targeting analysis for swordfish (Xiphias gladius) caught by Taiwanese longline fishery in the Indian Ocean. IOTC–2014–WPB12–22. 25pp.
Wickham, H. 2009. ggplot2: elegant graphics for data analysis. Springer New York.
Table 1. Annual shortfin mako shark catch (tones, MT) by the Portuguese pelagic longline fishery in the North Atlantic stock area (>5ºN), with a summary of the data coverage for the analysis: Catch (MT), relative percentage of the catch covered in the analysis, and effort (in sets and hooks) covered in the analysis. Only data below the dotted line was used in the CPUE standardization models.
Year Total
catch (t)
Covered in the analysis
Catch (t) % Trips /
Sub-trips Effort (sets) Effort (hooks) 1995 657.0 2.0 0.3 8 47 75,200 1996 691.0 1.9 0.3 4 52 83,200 1997 354.0 16.8 4.7 28 181 367,500 1998 307.0 16.2 5.3 42 257 494,400 1999 327.4 9.6 2.9 66 512 918,800 2000 317.5 21.0 6.6 142 928 1,418,610 2001 377.6 21.9 5.8 139 802 1,034,908 2002 414.7 31.6 7.6 92 647 783,850 2003 1,248.6 25.0 2.0 113 734 851,102 2004 398.7 37.2 9.3 125 792 876,482 2005 1,109.3 26.9 2.4 109 902 1,048,178 2006 950.6 11.0 1.2 72 464 522,917 2007 1,539.7 56.3 3.7 95 562 567,790 2008 1,033.1 34.0 3.3 92 619 640,946 2009 1,169.3 24.7 2.1 89 695 730,782 2010 1,431.9 42.7 3.0 94 783 817,542 2011 1,044.6 20.8 2.0 50 470 482,839 2012 1,022.6 19.5 1.9 69 663 712,567 2013 817.4 23.6 2.9 81 958 973,168 2014 208.6 12.4 5.9 46 489 515,191 2015 213.3 15.8 7.4 59 558 541,854
Table 2. Deviance tables of the parameters used for the shortfin mako CPUE standardization models in the North Atlantic, using a Tweedie GLM with link=log and the Delta method (binomial and lognormal models). For each parameter it is indicated the degrees of freedom (Df), the deviance (Dev), the residual degrees of freedom (Resid Df), the residual deviance (Resid. Dev), the F-test statistic and the significance (p-value).
Model Df Dev Resid.
Df Resid. Dev. Stat. (F/Chisq) p-value Tweedie model (Intersept only) 1532 14711 Year 16 1382.7 1516 13328 9.35 < 0.001 Quarter 3 579.6 1513 12749 20.91 < 0.001 Area 2 66.4 1511 12682 3.59 0.028 TargetingRatio 9 293.2 1502 12389 3.53 < 0.001 Quarter:Area 6 455.78 1496 11933 8.2208 < 0.001 Quarter:TargetingRatio 27 415.94 1469 11517 1.6671 0.017
Delta lognormal - lognormal model
(Intersept only) 1148 1478.5
Year 16 130.9 1132 1347.6 7.80 < 0.001
Quarter 3 94.6 1129 1253 30.07 < 0.001
Area 2 7.2 1127 1245.8 3.43 0.033
TargetingRatio 3 66.6 1124 1179.1 21.17 < 0.001
Delta lognormal - binomial model
(Intersept only) 1532 1725.8
Year 16 45.877 1516 1679.9 44.92 < 0.001
Quarter 3 125.013 1513 1554.9 113.26 < 0.001
Area 2 3.152 1511 1551.7 3.90 0.207
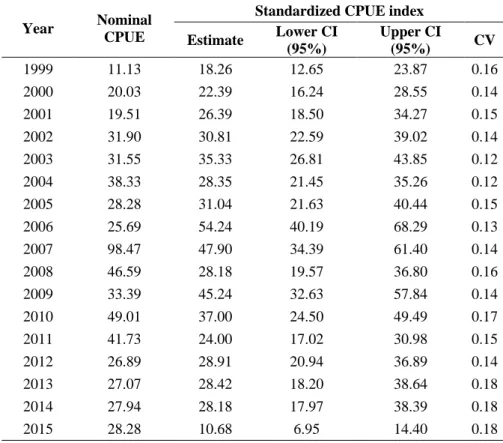
Table 3. Nominal and standardized CPUEs (kg/1000 hooks) for the shortfin mako captured by the Portuguese pelagic longline fishery in the North Atlantic. The point estimates, 95% confidence intervals and the CV of the standardized index are presented.
Year Nominal
CPUE
Standardized CPUE index
Estimate Lower CI (95%) Upper CI (95%) CV 1999 11.13 18.26 12.65 23.87 0.16 2000 20.03 22.39 16.24 28.55 0.14 2001 19.51 26.39 18.50 34.27 0.15 2002 31.90 30.81 22.59 39.02 0.14 2003 31.55 35.33 26.81 43.85 0.12 2004 38.33 28.35 21.45 35.26 0.12 2005 28.28 31.04 21.63 40.44 0.15 2006 25.69 54.24 40.19 68.29 0.13 2007 98.47 47.90 34.39 61.40 0.14 2008 46.59 28.18 19.57 36.80 0.16 2009 33.39 45.24 32.63 57.84 0.14 2010 49.01 37.00 24.50 49.49 0.17 2011 41.73 24.00 17.02 30.98 0.15 2012 26.89 28.91 20.94 36.89 0.14 2013 27.07 28.42 18.20 38.64 0.18 2014 27.94 28.18 17.97 38.39 0.18 2015 28.28 10.68 6.95 14.40 0.18
Figure 1. Sampling locations with the definition of fishing areas of the Atlantic for the shortfin mako shark used in this study (according to the area definitions by Ortiz et al., 2010). The red dots represent sampling locations (trips or sub-trips) and the violet dots represent trips or sub-trips with positive shortfin mako catches. Due to small sample sizes, the areas "9+10+11", "12+13", "1+2", "15+16" and "18+20" were joined for the models, creating latitudinal gradients in the area definitions.
Figure 2. Location and size (FL, cm) of the shortfin mako shark (Isurus oxyrinchus) recorded by the Portuguese pelagic longline fleet in the Atlantic (1997-2015). The size classes are categorized by the 0.2 quantiles and colour coded. The ICCAT sampling areas for sharks (BIL areas) are represented. For visualization purposes, the data points are jittered by 1º * 1º degrees so the positions shown are approximate within each 1º *1º square degree.
Figure 3. Size-frequency distributions of shortfin mako sharks (Isurus oxyrinchus), caught in the ICCAT sampling areas of the Atlantic Ocean by the Portuguese pelagic longline fleet (1997-2015).
Figure 4. Time series of the mean sizes of shortfin mako sharks (Isurus oxyrinchus) caught by the Portuguese pelagic longline fleet in each of the Atlantic stocks. The error bars are ± 1 standard error.
Figure 5. Variation of the yearly size-frequency distributions of shortfin mako sharks (Isurus oxyrinchus), caught in each Atlantic stock by the Portuguese pelagic longline fleet.
Figure 6. Map of the North Atlantic shortfin mako shark (Isurus oxyrinchus) nominal CPUEs (all years combined, data between 1999 and 2015) in areas of operation of the Portuguese pelagic longline fleet. The squares are in 5*5º and the average CPUEs are in Kg/1000 hooks.
Figure 7. Effort distribution of the Portuguese pelagic longline fleet sampled in the North Atlantic used in this study, for the period 1999-2015. The effort is represented in number of hooks (x1000) in 5x5 degree grids.
Figure 8. Proportion of trips or sub-trips with zero shortfin mako shark catches in the Portuguese pelagic longline fishery targeting swordfish in the North Atlantic between 1999 and 2015. The error bars represent 95% confidence intervals.
Figure 9. Nominal CPUE series (Kg/1000 hooks) for shortfin mako shark (Isurus oxyrinchus) caught by the Portuguese pelagic longline fishery in the North Atlantic Ocean, between 1999 and 2015. The error bars represent 95% confidence intervals.
Figure 10: Distribution of the nominal shortfin mako shark CPUE captured by the Portuguese pelagic longline fleet in the North Atlantic, in non-transformed (top) and log-transformed scale (excluding zeros, bottom).
Figure 11. Monthly distribution of the SMA CPUEs caught by the Portuguese pelagic longline fishery in the North Atlantic Ocean, between 1999 and 2015. The plot on the top are boxplots of the CPUE and the plot on the bottom are the monthly averages with the standard errors.
Figure 12. Residual analysis for the final models used for the SMA CPUE standardization in the North Atlantic. The 3 graphics on the top are from the tweedie model (quantile residuals) and the 3 graphics on the bottom are from the delta-method (Pearson residuals of the lognormal model for the positives only). The graphics on the left represent the values of the residuals along the predicted (log) values, the graphics in the middle represent the QQPlots, and the graphics on the right represent the frequency distribution (histograms) of the residuals. On the graphics on the left, the dotted grey line represents a horizontal line at y=0 and the solid red line the smoothed fit to the residuals.
Figure 13. Comparison of the relative annual indexes of abundance for SMA captured by the Portuguese pelagic longline fleet in the North Atlantic (point estimates), using the delta-lognormal and tweedie models. The black circles represent the nominal CPUEs. For comparison purposes the indexes and nominal series are scaled by their respective means.
Figure 14. Comparison of the relative annual indexes of abundance for SMA captured by the Portuguese pelagic longline fleet in the North Atlantic (point estimates), using the delta-lognormal and tweedie models. The black circles represent the nominal CPUEs. For comparison purposes the indexes and nominal series are scaled by their respective means.