Page 1 of 7 January 2019
Brazil leads the improvement of the economic climate in Latin America
Ifo/FGV Economic Climate
Index for Latin America Present Situation Expectations
October/2018 January/2019 October/2018 January/2019 October/2018 January/2019
The Ifo/FGV Economic Climate Index (ECI) in Latin America - developed in partnership between the German Ifo Institute and the FGV — advanced for the second consecutive quarter, going to 9.1 negative points from 10.7 negative points between October 2018 and January 2019, although it remains in the unfavorable zone. The improvement was influenced by the increase in the Expectations Indicator (EI), which increased to 25 points from 21.6 points in the same period. The Present Situation Indicator (PSI) showed a slight recovery, but remains negative and very close to the level of October 2018 - a difference of only 0.3 point.
It is noteworthy that the improvement of ECI in Latin America was led by the results of the Survey for Brazil. As we will see in the section on the results from selected countries, Brazil was one of the few to register improvement in ECI in the last two surveys. ECI in Brazil advanced to 3.6 positive points in January 2019 from 33.9 negative points in October 2018. This recovery is explained by the 240% increase in the expectations indicator, to 88 points from 25.9 points in the period.
In the world, the Economic Climate Index (ECI) fell, remaining in the unfavorable zone influenced by the fall of both indicators that measure current situation and expectations. The PSI is in the positive zone, but fell to 2.2 points from 12.2 points between the last two surveys. The EI, which was already unfavorable since July 2018, reported a new fall and reached 2.7 negative points in January.
Chart 1 compares the results of ECI in the world with that of Latin America. It is observed that the world's ECI is systematically better than that of Latin America since April 2013, a result that has been reversed in the current survey. Since that date, ECI in Latin America has been showing negative results. The improvement in results for January 2019 indicates a more favorable situation, although anchored only in the advance of expectations.
Page 2 of 7 January 2019
Chart 2 shows the ECI of the largest economies in the world. ECI worsened, with negative results in the United States, the European Union, France, Japan and the United Kingdom. In Germany, despite the positive result, the indicator dropped. In the United States, the assessment of the current situation was positive, but it worsened in relation to October 2018, while expectations deteriorated significantly with the indicator going to 49.2 points from 14 points. In the European Union, the scenario has been repeating. The big economies are still experiencing a favorable environment, but uncertainties about US government decisions, protests in France, discussion of the BREXIT, and the trade war with China make expectations unfavorable.
Among the BRICS, in China, the world's second largest economy, ECI fell as a result of worsening ratings on the current situation and expectations, which remained negative. The same is true in South Africa. Russia, India and Brazil have improved their economic climate, but only the last two countries are in ECI's favorable zone. It is noted that India has recorded positive ECI since October 2013, signaling a sustained period for favorable growth.
Page 3 of 7 January 2019 11,9 19,6 -2,7 30,7 23,4 -35,6 -25,0 16,6 -2,3 -45,6 -45,9 1,7 27,8 8,8 27,1 17,1 -37,1 -33,6 3,5 -24,6 -26,9 -33,9 -13,0 -2,9 -18,9 11,5 -23,8 -46,7 -38,8 10,4 -22,1 -33,7 3,6 -60 -50 -40 -30 -20 -10 0 10 20 30 40 União Européia Estados Unidos
Japão Alemanha França Reino Unido China Índia Rússia África do Sul Brasil
Gráfico 2: Indicador de Clima Econômico de países/regiões selecionadas (em pontos)
jul/18 out/18 jan/19
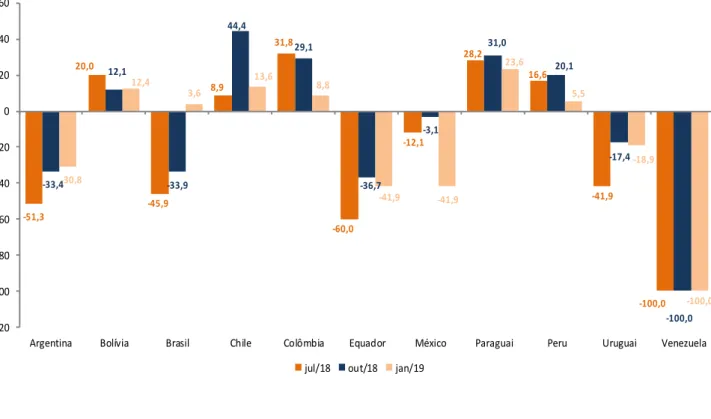
Results for selected Latin American countries
ICE improves in Argentina, Bolivia and Brazil between the last two surveys, but Argentina remains at an unfavorable level. In other countries, there was a worsening of the economic climate, especially in Mexico, which has deteriorated significantly in relation to the last survey. In addition, Ecuador and Uruguay are in the unfavorable assessment zone. Chile, Colombia, Paraguay and Peru reported a decrease in ECI, but remained with a favorable assessment.
Positive results were recorded in the expectations: four countries (Argentina, Brazil, Bolivia and Mexico); and two are in the neutral zone (Paraguay and Ecuador). Favorable Situation Indicator was reported in three countries (Bolivia, Chile and Paraguay).
Argentina, Brazil and Uruguay considered an improvement in EI - and in ISA, Bolivia and Brazil. Brazil was the only country that improved the assessment of the current situation and expectations. However, as the current situation continues in the unfavorable zone, the result signals a possible recovery of the economic climate towards an expansion phase. As it is relatively consensual among experts, the positive results of the promised reforms are expected to balance the fiscal situation.
Finally, this year there will be elections in Argentina, Uruguay and Bolivia, which may change the scenario of expectations in these countries. In addition, it is noted that the entire region watches the case of Venezuela, which may also impact the expectations of the geographical neighbors.
Page 4 of 7 January 2019 -51,3 20,0 -45,9 8,9 31,8 -60,0 -12,1 28,2 16,6 -41,9 -100,0 -33,4 12,1 -33,9 44,4 29,1 -36,7 -3,1 31,0 20,1 -17,4 -100,0 -30,8 12,4 3,6 13,6 8,8 -41,9 -41,9 23,6 5,5 -18,9 -100,0 -120 -100 -80 -60 -40 -20 0 20 40 60
Argentina Bolívia Brasil Chile Colômbia Equador México Paraguai Peru Uruguai Venezuela Gráfico 3: Indicador de Clima Econômico dos países da América Latina
jul/18 out/18 jan/19
RANKING OF ECONOMIC CLIMATE FOR LATIN AMERICAN COUNTRIES
Average ECI for the last 4 quarters
Previous Position Current Position Country oct/18 jan/19
1 1 Paraguay 36.3 32.9 2 2 Chile 32.2 29.0 3 3 Colombia 16.4 17.3 4 4 Peru 13.2 11.2 5 5 Bolivia -2.0 5.4 6 6 Uruguay -6.5 -15.4 8 7 Mexico -16.0 -19.8 9 8 Brazil -21.7 -21.9 7 9 Argentina -11.5 -26.2 10 10 Ecuador -35.8 -38.7 11 11 Venezuela -97.0 -97.0
Page 5 of 7 January 2019
APPENDIX ECONOMIC CLIMATE INDEX
ECI
jul/16 oct/16 jan/17 apr/17 jul/17 oct/17 jan/18 Apr/18 jul/18 oct/18 jan/19 Average 10 years Latin America -37.2 -29.9 -30.6 -22.1 -27.5 -0.9 1.5 -5.2 -21.1 -10.7 -9.1 -12.2 Argentina -11.0 7.8 0.2 1.0 1.6 45.2 28.2 10.7 -51.3 -33.4 -30.8 -18.7 Bolivia -1.6 -34.0 -16.5 -37.5 -17.4 -21.1 -17.4 -22.7 20.0 12.1 12.4 -9.3 Brazil -63.1 -34.2 -37.9 -21.0 -41.0 -8.3 4.3 -11.4 -45.9 -33.9 3.6 -9.9 Chile -67.7 -43.7 -28.5 -48.8 -53.6 -2.0 26.3 49.2 8.9 44.4 13.6 -0.2 Colombia -9.3 -18.5 -4.6 -1.6 -16.3 -6.4 5.3 -0.6 31.8 29.1 8.8 5.3 Ecuador -70.4 -41.9 -32.3 -41.9 -58.6 -41.3 -30.3 -16.3 -60.0 -36.7 -41.9 -25.6 Mexico -13.7 -54.7 -59.4 -28.4 -9.9 -14.4 -26.8 -21.9 -12.1 -3.1 -41.9 -17.3 Paraguay 5.4 16.7 18.7 32.8 21.3 21.3 37.2 49.1 28.2 31.0 23.6 18.6 Peru 3.8 45.7 30.0 -22.7 -28.7 26.1 13.8 2.5 16.6 20.1 5.5 25.2 Uruguay -18.9 -14.2 21.1 30.5 18.7 16.6 16.6 16.6 -41.9 -17.4 -18.9 12.3 Venezuela -100.0 -88.2 -88.2 -100.0 -100.0 -84.5 -100.0 -88.2 -100.0 -100.0 -100.0 -78.1
PRESENT SITUATION INDEX
PSI
jul/16 oct/16 jan/17 apr/17 jul/17 oct/17 jan/18 apr/18 jul/18 oct/18 jan/19
Average 10 years Latin America -59.7 -69.4 -63.8 -60.4 -62.6 -43.8 -31.8 -31.1 -40.0 -38.3 -38.0 -23.4 Argentina -63.6 -47.1 -53.3 -42.9 -37.5 20.0 8.3 -7.7 -70.0 -78.6 -78.6 -28.2 Bolivia 50.0 14.3 14.3 20.0 0.0 0.0 0.0 0.0 20.0 25.0 42.9 12.4 Brazil -100.0 -100.0 -96.4 -89.3 -92.3 -73.9 -53.6 -56.5 -88.0 -77.8 -56.0 -25.1 Chile -57.1 -77.8 -71.4 -85.7 -100.0 -60.0 -18.2 30.0 18.2 44.4 18.2 -1.4 Colombia 0.0 -28.6 -16.7 -25.0 -50.0 -50.0 -29.4 -44.4 -7.1 0.0 -6.3 8.4 Ecuador -80.0 -75.0 -75.0 -75.0 -50.0 -60.0 -40.0 -50.0 -60.0 -66.7 -75.0 -20.9 Mexico -35.7 -69.2 -56.3 -37.5 -33.3 -33.3 -33.3 -18.8 0.0 -11.8 -33.3 -28.3 Paraguay 16.7 16.7 12.5 50.0 28.6 28.6 50.0 71.4 42.9 66.7 50.0 20.0 Peru 0.0 30.8 26.7 -42.9 -76.9 -15.4 -12.5 -38.5 13.3 -6.3 -5.9 26.4 Uruguay -55.6 -37.5 0.0 12.5 25.0 11.1 22.2 22.2 -33.3 0.0 -12.5 31.6 Venezuela -100.0 -100.0 -100.0 -100.0 -100.0 -100.0 -100.0 -100.0 -100.0 -100.0 -100.0 -85.6
Page 6 of 7 January 2019
EXPECTATIONS INDEX
EXI
jul/16 out/16 jan/17 abr/17 jul/17 out/17 jan/18 abr/18 jul/18 out/18 jan/19 Média 10 anos Latin America -11.1 21.6 10.6 26.8 16.5 53.9 41.3 24.7 0.0 21.6 25.0 2.4 Argentina 50.0 82.4 73.3 57.1 50.0 73.3 50.0 30.8 -30.0 28.6 35.7 -2.8 Bolivia -25.0 -71.4 -42.9 -80.0 -33.3 -40.0 -33.3 -42.9 20.0 0.0 -14.3 -26.9 Brazil -12.5 75.0 53.6 89.3 34.6 91.3 85.2 47.8 12.0 25.9 88.0 15.0 Chile -25.0 0.0 28.6 0.0 14.3 80.0 81.8 70.0 0.0 44.4 9.1 8.8 Colombia -18.2 -7.7 8.3 25.0 25.0 50.0 47.1 55.6 78.6 62.5 25.0 7.6 Ecuador -60.0 0.0 25.0 0.0 -66.7 -20.0 -20.0 25.0 -60.0 0.0 0.0 -26.2 Mexico -7.1 -38.5 -62.5 -18.8 16.7 6.7 -20.0 -25.0 -23.5 5.9 -50.0 -2.4 Paraguay 25.0 16.7 25.0 16.7 14.3 14.3 25.0 28.6 14.3 0.0 0.0 19.9 Peru 16.7 61.5 33.3 0.0 38.5 76.9 43.8 53.8 20.0 50.0 17.6 28.4 Uruguay -12.5 12.5 44.4 50.0 12.5 22.2 11.1 11.1 -50.0 -33.3 -25.0 -3.0 Venezuela -100.0 -75.0 -75.0 -100.0 -100.0 -66.7 -100.0 -75.0 -100.0 -100.0 -100.0 -69.0
Page 7 of 7 January 2019
METHODOLOGICAL ASPECTS OF THE SURVEY
The Latin America Economic Survey aims for monitoring and forecasting of economic trends, based on quarterly information supplied by economy experts in their respective countries. The survey is simultaneously applied with the same methodology in all countries of the region, a method that allows the construction of an agile and comprehensive picture of the economic situation in countries and economic blocks. In January 2019, 138 economic experts were consulted in 15 countries of Latin America.
The survey generates information of both qualitative and quantitative nature. The Economic Climate Index (ECI), is the synthesis indicator, comprised of two items of qualitative nature, the Present Situation Index (PSI) and the Expectations Index (EI), which deal, respectively, with the general economic situation in the country at the moment and for the upcoming six months.
As of January 2018, the Present Situation (PSI) and Expectations (EI) indicators for each country are now expressed as the balance of responses of the respective qualitative items, according to the formula presented below:
PSI=((〖option〗_+-〖option〗_- )*100)/n, option+ = Favorable option;
option- = Unfavorable option; and
n = number of experts who answered this question. The EI formula is analogous.
The Economic Climate Index is constructed as the geometric mean of the response balances of the current situation and expectations items minus 100 (-100), according to the formula described below:
ECI=√((PSI+200)*(EI+200) )-200, ECI = Economic Climate Index.
Thus, the scale of indicators ranges from minus 100 (-100) to plus 100 (+100). Zero (0) is the inflection point.
In order to reach any aggregate of countries, such as the total for Latin America, the country indices are aggregate by GDP, corrected by Purchasing Power Parity (PPP GDP, according to IMF data). The new methodology modified the relative importance of the two main countries of the region in the aggregated result. Before, with the weights of countries determined by the Trade Chain (Exports + Imports), Mexico represented 45% of the countries in the region surveyed, and Brazil 21%. With the change, Brazil's weight increased to 38.0%, while Mexico's indicators contributed with 28.0% to the region's result. Argentina now moved to third place (10.6%), in place of Chile (5.3%). See below the weight structure for closing ECI, PSI and EI in Latin America for July 2018.
Countries Weight Brazil 38.0% Mexico 28.0% Argentina 10.6% Colombia 8.3% Chile 5.3% Peru 4.9% Ecuador 2.2% Bolivia 1.0% Uruguay 0.9% Paraguay 0.8%