On The Evolution of TFP in Latin America
Pedro Cavalcanti Ferreira (EPGE/FGV)
Samuel de Abreu Pessôa (IBRE/FGV)
Fernando A. Veloso (IBRE/FGV)
April 2012
Abstract
Due to several policy distortions, including import-substitution industrialization, widespread government intervention and both domestic and international competitive barriers, there has been a general presumption that Latin America has been much less productive than the leading economies in the last decades. In this paper we show, however, that until the late seventies Latin American countries had high productivity levels relative to the United States. It is only after the late seventies that we observe a fast decrease of relative TFP in Latin America. We also show that the inclusion of human capital in the production function makes a crucial di¤erence in the TFP calculations for Latin America.
Key Words: Latin America, Total Factor Productivity.
JEL Classi…cation Code: O11, O47, O54.
1
Introduction
Due to several policy distortions, including import-substitution industrialization, widespread government intervention and both domestic and international competitive barriers, there has been a general presumption that Latin America has been much less productive than the leading economies in the last decades. Recent papers have provided evidence that is consistent with this hypothesis. In particular, Cole et al. (2005) found that average total factor productivity (TFP) in Latin America corresponded to roughly 50% of US productivity between 1950 and 2000. The authors also argued that competitive barriers may explain why TFP is low in Latin America relative to the United States.
Some studies have documented a negative TFP growth rate in Latin America in the eighties. Bosworth and Collins (2003) and Loayza et al. (2005) show that average TFP in Latin America declined during this decade. Other studies have con…rmed this …nding for some speci…c countries, including Kydland and Zarazaga (2002) and Hopenhayn and Neumeyer (2006) for Argentina, Bergoing et al. (2002) for Mexico and Bugarin et al. (2007) for Brazil.
In this paper we show, however, that until the late seventies Latin American countries had high productivity levels relative to the United States. On average, TFP in Latin America corresponded to 82% of the U.S. between 1960 and 1980. It is only after the late seventies that we observe a fast decrease of relative TFP in Latin America, which fell to 54% of US TFP in 2007.
Blyde and Fernandez-Arias (2006) also presented some evidence that Latin America had
high TFP relative to the US in the sixties and seventies, and that it was lower in the nineties.1
Our main contribution is to document more systematically this stylized fact - this point was just one among many in their article - and examine to what extent this result is robust to the use of di¤erent methodologies and data sources. In particular, we consider the role of natural resources and human capital.
We …rst address the possibility that natural resources might account for the high relative TFP in Latin America between 1960 and 1980. We compute a measure of TFP adjusted
1We arrived at this …nding independently. A …rst version of Ferreira, Pessôa and Veloso (2008), presented
for natural resources for the seven largest Latin American countries, for which there is detailed sectorial data available from the Groningen Growth and Development Centre 10-Sector Database (Timmer and de Vries (2009)). Despite being lower than our baseline measure in every year, the adjusted relative TFP displays the same pattern. In particular, it was high between 1960 and 1980 and then it fell sharply.
We consider next the importance of including human capital as a factor of production. In this paper we include human capital in the production function, as has become standard in the growth and development accounting literature (see Klenow and Rodriguez-Clare (1997) and Hall and Jones (1999)). We show that the inclusion of human capital makes a crucial di¤erence in the TFP calculations for Latin America. When we do not include human capital we obtain a value of 53% for Latin America relative TFP between 1960 and 1980. It then declines and reaches 43% in 2007.
This paper is organized as follows. In section 2 we present the methodology used to construct our measure of relative TFP. Section 3 presents the stylized facts about relative TFP in Latin America and several robustness exercises. In particular, we examine the role of natural resources and human capital. Section 4 concludes.
2
Methodology and Data
Let the production function in terms of output per worker be given by:
yit =Aitkith1it ; (1)
where yit is the output per worker of country i at time t; k stands for physical capital per
worker, h is human capital per worker, and A is total factor productivity (TFP). Estimates
in Gollin (2002) of the capital share of output for a variety of countries ‡uctuates around
0.40, so we set at this value.
In our exercises we follow Bils and Klenow (2000) to model human capital and set:
h = exp (s) = exp
1 s
1 ; (2)
where s stands for schooling. We measured s using average years of schooling of the
to …t an annual frequency. According to the calibration in Bils and Klenow (2000), we set
= 0:58and = 0:32:
The physical capital series is constructed with investment data in international prices from
the Penn World Table 6.3 using the perpetual inventory method.2 As usual in the literature,
we assume that all economies were in a balanced growth path at time zero and compute
the initial capital stock, K0;according to the expression K0 =I0=[(1 +g)(1 +n) (1 )],
where I0 is the initial investment expenditure, g is the rate of technological progress, n is
the growth rate of the population and is the rate of capital depreciation.
To minimize the impact of economic ‡uctuations we used the average investment of the
…rst …ve years as a measure ofI0. In order to reduce the e¤ect ofK0in the capital stock series,
we started this procedure taking 1950 as the initial year.3 We used the same depreciation
rate for all economies, which was calculated from US census data. We employed the capital
stock at market prices, investment at market prices,I, as well as the law of motion of capital
to estimate the implicit depreciation rate according to:
= 1 Kt+1 It
Kt :
From this calculation, we obtained = 3:5% per year (average of the 1950-2007 period).
To computek, we dividedK by the number of workers, obtained from Penn World Table 6.3.
We calculated the rate of technological progress by adjusting an exponential trend to the U.S. output per worker series, correcting for the increase in the average schooling of the labor
force and obtained g =1.53%. The population growth rate, n; is the average annual growth
rate of population in each economy between 1960 and 2007, calculated from population data in the Penn World Table 6.3.
Data on output per worker in international prices were obtained from the Penn World
Table 6.3. In order to compute the value of Ait, we used the observed values of yit and the
constructed series of kit and hit so that the productivity of the i-th economy at time t was
obtained as:
Ait = yit
kith1it
: (3)
2See Heston, Summers and Atten (2009) for a description of Penn World Table 6.3.
3For Chile, Dominican Republic, Ecuador and Paraguay we have investment data since 1951, so we set
3
Stylized Facts
3.1
Baseline Results
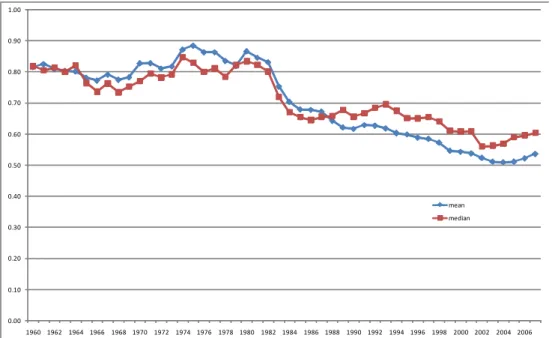
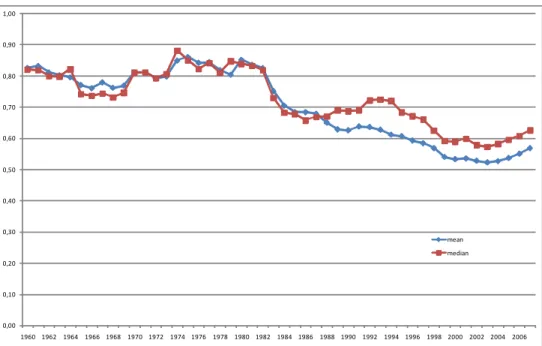
Figure 1 shows the evolution between 1960 and 2007 of the (geometric) mean and the median
of TFP of 18 Latin American countries4 relative to U.S TFP.5 Until the late seventies,
mean total factor productivity in Latin America was close to that of the leading economy, corresponding to 82% of US TFP between 1960 and 1980. The median Latin American TFP relative to the US averaged 79% between 1960 and 1980. However, since the late seventies both the mean and the median TFP in Latin America have fallen continuously, declining to 54% and 60% of US TFP in 2007, respectively.
0.00 0.10 0.20 0.30 0.40 0.50 0.60 0.70 0.80 0.90 1.00
1960 1962 1964 1966 1968 1970 1972 1974 1976 1978 1980 1982 1984 1986 1988 1990 1992 1994 1996 1998 2000 2002 2004 2006 mean
median
Figure 1: Latin America Relative TFP (US=1)
In absolute values, TFP grew on average 0.58% per year in Latin America between 1960 and 1980, slightly above the US TFP growth rate of 0.32%. Between 1980 and 2007, however, while U.S. productivity growth accelerated, growing at 0.89% per year, Latin America TFP
4The Latin American countries are Argentina, Bolivia, Brazil, Chile, Colombia, Costa Rica,
Domini-can Republic, Ecuador, El Salvador, Guatemala, Honduras, Mexico, Nicaragua, Panama, Paraguay, Peru, Uruguay and Venezuela.
5For each country iand year t, relative TFP is given by: A
it=AU St:We then computed the unweighted
collapsed, declining at an average annual rate of 0.88%6 As a result, in the entire 1960-2007 period TFP in Latin America fell in absolute terms 0.26% per year, with fourteen out of eighteen countries of our sample presenting zero or negative growth.
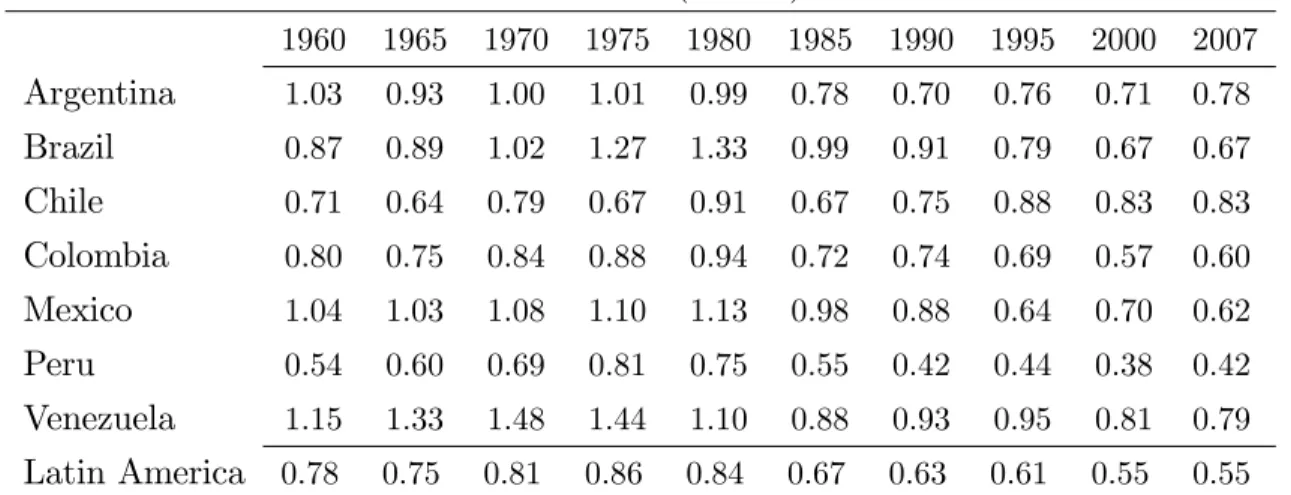
Table 1 presents data on relative TFP for the seven largest economies in Latin America. In some countries, such as Venezuela, Mexico, Argentina and Brazil, TFP surpassed that of the US during most of the period before 1980. This contrasts drastically with the situation in 2007, when TFP in these countries ranged between 61% and 73% of the US. Only Chile had an increase in relative TFP between 1960 and 2007. When we consider the sample of 18 Latin American countries, in ten of them TFP was at least 80% of the US between 1960
and 1980. However, in 2007 relative TFP in Latin America was above 0.80 only in Chile.
Table 1: Relative TFP (U.S=1)
1960 1965 1970 1975 1980 1985 1990 1995 2000 2007
Argentina 1.04 0.95 1.01 1.02 1.00 0.76 0.66 0.73 0.68 0.73
Brazil 0.91 0.93 1.06 1.37 1.44 1.05 0.94 0.80 0.66 0.64
Chile 0.73 0.66 0.77 0.64 0.83 0.62 0.70 0.87 0.84 0.86
Colombia 0.83 0.77 0.85 0.90 0.96 0.75 0.75 0.71 0.57 0.60
Mexico 1.11 1.10 1.15 1.16 1.20 1.03 0.89 0.65 0.70 0.61
Peru 0.56 0.61 0.69 0.77 0.71 0.52 0.39 0.40 0.36 0.40
Venezuela 1.22 1.36 1.49 1.46 1.14 0.87 0.89 0.88 0.75 0.73
Latin America 0.81 0.78 0.83 0.88 0.87 0.68 0.62 0.60 0.54 0.54
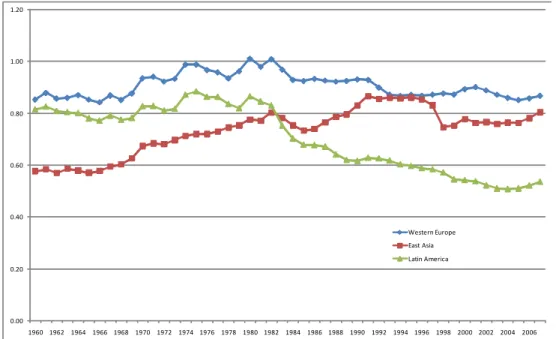
We have thus identi…ed two general patterns: relative TFP in Latin America was high until the late seventies and since then it has fallen continuously in the region. Is this a general fact observed in other regions? Figure 2 shows that this is not the case. From 1960 to 1980 average TFP in Latin America was close to that of Western Europe and 25% higher than
East Asia TFP.7 However, while in East Asia we observe convergence to the US productivity
level between 1960 and 2007, in Latin America there was increasing divergence relative to US TFP since the late seventies. In 2007 both regions surpassed Latin America TFP by more than 50%.
6The fall was ever higher between 1980 and 2003: -1.23% annually.
7The countries included in our comparison are as follows. Western Europe: Austria, Italy, Finland,
0.00 0.20 0.40 0.60 0.80 1.00 1.20
1960 1962 1964 1966 1968 1970 1972 1974 1976 1978 1980 1982 1984 1986 1988 1990 1992 1994 1996 1998 2000 2002 2004 2006 Western Europe
East Asia Latin America
Figure 2: Relative TFP, Region and Continent Averages (US=1)
We observe the same qualitative patterns if we compare Latin America TFP with average
TFP in a larger sample of 83 developed and developing countries.8 In particular, mean TFP
in Latin America was 6% above the average world TFP between 1960 and 1980. However, in 2007 it was 23% below average world TFP. Only Sub-Saharan Africa fares worse in terms of TFP reduction in the period.
3.2
Basic Robustness Exercises
It could be the case that our results are driven by measurement error in the TFP series. In particular, if our capital stock is measured with error due, for instance, to the procedure used to construct the initial capital stock or to our hypothesis about the depreciation rate,
our TFP calculations could be biased.9
In order to verify the sensitivity of the results to the initial capital stock, we reconstructed the capital stock series using a 10% depreciation rate and the same methodology as above.
We then generated a new TFP series according to (3). This exercise is important because a
8See the Appendix for a list of the countries included in the sample.
9It is important to remind, however, that for 14 of the 18 Latin American countries included in our sample,
higher depreciation rate reduces the importance of the initial capital stock. Results did not change much, as shown in Table 2. Between 1960 and 1980, average TFP in Latin America was close to 82% of US TFP. After this date, it fell continuously and in 2007 it corresponded to only 55% of US TFP.
Table 2: Relative TFP (U.S=1) - = 10%
1960 1965 1970 1975 1980 1985 1990 1995 2000 2007
Argentina 1.03 0.93 1.00 1.01 0.99 0.78 0.70 0.76 0.71 0.78
Brazil 0.87 0.89 1.02 1.27 1.33 0.99 0.91 0.79 0.67 0.67
Chile 0.71 0.64 0.79 0.67 0.91 0.67 0.75 0.88 0.83 0.83
Colombia 0.80 0.75 0.84 0.88 0.94 0.72 0.74 0.69 0.57 0.60
Mexico 1.04 1.03 1.08 1.10 1.13 0.98 0.88 0.64 0.70 0.62
Peru 0.54 0.60 0.69 0.81 0.75 0.55 0.42 0.44 0.38 0.42
Venezuela 1.15 1.33 1.48 1.44 1.10 0.88 0.93 0.95 0.81 0.79
Latin America 0.78 0.75 0.81 0.86 0.84 0.67 0.63 0.61 0.55 0.55
We also repeat our exercises using capital and output data from Nehru and Dhareshwar (1993). This is important because Cole et al. (2005) used this data to conclude that Latin America TFP during the post-war period corresponded to only 50% of the US TFP. The data set spans the period 1950-1990. We use expression (3) to construct TFP measures for Latin America, Western Europe and East Asia.
0.00 0.20 0.40 0.60 0.80 1.00 1.20
1950 1952 1954 1956 1958 1960 1962 1964 1966 1968 1970 1972 1974 1976 1978 1980 1982 1984 1986 1988 1990 Western Europe
Latin America East Asia
Figure 3: Relative TFP, Latin America and Other Regions (US=1) - Nehru-Dhareshwar Data
3.3
The Role of Natural Resources
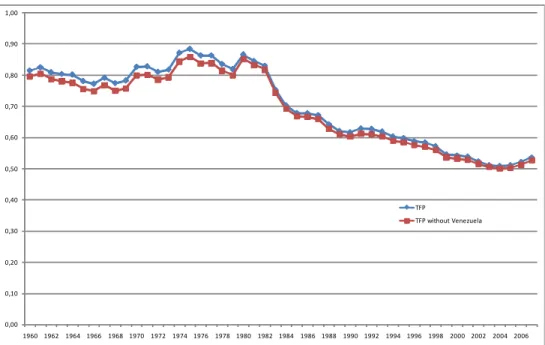
All these exercises consider only physical capital, labor and human capital as factors of pro-duction. In particular, we do not consider the contribution of factors that might be important in Latin America, such as natural resources. It could be the case that the methodology we use attributes to productivity the contribution of natural resources and thus overestimates relative TFP in Latin America. Moreover, the reduction of the importance of natural re-sources in production might account for the decline in relative TFP in Latin America since 1980.
0,00 0,10 0,20 0,30 0,40 0,50 0,60 0,70 0,80 0,90 1,00
1960 1962 1964 1966 1968 1970 1972 1974 1976 1978 1980 1982 1984 1986 1988 1990 1992 1994 1996 1998 2000 2002 2004 2006 TFP
TFP without Venezuela
Figure 4: Latin America Relative TFP (US=1), with and without Venezue
Our second approach is to subtract from GDP the value added in natural resource-related sectors in computing our measure of output. This is a coarse correction, since it assigns all of the value added in these sectors to natural resource inputs and neglects capital and labor inputs in these sectors. It should be noted, in particular, that this procedure underestimates
the value of TFP for resource-rich countries.10 In any case, it gives a rough estimate of the
bias that natural resources may create for our observed TFP measure. This is the same procedure used by Hall and Jones (1999) to correct for natural resources. The di¤erence is that, in addition to the mining industry, we also make a correction for value added in agriculture, forestry and …shing.
We use data on sectorial value added obtained from the Groningen Growth and
Develop-ment Centre 10-Sector Database (GGDC).11 There is data for nine Latin American countries
for the period 1950-2005. The measure we use for the production from mineral resources is the value added in the mining and quarrying sector. We also subtract from GDP the value added in the agriculture, forestry and …shing sector. Speci…cally, for each country we calculate the proportion of natural resources output in total value added using data from GGDC. Then we apply these proportions to output per worker data in international prices
10See Caselli (2005).
from the Penn World Table to obtain a measure of adjusted output per worker. The last step is to use this measure of output per worker and our baseline physical and human capital per worker to compute a measure of TFP adjusted for natural resources according to (3).
One caveat is that the GGDC sectorial data is measured in domestic prices rather than international prices. To our knowledge, there is no time-series data available on natural
resources production measured in international prices for Latin American countries.12 Hence
we assume in this exercise that the proportion of natural resources output in total value added is the same whether it is measured in domestic or international prices. Since this is a tradable sector, we believe this is a reasonable …rst approximation.
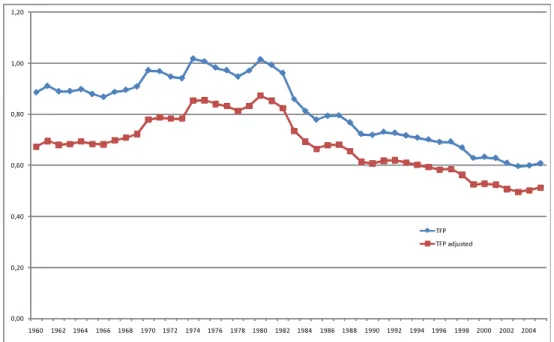
In order to make the results more readily comparable to previous tables, we calculated the relative adjusted TFP measure for the seven largest Latin American economies: Ar-gentina, Brazil, Chile, Colombia, Mexico, Peru and Venezuela. Figure 5 compares our base-line results for these seven Latin American countries with the measure of TFP adjusted for natural resources. Without the adjustment, mean relative TFP for the seven Latin Amer-ican economies was 94% between 1960 and 1980, and fell to 61% in 2007. Despite being lower than our baseline measure in every year, the adjusted relative TFP displays the same pattern. In particular, it was high between 1960 and 1980, corresponding on average to 76% of US TFP during this period. It then declined sharply, falling to only 51% of US TFP in 2005.
12Restuccia, Yang and Zhu (2008) construct international dollar prices of agricultural products using data
0,00 0,20 0,40 0,60 0,80 1,00 1,20
1960 1962 1964 1966 1968 1970 1972 1974 1976 1978 1980 1982 1984 1986 1988 1990 1992 1994 1996 1998 2000 2002 2004 TFP
TFP adjusted
Figure 5: Latin America Relative TFP, with Adjustment for Natural Resources (US=1)
Table 3 presents results for each of the seven Latin American countries. Venezuela was the country most a¤ected by the adjustment, since the mineral sector makes a large contribution to its GDP. The Appendix presents separate TFP results for adjustments due to the mineral sector, and the agriculture, forestry and …shing sectors.
Table 3: Relative TFP (U.S=1) - Adjusted for Natural Resources
1960 1965 1970 1975 1980 1985 1990 1995 2000 2005
Argentina 0.94 0.86 0.93 0.94 0.92 0.70 0.60 0.66 0.62 0.61
Brazil 0.78 0.80 0.94 1.25 1.33 0.95 0.85 0.72 0.59 0.54
Chile 0.63 0.58 0.68 0.55 0.73 0.52 0.59 0.75 0.71 0.70
Colombia 0.58 0.56 0.64 0.70 0.76 0.59 0.57 0.56 0.45 0.46
Mexico 0.93 0.95 1.01 1.05 1.09 0.93 0.81 0.60 0.65 0.56
Peru 0.43 0.49 0.57 0.68 0.61 0.44 0.33 0.34 0.30 0.31
Venezuela 0.58 0.67 0.80 1.04 0.86 0.68 0.66 0.64 0.52 0.51
3.4
The Role of Human Capital
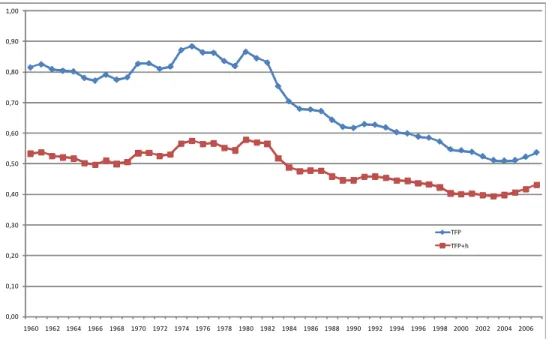
capital and labor as factors of production. In this paper, we include human capital in the production function, as has become standard in the growth and development accounting literature (see Klenow and Rodriguez-Clare (1997) and Hall and Jones (1999)). Figure 6 compares our results for TFP in Latin America relative to the US (TFP) with the ones we obtain when we disregard human capital and attribute di¤erences in relative human capital to relative TFP (TFP + h).
0,00 0,10 0,20 0,30 0,40 0,50 0,60 0,70 0,80 0,90 1,00
1960 1962 1964 1966 1968 1970 1972 1974 1976 1978 1980 1982 1984 1986 1988 1990 1992 1994 1996 1998 2000 2002 2004 2006 TFP
TFP+h
Figure 6: Latin America Relative TFP, with and without Human Capital in the Production Function (US=1)
Figure 6 shows that the inclusion of human capital in the production function makes a great di¤erence in the TFP calculations for Latin America. When we do not include human capital, following Cole et al. (2005)’s procedure, we obtain a value of 53% for Latin America relative TFP between 1960 and 1980. It then declines to reach 44% in the nineties and 43% in 2007. Since human capital in Latin America averaged less than 40% of US human
capital between 1960 and 1980,the fact that Cole et al. do not account for relative human
capital di¤erences and consequently attribute it to relative TFP leads them to signi…cantly
underestimate Latin America relative TFP until 1980.13 Moreover, they also underestimate
the decline in Latin America relative TFP since 1980, since Latin America relative human capital increased between 1980 and 2007.
Cole et al. (2005) argue that a large TFP gap between the US and Latin America remains after adjusting for human capital di¤erences. In order to support their claim, the authors argue that, after adjusting for human capital, Hall and Jones (1999) …nd an average productivity level of 58% of the US in 1988 for a comparable group of Latin American countries. They also report that Klenow and Rodriguez-Clare (1997) …nd a comparable Latin American relative productivity of 67%, using 1985 data and a di¤erent procedure to adjust for human capital. Taking the average of the two estimates gives a Latin American relative productivity of 62.5%.
However, Cole et al. do not take into account the fact that Hall and Jones and Klenow and Rodriguez-Clare calculate a measure of labor-augmenting productivity (LAP) instead of TFP. As is well known, relative TFP is always higher than relative LAP. If we computed TFP values based on Hall and Jones´ and Klenow and Rodriguez-Clare´s LAP values and production function parameters, the average Latin America relative TFP would be 77% in
the second half of the eighties.14 Since TFP in Latin America collapsed in the early eighties,
their measure of the relative TFP would be even larger in the seventies. Hence, the fact that we include human capital in the production function in large measure explains the di¤erences
between our results and those presented by Cole et al. (2005).15
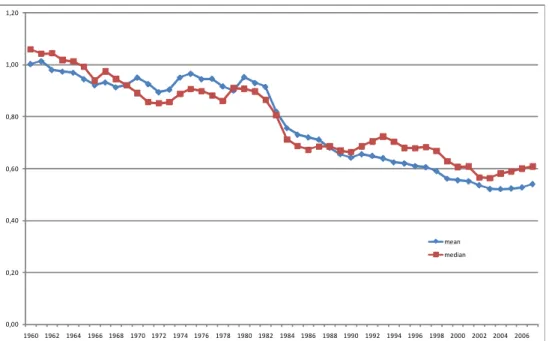
Due to the importance of human capital for TFP calculations in Latin America, we checked if our results depend on the schooling data that we used, obtained from Barro and Lee (2010). To verify the robustness of our results to the schooling series, in Figure 7 we present the results for relative TFP in Latin America when we use education data from Cohen and Soto (2007).
14Hall and Jones use a production function given by Y = K (AH)1
, where LAP = A and =
1=3. In this case relative TFP=(0:58)1 = (0:58)1 1=3 = 0:695. Klenow and Rodriguez-Clare use as the
production function Y =K H (AL)1
, where LAP =A; = 0:3 and = 0:28. In this case relative
TFP=(0:67)1 = (0:67)1 0:3 0:28 = 0:845. Taking the average between the two numbers, we obtain
relative TFP=0:77. We thank a referee for suggesting these calculations.
15A recent paper by Restuccia (2008) includes human capital in the production function and calculates
0,00 0,10 0,20 0,30 0,40 0,50 0,60 0,70 0,80 0,90 1,00
1960 1962 1964 1966 1968 1970 1972 1974 1976 1978 1980 1982 1984 1986 1988 1990 1992 1994 1996 1998 2000 2002 2004 2006 mean
median
Figure 7: Latin America Relative TFP, using Cohen and Soto (2007) Schooling Data (US=1)
Figure 7 con…rms the pattern documented in Figure 1. Mean and median TFP in Latin America corresponded to 81% and 80% of US TFP between 1960 and 1980, respectively. However, since the late seventies both the mean and the median TFP in Latin America have fallen continuously, declining to 57% and 63% of US TFP in 2007, respectively.
In this paper we follow the procedure in Bils and Klenow (2000) to construct a measure
of human capital. Hall and Jones (1999) used a di¤erent speci…cation, based on the following
formula: h=e (s), wheresdenotes years of schooling, as before, and (s) = 0:134:sifs 4,
0,00 0,20 0,40 0,60 0,80 1,00 1,20
1960 1962 1964 1966 1968 1970 1972 1974 1976 1978 1980 1982 1984 1986 1988 1990 1992 1994 1996 1998 2000 2002 2004 2006 mean
median
Figure 8: Latin America Relative TFP, with Hall and Jones (1999) Human Capital Methodology (US=1)
In the period 1960-1980, the mean and median Latin America TFP amounted to 94% of the U.S. TFP, so they were even higher than the values obtained using Bils and Klenow (2000)’s methodology. Mean and median relative TFP declined thereafter and were equal to
54% and 61%, respectively, in 2007.16
Our baseline human capital speci…cation does not control for di¤erences in the quality of education among countries. Even though there is some recent cross-country evidence on the quality of education based on students´ results in standardized tests, there is no time-series data available for our sample of Latin American countries during the period 1960-2007.
In order to provide some evidence on the e¤ect of quality of education on the observed measure of TFP, we use time-series data on the pupil-teacher ratio at the primary level
obtained from Lee and Barro (2001). They have data on the pupil-teacher ratio17 at
…ve-year intervals for our sample of 18 Latin American countries from 1960 to 2000.18 We follow
16Fernandez, Guner and Knowles (2005) estimated Mincer coe¢cients for a set of Latin American countries.
Their estimates are higher than 13% for most countries. This suggests that Latin America TFP relative to the US might be even higher before 1980.
17Lee and Barro (2001) also have data on government expenditure per student, but there are not enough
observations to allow us to construct a measure of quality of education for our sample and time period.
Caselli (2005)’s procedure to adjust the human capital stock for quality of education, where the latter is measured by the teacher-pupil ratio at the primary level. We use the following human capital speci…cation:
h=Ahe (s)
where Ah denotes the quality of education. The quality of education is assumed to be an
increasing function of the teacher-pupil ratio according to:
Ah =p p
where p is the teacher-pupil ratio and p is the elasticity of the quality of education with
respect to the teacher-pupil ratio. As in Caselli (2005), we assume that p = 0:5. For each
country, we focus on the teacher-pupil ratio in the year when the average worker attended school. To obtain this year, we estimate the age of the average worker using data from
LABORSTA, the dataset of the International Labor Organization (ILO).19 Then we assume
that children start primary school at the age of 6. To obtain the measure of the quality of
education corresponding to yeart, we use the observation for the primary teacher-pupil ratio
in year t age+ 6.
Figure 9 presents the results for relative TFP in Latin America when we adjust human capital for the quality of education. Since the quality of education in Latin America was lower than in the US throught the period, this measure of Latin America relative TFP is higher
than in our baseline case in every year.20 Speci…cally, between 1960 and 1980, the relative
mean and median Latin America TFP were 89% and 86%, respectively. The teacher-pupil ratio increased over time in both Latin America and the US, but faster in the latter, which implies that the quality of education in Latin America relative to the US decreased over time. This in turn results in a smaller decline of Latin America relative TFP in comparison
to our benchmark.21 In 2007, mean and median Latin America TFP were equal to 67% and
19There is data for the economically active population at 10-year intervals from 1950 to 2000. The data
is broken down in 5-year age intervals. As in Caselli (2005), in order to obtain the average age of a worker we weight the middle year of each interval by the fraction of the labor force in that interval. Data were interpolated linearly to obtain the values of the intermediate years.
20Since in the baseline case we did not adjust TFP for di¤erences in the quality of education between
Latin America and the US, the lower quality of education in Latin America was captured by a lower relative TFP.
21In our benchmark, the decline over time in the quality of education in Latin America relative to the US
71% of the US, respectively.
0,00 0,20 0,40 0,60 0,80 1,00 1,20
1960 1962 1964 1966 1968 1970 1972 1974 1976 1978 1980 1982 1984 1986 1988 1990 1992 1994 1996 1998 2000 2002 2004 2006 mean
median
Figure 9: Latin America Relative TFP, with Adjustment for the Quality of Education (US=1)
4
Conclusion
In this paper we have shown that at least until the late seventies the average Latin America economy was relatively productive, with a TFP level corresponding to 82% of the US. An-other stylized fact is that relative TFP fell sharply in Latin America after 1980 and reached 54% in 2007. We have shown that these patterns are also observed when we adjust TFP for the presence of natural resources.
However, if human capital is not included in the production function, we obtain a value of 53% for Latin America relative TFP between 1960 and 1980. It then declines and reaches 43% in 2007. Hence the inclusion of human capital in the production function makes a crucial di¤erence in TFP calculations for Latin America. We showed that this result is robust to the use of di¤erent sources of schooling data and human capital speci…cations. We also obtained similar results when we used data on pupil-teacher ratios to adjust human capital for quality of education.
the main cause for the relative poverty of the region. The main determinants of low output
per worker in the region were factors of production, namely physical and human capital.22
However, after the late seventies the TFP decline was the main explanation for Latin America stagnation.
The period between 1960 and 1980 was characterized by widespread government interven-tion and import-substituinterven-tion industrializainterven-tion in Latin America. These interveninterven-tions were associated with competitive barriers of di¤erent forms, including restrictions to international trade and targeted investment subsidies. The puzzle raised by the stylized facts documented in this paper is that, despite these distortionary policies, TFP in the region was high rela-tive to the US. Moreover, despite the adoption of market-oriented reforms since the eighties, TFP in Latin America declined relative to the U.S. between 1980 and 2007. We intend to investigate possible explanations for these facts in future research.
5
Appendix
5.1
List of Countries
Brazil, Mexico, Colombia, Argentina, Peru, Venezuela, Chile, Ecuador, Guatemala, Domini-can Republic, Bolivia, Honduras, El Salvador, Paraguay, Nicaragua, Costa Rica, Uruguay, Panama, Austria, Italy, Finland, Belgium, France, Norway, Iceland, Denmark, Germany, Netherlands, Sweden, Switzerland, Taiwan, Hong Kong, Korea, Singapore, Thailand, Japan, Ireland, United Kingdom, United States, Australia, Canada, New Zealand, Cyprus, Portu-gal, Spain, Greece, Turkey, Syria, Tunisia, Israel, Iran, Jordan, Malaysia, Indonesia, Pak-istan, India, Nepal, Papua New Guinea, Bangladesh, Philippines, Fiji, Barbados, Trinidad & Tobago, Guyana, Jamaica, Botswana, Lesotho, Mauritius, Malawi, Zimbabwe, Uganda, Tanzania, Kenya, Ghana, Cameroon, Togo, Senegal, Mozambique, Zambia, Niger, Central African Republic, South Africa and Congo.
22This is consistent with the evidence provided in Ferreira, Pessôa and Veloso (2008) that in the early
5.2
Relative TFP Adjusted for the Mineral Sector
Table A1: Relative TFP (U.S=1) - Adjusted for the Mineral Sector
1960 1965 1970 1975 1980 1985 1990 1995 2000 2005
Argentina 1.03 0.94 1.00 1.01 0.98 0.75 0.65 0.71 0.66 0.66
Brazil 0.90 0.92 1.04 1.35 1.42 1.03 0.92 0.78 0.64 0.59
Chile 0.68 0.62 0.72 0.59 0.77 0.56 0.64 0.81 0.76 0.76
Colombia 0.79 0.73 0.82 0.88 0.95 0.73 0.71 0.68 0.54 0.55
Mexico 1.09 1.09 1.13 1.15 1.18 1.01 0.87 0.64 0.69 0.60
Peru 0.51 0.56 0.64 0.74 0.66 0.48 0.37 0.38 0.34 0.34
Venezuela 0.63 0.73 0.88 1.11 0.92 0.73 0.71 0.68 0.56 0.55
5.3
Relative TFP Adjusted for the Agriculture, Forestry and
Fish-ing Sectors
Table A2: Relative TFP (U.S=1) - Adjusted for the Agriculture, Forestry and Fishing Sectors
1960 1965 1970 1975 1980 1985 1990 1995 2000 2005
Argentina 0.95 0.87 0.94 0.96 0.94 0.71 0.61 0.67 0.63 0.62
Brazil 0.79 0.81 0.96 1.27 1.35 0.97 0.87 0.74 0.61 0.56
Chile 0.68 0.62 0.73 0.60 0.79 0.58 0.65 0.81 0.79 0.78
Colombia 0.62 0.59 0.66 0.72 0.77 0.61 0.61 0.59 0.48 0.49
Mexico 0.95 0.96 1.02 1.06 1.11 0.95 0.82 0.61 0.66 0.57
Peru 0.48 0.54 0.61 0.71 0.66 0.48 0.35 0.37 0.32 0.33
5.4
Schooling: U.S. and Latin America (mean)
0 2 4 6 8 10 12 14
196019621964196619681970197219741976197819801982198419861988199019921994199619982000200220042006 Latin America
USA
Figure A1: Schooling in the U.S. and Latin America (1960-2007)
References
[1] Barro, R. and J. W. Lee, 2010. “A New Data Set of Educational Attainment in the
World, 1950-2010,” NBER Working Paper #15902.
[2] Bergoing, R., Kehoe, P., Kehoe, T. and R. Soto, 2002. "A Decade Lost and
Found: Mexico and Chile in the 1980s," Review of Economic Dynamics, 5: 166-205.
[3] Bils, M. and P. Klenow, 2000. “Does Schooling Cause Growth?,” American
Eco-nomic Review, 90(5): 1160-1183.
[4] Blyde, J. and E. Fernandez-Arias, 2006. "Why Does Latin America Grow More
Slowly?" in Blyde, J., Férnandez-Arias, E. and R. Manuelli, eds., Sources of Growth
in Latin America: What is Missing? Washington, DC: Inter-American Development
Bank.
[5] Bosworth, B. and S. Collins, 2003. “The Empirics of Growth: An Update,”
[6] Bugarin, M., Ellery Jr., R., Gomes, V. and A. Teixeira, 2007. "The Brazilian
Depression in the 1980s and 1990s," in Prescott, E. and T. Kehoe, eds., Great
Depres-sions of the Twentieth Century. Minneapolis: Federal Reserve Bank of Minneapolis.
[7] Caselli, F., 2005. “Accounting for Cross-Country Income Di¤erences,” in Aguion, P.
and S. Durlauf, eds., Handbook of Economic Growth, Elsevier North-Holland, vol. 1A:
679-741.
[8] Cohen, D. and M. Soto, 2007. "Growth and Human Capital: Good Data, Good
Results". Journal of Economic Growth 12 (1): 51-76.
[9] Cole, H. L., L. E. Ohanian, A. Riascos and J. A. Schmitz Jr., 2005. “Latin
America in the Rearview Mirror”. Journal of Monetary Economics, 52: 69-107.
[10] Fernandez, R., Guner, N. and J. Knowles, 2005."Love and Money: A Theoretical
and Empirical Analysis of Household Sorting and Inequality". Quarterly Journal of
Economics 120 (1): 273-344.
[11] Ferreira, P., Pessôa, S. and F. Veloso, 2008. “The Evolution of International
Output Di¤erences (1970-2000): From Factors to Productivity”.BE Journal of
Macro-economics 8 (1) (Topics), Article 3.
[12] Gollin, D., 2002. “Getting Income Shares Right,” Journal of Political Economy, 110 (2): 458-474.
[13] Hall, R.E. and C. Jones, 1999. “Why do Some Countries Produce so Much More
Output per Worker than Others?,” Quarterly Journal of Economics, February, 114:
83-116.
[14] Heston, A., Summers, R. and B. Aten, 2009. Penn World Table Version 6.3.
Cen-ter for InCen-ternational Comparisons of Production, Income and Prices at the University of Pennsylvania.
[15] Hopenhayn, H. A. and P.A. Neumeyer, 2006. "The Argentine Great Depression
1975-1990," in Blyde, J., Férnandez-Arias, E. and R. Manuelli, eds.,Sources of Growth
in Latin America: What is Missing? Washington, DC: Inter-American Development
[16] Klenow, P. and A. Rodríguez-Clare, 1997. “The Neoclassical Revival in Growth
Economics: Has it Gone Too Far?,” in Bernanke, B. and J. Rotemberg , eds., NBER
Macroeconomics Annual, Cambridge, MA: The MIT Press, 73-103.
[17] Kydland, F. and C. Zarazaga, 2002. "Argentina´s Lost Decade," Review of
Eco-nomic Dynamics, 5: 152-165.
[18] Lee, J. W. and R. Barro, 2001."Schooling Quality in a Cross-Section of Countries,"
Economica 68: 465-488.
[19] Loayza, N., Fajnzylber, P. and C. Calderón, 2005. Economic Growth in Latin
America and the Caribbean: Stylized Facts, Explanations, and Forecasts. Washington,
DC: The World Bank.
[20] Nehru, V. and A. Dhareshwar, 1993. “A New Database on Physical Capital Stock:
Sources, Methodology and Results,” Revista de Análisis Económico, 8: 37-59.
[21] Restuccia, D., 2008. “The Latin American Development Problem,” Working Paper.
University of Toronto.
[22] Restuccia, D., Yang, D. and X. Zhu, 2008. “Agriculture and Aggregate
Produc-tivity: A Quantitative Cross-Country Analysis,” Journal of Monetary Economics 55:
234-250.
[23] Timmer, M. and G. de Vries, 2009. "Structural Change and Growth Accelerations