http://dx.doi.org/10.1590/2317-1545v40n1182375 Licence Creative Commons CC BY 4.0
Spatial variability in soybean seeds quality and in chemical attributes
of the soil of a production field in the Brazilian Cerrado
11Submitted on 07/06/2017. Accepted for publication on 11/07/2017. 2Empresa Matogrossense de Pesquisa, Assistência e Extensão Rural S/A., 78.068-690 - Cuiabá, MT, Brasil.
3Departamento de Fitotecnia e Fitossanidade da Faculdade de Agronomia, Medicina Veterinária e Zootecnia da Universidade Federal de Mato Grosso – FAMEV/UFMT, 78.060-900 - Cuiabá, MT, Brasil.
*Corresponding author <[email protected]>
Danielle Helena Müller
2*, Elisangela Clarete Camili
3, Walcylene Lacerda Matos
Pereira Scaramuzza
3, Maria Cristina de Figueiredo e Albuquerque
3ABSTRACT - The objective of this study was to evaluate the spatial variability in soybean seeds quality and in soil chemical
attributes of a production field. Data were collected at 138 georeferenced points of a soybean production property located in
Santo Antônio de Leverger - MT. Soil related variables, such as phosphorus, potassium, calcium, magnesium, and organic matter (OM) contents, pH, cation exchange capacity (CEC) and base saturation (V%) were evaluated. On the other hand, yield, one thousand seed mass, size, germination, emergence in seedbed, electrical conductivity, accelerated aging and tetrazolium
reaction were evaluated as seed variables. The data were submitted to descriptive and geostatistical analysis, and the fit
semivariogram parameters were used to elaborate spatial distribution maps of the analyzed variables. After the analysis, it was possible to conclude that there was spatial variability in the evaluated attributes for both seeds and soil related variables,
indicating that the soybean seed production area can be divided into management zones, which allows the definition of areas to be harvested or discarded within a field of seed production.
Index terms: seed production, soil fertility, geostatistics, spatial distribution.
Variabilidade espacial da qualidade de sementes de soja e dos atributos
químicos do solo em campo de produção no Cerrado
RESUMO - Objetivou-se avaliar a variabilidade espacial da qualidade de sementes de soja e dos atributos químicos do solo em campo de produção. Os dados do experimento foram coletados em 138 pontos georreferenciados em propriedade produtora de sementes de soja localizada no município de Santo Antônio de Leverger - MT. Para as variáveis relacionadas ao solo, avaliou-se os teores de fósforo, potássio, cálcio, magnésio, matéria orgânica (MO), o pH, a capacidade de troca catiônica (CTC) e a saturação por bases (V%). Nas sementes, avaliou-se produtividade, massa de 1000 sementes, tamanho, germinação, emergência em canteiro, condutividade elétrica, envelhecimento acelerado e tetrazólio. Os dados foram submetidos à análise descritiva e geoestatística, e os parâmetros dos semivariogramas ajustados foram utilizados para elaboração de mapas de distribuição espacial das variáveis analisadas. Após análise, conclui-se que há variabilidade espacial nos atributos avaliados nas sementes e no solo, indicando que a área para produção de sementes de soja pode ser dividida em zonas de manejo, que
permite a definição de áreas a serem colhidas e descartadas dentro de um campo de produção de sementes.
Termos para indexação: produção de sementes, fertilidade do solo, geoestatística, distribuição espacial.
Introduction
The heterogeneity of edaphoclimatic conditions is common in crops and it affects differently their development and yield.
Usually, this variability is not random and presents spatial dependence caused by various factors (Reichert et al., 2008).
on farming management, since the uniform treatment of cultivated areas provides inconsistent results, capable of altering crop yields and, consequently, of reducing the environmental and financial sustainability (Silva and Lima, 2013).
Precision agriculture tools are useful to show the difference between environments that plants may be submitted to in a crop (Amado et al., 2007), allowing the creation of spatial distribution maps of the characteristics found in the cultivation place.
In soybean seed production, experiments related to fertilization and plant nutrition are scarce, so that the use of fertilizers is carried out based on the results obtained in grain production (Golo et al., 2009). Thus, seeds quality is not uniform in the production fields, because they are exposed to a series of factors that influence the final quality.
Therefore, the study of the variability in the behavior of soil attributes and of the seed quality in the production field deserves attention (Mattioni et al., 2011), and several authors have been investigating the effects of this variation (Faraco et al., 2008; Lima et al., 2010; Santos et al., 2012; Mondo et al., 2012).
In this context, the objective of this work was to evaluate the spatial distribution of soybean seed quality and the soil chemical status in the production field.
Material and Methods
The study was carried out in a soybean seed production
field in the city of Santo Antônio de Leverger, state of Mato
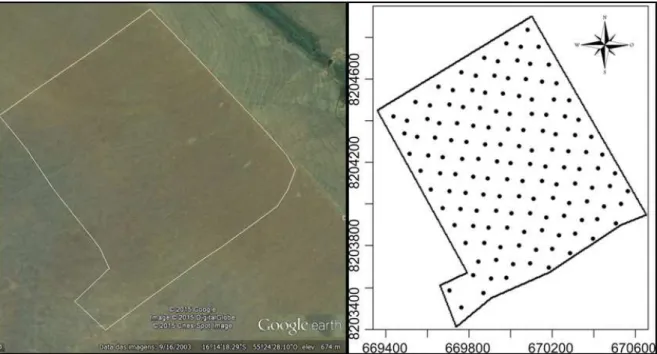
Grosso (MT), located at 16°14’ S latitude, 55°24’ W longitude, and 674 m of altitude, within an area of 80 ha, in the 2014/2015 crop year. The predominant climate in the experimental area is the Aw, according to Köppen’s classification (1948), characterized by a dry period from May to September, and rainy season from October to April, with average annual temperatures of 23.1 ºC and annual precipitation of 2.136 mm. The soil is characterized as Red Dystrophic Typical Latosol, with medium/clay texture (Embrapa, 2013).
The sampling grid constituted of 138 spatialized points, 130 m away from each other in each collecting line, and these lines were 50 m distant from one another, as showed in Figure 1. The points were defined based on a methodology of systematic sampling, following a regular grid, in which points were marked in a predefined route based on the contour of the production field (Mattioni et al., 2011).
Soil samples were collected at 0-20 cm depth, using a Dutch auger to determine potassium (K), phosphorus (P), calcium (Ca), magnesium (Mg) and organic matter (OM)
contents, pH, base saturation (%V) and cation exchange
capacity (CEC) (Embrapa, 2011).
Sowing was performed with 0.45-m space between lines, linear density of 16 plants m-1, and final population of 348.000
plants ha-1. The soybean (Glycine max (L.) Merrill) cultivar
TMG 1179 RR was used.
To determine seeds quality, harvest was performed in each georeferenced point, by collecting all plants with 1 m
Figure 1. Georeferenced grid in the production field with 138 sampling points for the collection of soybean (Glycine max L.)
of length from three sowing lines. After harvesting, soybean seeds were manually podded to obtain the samples, which were then submitted to natural drying process.
Soil and seed samples were taken to the Seed Laboratory of FAAZ/UFMT, where they were stored in plastic bags (soil) or paper bags (seeds), in cold chamber at 18±2 ºC and 63±4% RU, during the whole testing period.
For the seed quality determination, the following tests were performed: one thousand seed mass, standard germination test and emergence in seedbed, with four replications of each
sampling point, according to the Rules for Seed Testing
(Brasil, 2009); yield (Weber, 2005); electrical conductivity (Vieira and Krzyzanowski, 1999); accelerated aging (Marcos-Filho, 1999); and tetrazolium test (França-Neto et al., 1998). Seed classification by size (sieve analysis) was also carried out, by using a set of sieves in the following aperture diameter and disposition order (from top to bottom): sieve 1 – 7.5 mm; sieve 2 – 7.0 mm; sieve 3 – 6.5 mm; sieve 4 – 6.0 mm; sieve 5 – 5.5 mm; sieve 6 – 5.0 mm and bottom pan. One subsample of 100g of seeds was taken from each one of the 138 samples and sieved through the set. Then, seeds retained in each sieve were weighed, and the results were expressed as percentage (%), a methodology adapted from the guidelines proposed by Mattioni et al. (2011).
The results were submitted to descriptive statistical and geostatistical analyses. The data were analyzed using experimental semivariogram with classic estimator, and the semivariogram model was chosen according to the error estimate through cross-validation and fit to the Ordinary Least Square (OLS) method. The spatial dependence was estimated according to Cambardella et al. (1994). Once the spatial dependence was verified, the ordinary kriging interpolation method was performed for the elaboration of the maps. The geostatistical analysis was done with the software R, geoR pack, version 3.2.0. (Diggle and Ribeiro, 2007).
Results and Discussion
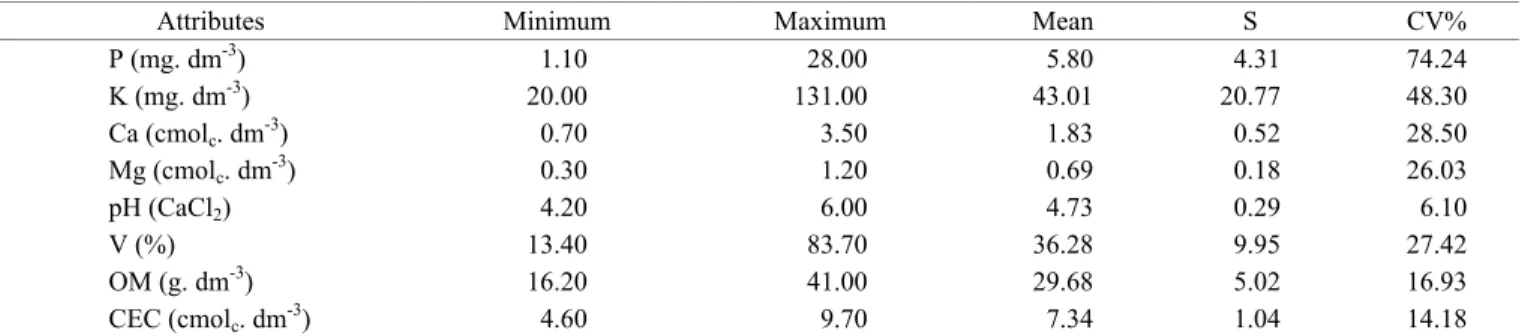
The descriptive analysis of the soil attributes is shown in Table 1. The soil chemical characteristics were interpreted according to the classification proposed by Souza and Lobato (2004). The characteristics that presented data homogeneity,
based on the coefficient of variation, were pH (CaCl2), which
ranged from 4.20 to 6.00, being classified as low and very high,
respectively; CEC, which ranged from 4.60 to 9.70 cmolc dm
-3,
being classified as low and high, respectively; and organic matter content, which varied from 16.20 to 41.00 g. dm-3, therefore
classified as medium and high, respectively. These conditions prove the great variability in chemical characteristics of Latosol of the Cerrado (Eberhardt et al., 2008).
The amplitude of values observed for P, K, Ca, Mg contents and base saturation (%V) (Table 1) may be related to the variability in physicochemical, granulometric and mineralogical characteristics of the evaluated soil, a common fact, already verified in other studies (Artur et al., 2014; Eberhardt et al., 2008; Souza et al., 2008). Latosols represent approximately 45.7% of the soils in the Cerrado region, and they are described as heavily weathered, deep, non-hydromorphic, with clay content between 15 and 80% and low nutrient reserves available for plants. Over 95% of them are dystrophic or alic and present pH value between 4.0 and 5.5, low cation exchange capacity, high anion adsorption capacity (especially phosphate) and low available phosphorus content (Eberhardt et al., 2008).
The results, mainly for phosphorus (mean value of 5.80 mg.dm-3) (Table 1), can be an indicative of high acidity in
certain spots of the area, once this chemical element is strongly influenced by the pH. This is confirmed by the pH mean value of 4.7, observed in the studied soil. In acid soils, phosphorus forms phosphates with iron, aluminum and manganese oxides, which reduces its availability due to the low solubility of these compounds (Silva and Lima, 2013).
Attributes Minimum Maximum Mean S CV%
P (mg. dm-3) 1.10 28.00 5.80 4.31 74.24
K (mg. dm-3) 20.00 131.00 43.01 20.77 48.30
Ca (cmolc. dm -3
) 0.70 3.50 1.83 0.52 28.50
Mg (cmolc. dm-3) 0.30 1.20 0.69 0.18 26.03
pH (CaCl2) 4.20 6.00 4.73 0.29 6.10
V (%) 13.40 83.70 36.28 9.95 27.42
OM (g. dm-3) 16.20 41.00 29.68 5.02 16.93
CEC (cmolc. dm-3) 4.60 9.70 7.34 1.04 14.18
Table 1. Descriptive statistics of the attributes of soil with gradient of texture, collected at 138 sampling points in a soybean seed (Glycine max L.) growing area. Santo Antônio de Leverger, MT.
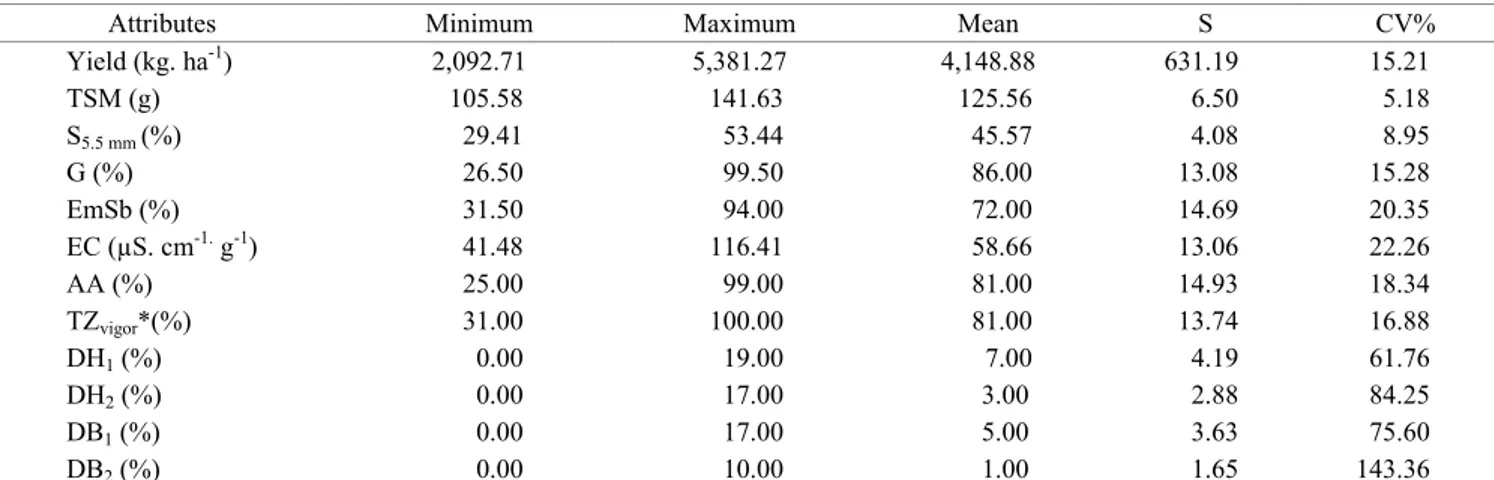
The descriptive analysis of the seed quality attributes is exhibited in Table 2. The characteristic with data homogeneity was the yield, which presented mean value of 4,148.88 kg.
ha-1, and coefficient of variation of 15.21%. The yield value
was higher than the national mean of 3,364 kg. ha-1, obtained
in the 2016/2017 crop year (CONAB, 2017). Assunção and Frasson (2013) evaluated the agronomical characteristics of 51 soybean cultivars sowed in two seasons, in the city of
Diamantino (MT), and obtained mean yield of 3,904 kg. ha-1
for the cultivar TMG 1179 RR.
The mean value of one thousand seed mass was 125.56 g, and the coefficient of variation was 5.18% (Table 2). Assunção and Frasson (2013) obtained mean value of 110.58 g for this characteristic for the soybean cultivar TMG 1179RR.
Among the analyzed seed sizes, the biggest proportion (45.57%) was retained by the 5.5-mm-diameter sieve (Table 2). Pádua et al. (2010), in order to evaluate the influence of seed size on physiological quality and yield of soybean crops, verified significant differences between the average results of cultivars and the sieves. There was a direct relation between seed size and yield: larger seeds (5.0- and 6.0-mm sieves) produced more in comparison to smaller seeds (4.0-mm sieve), which generated plants with smaller height and lower yield. The authors concluded that there is a beneficial effect of the seed size on soybean yield, i.e., the larger the size, the better the crop yield, and seeds with different sizes present differences in physiological quality.
The mean germination value was 86% (Table 2), above the minimum percentage required for soybean seeds commercialization in Brazil, which is 80% (Brasil, 2009). Therefore, it is possible to distinguish the zones that presented satisfactory physiological quality, and this can be an important
information to define the destination of these seeds in the processing unity, or even to proceed the partial discard in the field, eliminating zones of inferior physiological quality (Mattioni et al., 2011). Thus, it is possible to identify, through the proposed analyses, tools that allow the distinction of specific places and the optimization of the production means and management that can help to obtain seeds lots with high quality standards and that will consequently have a better performance in the field. In their experiments, Assunção and Frasson (2013) obtained 90% of germination for the cultivar TMG 1179RR.
The mean vigor data, determined by the accelerated aging and tetrazolium tests, were 81% in both cases, and the coefficients of variation were 18.34 and 16.88%, respectively (Table 2). This confirms that seeds kept their germination conditions, even after being submitted to stress, like in the accelerated aging test, which evidences their physiological quality.
The characteristics of the seeds that presented data amplitude (CV above 20%) (Table 2) were the emergence in seedbed, which ranged from 31.50 to 94.00%; the electrical
conductivity, which ranged from 41.48 to 116.41 µS.cm-1.
g-1; the deterioration caused by humidity, assessed by the
tetrazolium test at 1-8 (DH1) and 6-8 (DH2) levels, which ranged from 0 to 19% and from 0 to 17%, respectively; and the damages caused by stink bugs, also evaluated by the tetrazolium test at 1-8 (DB1) and 6-8 (DB2) levels, which varied from 0 to 19% and from 0 to 10%, respectively.
During physiological maturity, the high levels of water content in the seeds, pods and plants prevent mechanized harvesting from being done. Thus, seeds must remain in the field until they reach the adequate water content (Terasawa et
Table 2. Descriptive statistics of quality attributes of soybean seeds (Glycine max L.) harvested at 138 sampling points in an area with gradient of texture. Santo Antônio de Leverger, MT.
TSM – one thousand seed mass; S5.5 - 5.5-mm- diameter sieve; G – germination; EmSb – emergence in seedbed; EC – electrical conductivity; AA – accelerated
aging; TZvigor – vigor determined by tetrazolium test; DH1 – deterioration due to humidity at the levels 1-8; DH2 – deterioration due to humidity at the levels 6-8; DB1 – damages caused by stink bugs at the levels 1-8; DB2 – damages caused by stink bugs at the levels 6-8; S – standard deviation; CV – coefficient of variation.
Attributes Minimum Maximum Mean S CV%
Yield (kg. ha-1) 2,092.71 5,381.27 4,148.88 631.19 15.21
TSM (g) 105.58 141.63 125.56 6.50 5.18
S5.5 mm (%) 29.41 53.44 45.57 4.08 8.95
G (%) 26.50 99.50 86.00 13.08 15.28
EmSb (%) 31.50 94.00 72.00 14.69 20.35
EC (µS. cm-1. g-1) 41.48 116.41 58.66 13.06 22.26
AA (%) 25.00 99.00 81.00 14.93 18.34
TZvigor*(%) 31.00 100.00 81.00 13.74 16.88
DH1 (%) 0.00 19.00 7.00 4.19 61.76
DH2 (%) 0.00 17.00 3.00 2.88 84.25
DB1 (%) 0.00 17.00 5.00 3.63 75.60
al., 2009). Mainly due to the alternating cycles of humid and dry conditions and to the hot environment in the post-maturity, among other aspects, the quality of soybean seeds from Brazilian tropical regions has been compromised by high rates of damages, especially those related to deterioration caused by humidity. Soybean seeds, due to their morphological and chemical characteristics, are very sensitive to environmental factors (Terasawa et al., 2009; Forti et al., 2010).
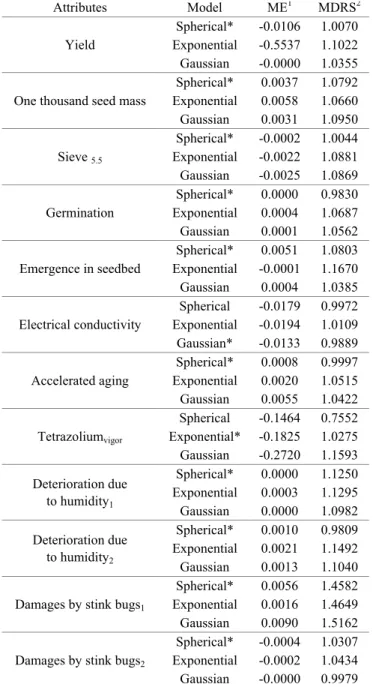
Tables 3 and 4, respectively, present the coefficients of quality of the semivariograms and models (fit and chosen, according to the cross-validation) obtained by geostatistical analysis for the evaluated characteristics of the soil and of the seeds.
The estimates of the mean error (ME) and of the mean square of the standard deviation (MRSD), with positive and negative values, are close to the indicated values, according to which ME must be close to 0, and MRSD must be close to 1
Table 3. Coefficients of quality of the semivariograms, and fit and chosen models for the attributes of soil with gradient of texture, collected at 138 sampling points in a soybean seed (Glycine max L.) growing area. Santo Antônio de Leverger, MT.
Attributes Model ME1 MDRS2
Phosphorus
Spherical* 0.0074 1.2909 Exponential 0.0080 1.2972 Gaussian 0.0084 1.2879 Potassium
Spherical* 0.0000 1.0346 Exponential 0.0771 1.1591 Gaussian 0.0002 1.0373 Calcium
Spherical -0.0003 0.9264 Exponential -0.0001 0.9502 Gaussian* -0.0003 0.9655 Magnesium
Spherical -0.0000 0.9464 Exponential -0.0000 0.9540 Gaussian* -0.0000 0.9638 pH CaCl2
Spherical* 0.0000 0.9829 Exponential 0.0004 0.9781 Gaussian 0.0003 0.9909 Base saturation
Spherical 0.0023 0.9428 Exponential* 0.0190 0.9833 Gaussian 0.0191 0.9739 Organic matter
Spherical -0.0360 1.0867 Exponential -0.0386 1.0830 Gaussian* -0.0274 1.0765 Cation Exchange capacity
Spherical -0.0063 1.0508 Exponential -0.0065 1.0326 Gaussian* -0.0049 1.0484 1ME= mean error; 2MSDR = mean square of the standard deviation;
*Semivariogram model chosen after fit, and according to the most adequate values of ME and MSDR, except for those with lack-of-fit.
Table 4. Coefficients of quality of the semivariograms, and fit and chosen models for the attributes of soybean seeds (Glycine max L.) grown in soil with gradient of texture, collected at 138 sampling points. Santo Antônio de Leverger, MT.
Attributes Model ME1 MDRS2
Yield
Spherical* -0.0106 1.0070 Exponential -0.5537 1.1022 Gaussian -0.0000 1.0355 One thousand seed mass
Spherical* 0.0037 1.0792 Exponential 0.0058 1.0660 Gaussian 0.0031 1.0950 Sieve 5.5
Spherical* -0.0002 1.0044 Exponential -0.0022 1.0881 Gaussian -0.0025 1.0869 Germination
Spherical* 0.0000 0.9830 Exponential 0.0004 1.0687 Gaussian 0.0001 1.0562 Emergence in seedbed
Spherical* 0.0051 1.0803 Exponential -0.0001 1.1670 Gaussian 0.0004 1.0385 Electrical conductivity
Spherical -0.0179 0.9972 Exponential -0.0194 1.0109 Gaussian* -0.0133 0.9889 Accelerated aging
Spherical* 0.0008 0.9997 Exponential 0.0020 1.0515 Gaussian 0.0055 1.0422 Tetrazoliumvigor
Spherical -0.1464 0.7552 Exponential* -0.1825 1.0275 Gaussian -0.2720 1.1593 Deterioration due
to humidity1
Spherical* 0.0000 1.1250 Exponential 0.0003 1.1295 Gaussian 0.0000 1.0982 Deterioration due
to humidity2
Spherical* 0.0010 0.9809 Exponential 0.0021 1.1492 Gaussian 0.0013 1.1040 Damages by stink bugs1
Spherical* 0.0056 1.4582 Exponential 0.0016 1.4649 Gaussian 0.0090 1.5162 Damages by stink bugs2
Spherical* -0.0004 1.0307 Exponential -0.0002 1.0434 Gaussian -0.0000 0.9979 1ME= mean error; 2MSDR = mean square of the standard deviation; *
Semivariogram model chosen after fit, and according to the most adequate values of ME and MSDR, except for those with lack-of-fit. Deterioration due
(Esri, 2001). This provides consistent information on the tool used to fit the semivariograms to the tested models.
The geostatistical analysis outcome indicates that all soil attributes presented spatial dependence in the studied layers (0-10 and 10-20 cm), and were fit to spherical, exponential and Gaussian models (Table 3). Geostatistical works have used these models to fit semivariograms to soil attributes (Cambardella et al., 1994; Reichert et al., 2008; Zanão Junior et al., 2010; Negreiros Neto et al., 2014).
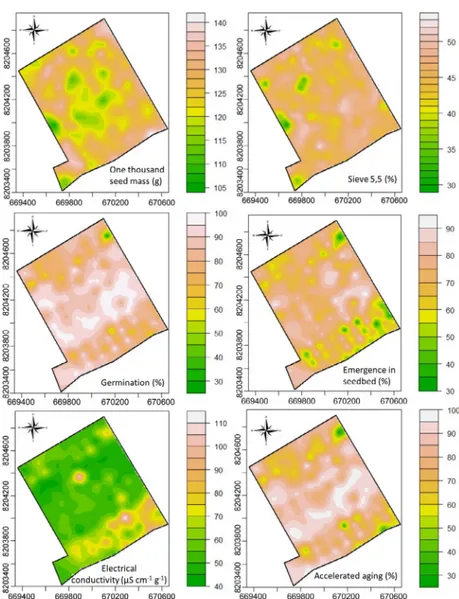
From the fit semivariograms, an ordinary kriging interpolation by points was performed to estimate the undetermined values and to elaborate the themed maps (Figures 2, 3, 4 and 5) for each attribute that presented spatial dependence. Through the analysis of the maps, it was possible to perceive tendencies in certain attributes, in the studied area, which present higher or smaller concentration in specific places. According to Artur et al. (2014), spatial dependence maps allow to locate areas with problems, and to test the efficiency of practices used to solve them. So, they can efficiently assist in the identification and establishment of management zones in soybean crops that allow the implementation of differentiated treatments, according to the
specific needs of the soil and the plants.
The maps generated after interpolation of the data on soil chemical attributes are shown in Figures 2 and 3. As for phosphorus and potassium (Figure 2), an inverse occurrence was observed in relation to the highest concentration of these nutrients. Phosphorus was found in larger quantity in the southwest region of the field (where there is more sand), whereas potassium happened in larger amount in the north region (with more clay). It is worth mentioning that, by the classification of Souza and Lobato (2004), phosphorus levels
are low in most of the field, with a 10 mg. dm-3 mean, and
potassium level is adequate, with approximately 60 mg. dm-3.
Batistella Filho et al. (2013), in a study on fertilization with phosphorus and potassium for soybean seeds production and quality, concluded that the phosphate fertilization increases yield and does not affect the physiological quality of soybean seeds produced, even in soils with very little phosphorus available. In its turn, fertilization with potassium does not affect the yield nor alter soybean seeds vigor, but can improve germination in soil with medium levels of this nutrient.
Calcium and magnesium had a similar distribution (Figure 2), occurring randomly all over the area. Calcium content ranged from
0.70 to 3.5 cmolc dm-3, while magnesium content varied from 0.30
to 1.20 cmolc dm-3. Values below 1.5 cmol c dm
-3, for calcium, and
0.5 cmolc dm-3, for magnesium, are considered low for Latosols,
according to Souza and Lobato (2004).
Base saturation (V%) (Figure 3) presented great discontinuity, following a space distribution tendency similar to that observed for pH, calcium, and magnesium, and it ranged from low (<20%) to very high (>71%), according to Souza and Lobato (2004). Thus, the levels of nutrients do not have the same spatial patterns, which shows lack of stability in the area.
Soil CEC values depend on the textural class, type of clay minerals, and organic matter content. Thus, clayey soils present CEC values higher than sandy soils (Brady, 1989). This behavior was observed in the present work (Figure 3), in which CEC values considered very high (>9 cmolc.dm-3) were
obtained in plot regions where the clay content was greater (higher altitude regions). However, it is important noticing that values considered adequate for medium-textured soils (>7 cmolc.dm-3) were also verified in sandier regions of the plot.
Similar to the CEC, the organic matter contents of the soil (Figure 3) obtained in the majority of the field were within the range considered as moderate to high (>29 g. dm-3) for soils
with texture varying between medium and clay.
The physiological quality of soybean seeds showed spatial variability in the studied field (Figures 4 and 5). In the formation process, soybean seeds depend on several factors related to the climate, the soil and the plant. Studies demonstrated that these factors do not have a uniform influence, subjecting the plants to distinct conditions during the productive cycle, even if within the same field (Mattioni et al., 2011).
A consequence of this is the heterogeneity on the physiological quality within a lot of soybean seeds, since the seeds come from various regions of the field, or even from different fields. Therefore, the sampling methodology can become inefficient and compromise the average sample representativeness in large lots and, consequently, all the analytical results based on this sample. One way to minimize this effect may be the reduction of the maximum lot size, supported by the knowledge of the spatial variability of the physiological quality in the field, which allows the formation of more homogeneous lots.
Germination, emergence in seedbed and seed vigor showed a tendency of greater values in the middle part of the studied area (Figures 4 and 5). The superior part and, mainly,
the inferior-right part of the plot concentrated the points where the seeds presented the lowest vigor (<70%), according to the tetrazolium test (Figure 5). In this case, a lower germination was expected (<80%) and, consequently, a lower emergence in seedbed (<70%) (Figure 4).
It is worth noticing that the seedling emergence test was carried out in an environment without soil moisture nor temperature control, which may have influenced the seed quality potential, estimated by the germination test.
The fact that the emergence in seedbed occurred in a lower percentage in the lower, tending to right part of the plot is directly related to the behavior detected in the electrical conductivity test, which had higher values in this strip of land of the production field. In addition, the behavior of the seed germination index was inversely proportional to the one thousand seed mass and the accelerated aging, in the central
strip of the plot (Figure 4).
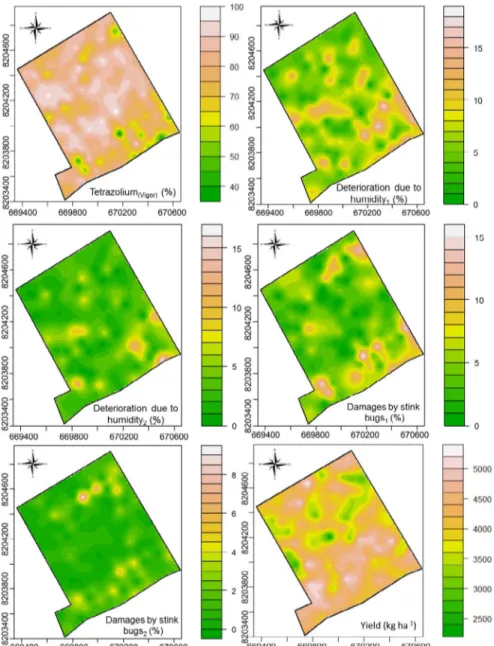
Deterioration caused by humidity occurred in a more dispersed way over the area, a fact that can be partially explained due to harvesting and seed sampling conditions, once the material was collected under rainfall and manually podded. However, then they were stored in cold chamber for a short time, until the analyses were performed.
The kriging map of seed damages shows that both deterioration due to humidity and the injuries caused by stink bugs, especially at the levels 6 to 8, occurred in a controlled way in a great part of the area, with more intense spots, in which the damage incidence was greater than 5% (Figure 5).
As stated by França-Neto et al. (1998), the percentages of mechanical damage, deterioration due to humidity, and damage by stink bugs at the levels 6 to 8 indicate the percentage of viability loss caused by these factors. According
to their influence on seed quality, they can be considered as a non-restrictive (inferior to 6%), a serious problem (between 7 to 10%), or a very serious problem (above 10%).
It is worth noticing that the seed vigor, assessed through the tetrazolium test (Figure 5), was maintained in most part of the production field within the range considered as high (between 75 and 84%) and very high (above 85%) (França-Neto et al., 1998).
As for the seed yield behavior, the land strip with the highest yield was concentrated at the inferior part of the plot (Figure 5). It is important to highlight that most of the area within the region with the highest yield produced seeds with germination rates between 80 and 90% (Figure 4).
In practice, the yield in the studied area lacked uniformity greatly, with values ranging from 2,092.71 to 5,381.27 kg.ha-1
(Table 2). Spatial variability of yield in soybean crops has already been observed in other studies. In a soybean seed production field of 60.6 ha, Mattioni et al. (2011) verified a difference greater than 1,500 kg between the highest and the lowest points of productivity. In addition to the spatial variability, Amado et al. (2007) also observed temporal variability in the yield of soybean crops over three harvests. During this period, the authors obtained coefficients of variation of 12, 18 and 24%, and average productivities of 3,209; 3,281 and 2,210 kg. ha-1.
Conclusions
Spatial patters were identified for the characteristics evaluated of soil and seeds, allowing to map areas with different physiological quality and nutritional conditions. This makes possible to define areas to be harvested or discarded within a field of seed production, through management zones.
Acknowledgements
To CAPES, for the doctorate scholarship, and to FACS, for financially support this research.
References
AMADO, T.J.C.; PONTELLI, C.B.; SANTI, A.L.; VIANA, J.H.M.; SULZBACH, L.A.S. Variabilidade espacial e temporal
da produtividade de culturas sob sistema plantio direto. Pesquisa Agropecuária Brasileira, v.42, p.1101-1110, 2007. http://www. alice.cnptia.embrapa.br/bitstream/doc/126261/1/42n08a06.pdf
ARTUR, A.G.; OLIVEIRA, D.P.; COSTA, M.C.; ROMERO, R.E.; SILVA, M.V.; FERREIRA, T.O. Variabilidade espacial dos atributos
químicos do solo, associada ao microrrelevo. Revista Brasileira de Engenharia Agrícola e Ambiental, v.18, n.2, p.141-149, 2014. http:// www.scielo.br/pdf/rbeaa/v18n2/a03v18n2.pdf
ASSUNÇÃO, P. S.; FRASSON, D. B. Avaliação do comportamento de cultivares de soja semeadas em 2 épocas na região Parecis de Mato Grosso. P.A. Consultoria Agronômica, Pesquisa & Agricultura de Precisão. 2013. 33p. (Relatório Técnico). http://www. paconsultoriaagronomica.com.br/uploads/Resultados%20de%20 Pesquisa/Relatorio%20Tecnico%20-%20CULTIVARES.pdf.
BATISTELLA FILHO, F.; FERREIRA, M.E.; VIEIRA, R.D.; CRUZ, M.C.P.; CENTURION, M.A.P.C.; SYLVESTRE, T.B.; RUIZ, J.G.C.L. Adubação com fósforo e potássio para produção e
qualidade de sementes de soja. Pesquisa Agropecuária Brasileira,
v.48, p.783-790, 2013. http://www.scielo.br/pdf/pab/v48n7/11.pdf BRASIL. Ministério da Agricultura, Pecuária e Abastecimento.
Regras para Análise de Sementes. Ministério da Agricultura, Pecuária e Abastecimento. Secretaria de Defesa Agropecuária. Brasília: MAPA/ACS, 2009. 395p. http://www.agricultura.gov.br/assuntos/ insumos-agropecuarios/arquivos-publicacoes-insumos/2946_ regras_analise__sementes.pdf
BRADY, N.C. Natureza e propriedades dos solos. 7.ed. Rio de
Janeiro: Freitas Bastos, 1989.898p.
CAMBARDELLA, C.A.; MOORMAN, T.B.; NOVARK, J.L.; PARKIN, T.B.; KARLEN, D.L.; TURCO, R.F.; KONOPKA, A.E.
Field-scale variability of soil properties in Central Iowa soils. Soil Science Society of America Journal, v.58, p.1501-1511, 1994. https://pubag.nal. usda.gov/pubag/downloadPDF.xhtml?id=18168&content=PDF
CONAB - Companhia Nacional de Abastecimento. Acompanhamento de safra brasileira: grãos, décimo segundo levantamento. Brasília: Conab, 2017. (Companhia Nacional de Abastecimento). http://www. conab.gov.br/OlalaCMS/uploads/arquivos/17_09_12_10_14_36_ boletim_graos_setembro_2017.pdf
DIGGLE, P.J.; RIBEIRO J.R.P. Model-based geostatistics. USA: Springer Series in Statistics, 2007. 227p.
EBERHARDT, D.N.; VENDRAME, P.R.S.; BECQUER, T.; GUIMARÃES, M.F. Influência da granulometria e da mineralogia
sobre a retenção do fósforo em Latossolos sob pastagens no cerrado.
Revista Brasileira de Ciência do Solo, v.32, p.1009-1016, 2008. http://www.scielo.br/pdf/rbcs/v32n3/a10v32n3
EMBRAPA – Empresa Brasileira de Pesquisa Agropecuária. Centro Nacional de Pesquisas de Solos. Manual de métodos de análises de solo. In: (Ed.). 2.ed. Rio de Janeiro, 2011. 230p.
EMBRAPA – Empresa Brasileira de Pesquisa Agropecuária. Sistema
brasileiro de classificação de solos. 3.ed. Brasília, 2013. 353p.
ESRI. Using ArcGIS Geostatistical Analyst – GIS by ESRI. Redlands, CA: ESRI, 2001. http://downloads2.esri.com/support/ documentation/ao_/Using_ArcGIS_Geostatistical_Analyst.pdf
FARACO, M.A.; URIBE-OPAZO, M.A.; SILVA, E.A.A.; JOHANN, J.A.; BORSSOI, J. A. Seleção de modelos de variabilidade espacial
para elaboração de mapas temáticos de atributos físicos do solo e produtividade da soja. Revista Brasileira de Ciências do Solo, v.32, p.463-476, 2008. http://www.scielo.br/pdf/rbcs/v32n2/01.pdf
FORTI, V.A.; CICERO, S.M.; PINTO, T.L.F. Avaliação da evolução
de danos por “umidade” e redução do vigor em sementes de soja, cultivar TMG113 RR, durante o armazenamento, utilizando imagens
de raios X e testes de potencial fisiológico. Revista Brasileira de Sementes, v.32, p.123-133, 2010. http://www.scielo.br/pdf/rbs/ v32n3/v32n3a14.pdf
FRANÇA-NETO, J. B.; KRZYZANOWSKI, F. C.; COSTA, N. P.
O teste de tetrazólio em sementes de soja. Londrina: EMBRAPA-CNPSo, 1998. 72p. (EMBRAPA-CNPSo. Documentos, 116). https:// www.agrolink.com.br/downloads/TRETRAZ%C3%93LIO.pdf KÖPPEN, W. Climatologia: con un estudio de los climas de La tierra. México: Fondo de Cultura Econômica, 1948. 479p.
GOLO, A.L.; KAPPES, C.; CARVALHO, M.A.C.; YAMASHITA, O.M. Qualidade das sementes de soja com a aplicação de diferentes
doses de molibdênio e cobalto. Revista Brasileira de Sementes, v.31, p.40-49, 2009. http://www.scielo.br/pdf/rbs/v31n1/a05v31n1.pdf
LIMA, J.S.S; OLIVEIRA, R.B.; ROCHA, W.; OLIVEIRA, P.C.; QUARTEZANI, W.Z. Análise espacial de atributos químicos do solo
e da produção da cultura pimenta-do-reino (Piper nigrum, L.). Idesia, v.28, p.31-39, 2010. http://www.scielo.cl/pdf/idesia/v28n2/art04.pdf
MARCOS-FILHO, J. Teste de envelhecimento acelerado. In: KRZYZANOWSKI, F.C.; VIEIRA, R.D.; FRANÇA-NETO, J.B.
MATTIONI, N.M.; SCHUCH, L.O.B.; VILLELA, F.A. Variabilidade
espacial da produtividade e da qualidade das sementes de soja em um campo de produção. Revista Brasileira de Sementes, v.33, p.608 - 615, 2011. http://www.scielo.br/pdf/rbs/v33n4/02.pdf
MONDO, V.H.V.; GOMES JUNIOR, F.G.; PINTO, T.L.F.; MARCHI, J.L.; MOTOMIYA, A.V.A.; MOLIN, J.P.; CICERO,
S.M. Spatial variability of soil fertility and its relationship with seed physiological potential in a soybean production area. Revista Brasileira de Sementes, v.34, p.193-201, 2012. http://www.scielo.br/ pdf/rbs/v34n2/02.pdf
NEGREIROS NETO, J.V.; SANTOS, A.C.; GUARNIERI, A.; SOUZA, D.J.D.A.T.; DARONCH, D.J.; DOTTO, M.A.; ARAÚJO,
A.S. Variabilidade espacial de atributos físico-químicos de um
Latossolo Vermelho-Amarelo distrófico em sistema plantio direto.
Semina: Ciências Agrárias, v.35, p.193-204, 2014. http://www.uel. br/revistas/uel/index.php/semagrarias/article/viewFile/13148/14062
PÁDUA, G.P.; ZITO, R.K.; ARANTES, N.E.; FRANÇA-NETO, J.B. Influência do tamanho da semente na qualidade fisiológica e na
produtividade da cultura da soja. Revista Brasileira de Sementes, v.32, p.9-16, 2010. http://www.scielo.br/pdf/rbs/v32n3/v32n3a01.pdf
REICHERT, J.M.; DARIVA, T.A.; REINERT, D.J.; SILVA, V.R.
Variabilidade espacial de Planossolo e produtividade de soja em várzea sistematizada: análise geoestatística e análise de regressão.
Ciência Rural, v.38, p.981-988, 2008. http://www.scielo.br/pdf/cr/ v38n4/a12v38n4.pdf
SANTOS, D.; SOUZA, E.G.; NÓBREGA, L.H.P.; BAZZI, C.L.; GONÇALVES JÚNIOR, A.C. Variabilidade espacial de atributos
físicos de um Latossolo Vermelho após cultivo de soja. Revista Brasileira de Engenharia Agrícola e Ambiental, v.16, p.843–848, 2012. http://www.scielo.br/pdf/rbeaa/v16n8/a05v16n8.pdf
SILVA, S.A.; LIMA, J.S.S. Relação espacial entre o estoque de
nutrientes e a densidade de solo cultivado com cafeeiro. Pesquisa Agropecuária Tropical, v.43, p. 377-384, 2013. http://www.scielo. br/pdf/pat/v43n4/02.pdf
SOUZA, D.M.G.; LOBATO, E. Cerrado: correção do solo e adubação.
2.ed. Brasília, Embrapa Informação Tecnológica, 2004. 416p.
SOUZA, G.S.; LIMA, J.S.S.; SILVA, S.A.; OLIVEIRA, R.B.
Variabilidade espacial de atributos químicos em um Argissolo sob pastagem. Acta Scientiarum Agronomy, v.30, p.589-596, 2008. http:// periodicos.uem.br/ojs/index.php/ActaSciAgron/article/view/5322/5322
TERASAWA, J.M.; PANOBIANCO, M.; POSSAMAI, E.; KOEHLER, H. S. Antecipação da colheita na qualidade fisiológica de sementes de
soja. Bragantia, v.68, p.765-773, 2009. http://www.scielo.br/pdf/brag/ v68n3/a25v68n3.pdf
VIEIRA, R.D.; KRZYZANOWSKI, F.C. Teste de condutividade elétrica. In: KRZYZANOWSKI, F.C.; VIEIRA, R.D.; FRANÇA- NETO, J.B. (Ed.). Vigor de sementes: conceitos e testes. Londrina: ABRATES, 1999. cap.4, p.1- 26.
WEBER, E. A. Excelência em beneficiamento e armazenamento de
grãos. Canoas, RS: Editora Salles, 2005.586p.
ZANÃO JÚNIOR, L.A.; LANA, R.M.Q.; GUIMARÃES, E.C.; PEREIRA, J.M.A. Variabilidade espacial dos teores de macronutrientes