___________________________________
1 CSIRO, Waite Campus, PMB 2, Glen Osmond, SA 5064, Australia. rob.bramley@csiro.au.
2 SPAA-Precision Agriculture Australia and Trengove Consulting, PO Box 6, Bute, SA 5560, Australia. samtrenny34@hotmail.com.
Recebido pelo Conselho Editorial em: 5-10-2012
PRECISION AGRICULTURE IN AUSTRALIA: PRESENT STATUS AND RECENT DEVELOPMENTS
ROBERT BRAMLEY1, SAM TRENGOVE2
ABSTRACT: A brief account of the present status of Precision Agriculture (PA) in Australia is presented, and areas of opportunity in the grains, sugar and wine industries are identified. In particular, these relate to the use of spatially-distributed experimentation to fine-tune management so as to achieve production efficiencies, reduced risk of environmental impact and enhanced food security, and the management of crop quality through selective harvesting and product streaming. The latter may be an important avenue by which farmers can take a more active role in the off-farm part of agricultural value chains. The important role of grower groups in facilitating PA adoption is also discussed.
AGRICULTURA DE PRECISÃO NA AUSTRÁLIA: SITUAÇAO CORRENTE E DESENVOLVIMENTOS RECENTES
RESUMO: Apresentamos um breve relato da situação atual da Agricultura de Precisão (AP) na Austrália, e identificamos as principais áreas de oportunidade para as indústrias de cereais, da cana-de- -açúcar, e da uva e do vinho. Especificamente, estas oportunidades envolvem o uso de experimentação espacialmente distribuída para melhoramento da gestão agrícola com os múltiplos objetivos de aumento da eficiência de produção, redução do risco de impacto ambiental, contribuição para a segurança alimentar, e gestão de qualidade através da colheita seletiva e da diferenciação de produtos. Esta última poderá ser uma importante via pela qual os agricultores passem a ter um papel mais ativo nas cadeias de valor agrícola pós-exploração. Também discutimos o papel-chave desempenhado pelos grupos de agricultores no processo de adopção da AP.
BACKGROUND
In September 2012, Precision Agriculture (PA) can no-longer be regarded as ‘new’. The first published yield map derived from a yield monitor and GPS was produced from a canola crop in Germany 22 years ago (HANEKLAUS et al., 1991; SCHNUG et al., 1991); this is the 5th Brazilian PA Conference (the first was held in 2004); whilst the 11th International Conference on PA has just been held in Indianapolis, USA. In Australia, the 15th Symposium on PA in Australasia was held earlier this month, when the grower-driven PA group, SPAA-Precision Agriculture Australia (SPAA; http://www.spaa.com.au/) celebrated its 10th birthday. An archive of these Australian symposia is available at http://sydney.edu.au/agriculture/pal/research_symposia/archive_ of_proceedings.shtml; a brief history of PA in Australia is given by Whelan (2011).
Given the increasingly rich PA history around the world, and the availability of recent reviews of PA in different cropping systems and countries (e.g. SRINIVASAN, 2006 and references therein; BRAMLEY, 2009), the focus here is on areas that may prove important in informing the on-going development of PA in Australia and elsewhere. The particular focus is on grains, winegrape and sugarcane production since these are the industries in which there has been greatest activity in Australia (COOK et al., 2006), although PA is also practised by Australian growers of a range of other crops including cotton and potatoes and has also attracted the interest of the livestock industries (e.g. HANDCOCK et al., 2009; RUIZ-MIRAZO et al., 2011; TROTTER, 2011).
of Australian agriculture, this has contributed to the need for Australian farmers to innovate in order to remain internationally competitive. Thus, COOK et al. (2006) identified four key reasons why Australian farmers might be predisposed to PA: they understand the need to improve profitability and maintain access to export markets; they have to cope with a risky growing environment (in light of a highly variable climate, coupled with their exposure to international markets); as a consequence, they are responsive to technological advances that improve farm performance; and so need tools which assist with the monitoring, analysis and diagnosis of this performance.
Two important differences between Australia and some other countries in the implementation of PA are the predominant focus on zonal management (e.g. TAYLOR et al., 2007) and rejection of approaches used elsewhere based on grid soil sampling. The reasons for this derive largely from the recognition that the primary indicator of production variability is the crop itself. Also important is the fact that grid-based systems are inefficient and consequently often fail to capture important aspects of variation (e.g. BRAMLEY & JANIK, 2005), the recognition that there is a richness of information which accrues through integrating different spatial data layers (e.g. Figure 1) and in particular, the fact that most Australian agricultural systems are low-input by comparison with many of their counterparts in other countries. The latter, along with the water-constrained nature of the Australian agricultural landscape, means that there is arguably little ‘room to move’ as far as continuous variable rate application of fertilizers is concerned. Zone based management, typically with a focus on a ‘low’, ‘medium’ and ‘high’ classification, or even just ‘low’ and ‘high’, therefore makes more sense in most situations.
GRAINS
By virtue of the areal extent of its land use, PA in Australia is dominated by the grains industry. Anecdotal evidence suggests that the adoption of auto-steer may now be as high as 90% (Randall Wilksch – President, SPAA – pers. comm.) as evidenced by ‘hand driven’ fields now being a rare sight in many regions. BRAMLEY (2009) has noted that such technology does not
contribute to the ‘information intensive’ element of PA (FOUNTAS et al., 2006). However,
auto-steer adoption is important because it facilitates familiarity with technologies such as the global navigation satellite systems (GNSS) and so arguably makes the adoption of the other core components of PA (e.g. yield mapping, high resolution soil survey, etc...) more straightforward. Thus, whilst there were significant Australian advances made in the philosophical development of PA during the 1990s and early 2000s (e.g. COOK & BRAMLEY, 1998; WHELAN & MCBRATNEY, 2000), it has been the more recent advent and access to auto-steer which has assisted with the development and adoption of PA on-farm. Nevertheless, the level of adoption of technologies such as yield mapping and variable rate fertilizer application (VRA) is arguably rather low (ROBERTSON et al., 2011), despite the numerous examples of PA enhancing profitability (e.g. SPAA, 2008; ROBERTSON et al., 2009), the rapid adoption of auto-steer and the drivers for PA adoption identified by COOK et al. (2006).
Australian farm consultants to provide PA services to Australian grain growers. This may also explain why many growers use manually operated systems rather than purpose-built VRA technologies to manage within-field variability, preferring to use soil tests, high resolution soil survey (e.g. EM38) or their own knowledge of field variation as a basis for targeting management (ROBERTSON et al., 2011).
a.
b.
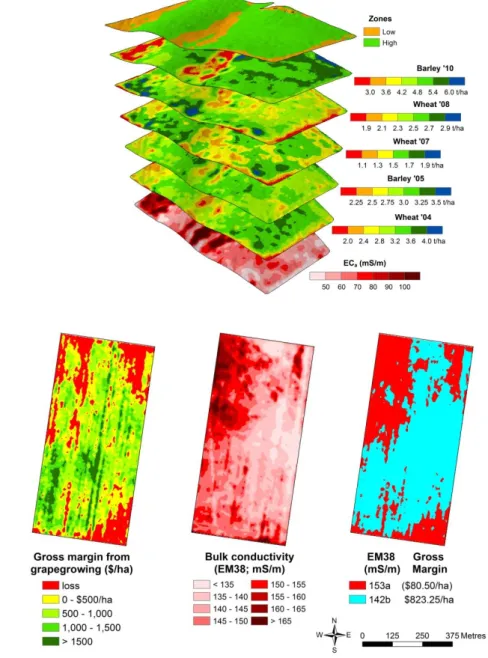
FIGURE 1. Examples of the zone based approach to PA typically used in Australia. In (a) which shows a 96 ha cereal field from the Eyre Peninsula, South Australia, yield maps (2004-2010) have been clustered (using k-means) with a map of apparent electrical soil conductivity (ECa) derived from a high resolution soil survey using EM38 to derive
two management zones for differential management. In (b) which shows a 33 ha vineyard near Griffith, New South Wales, a yield map has been used to derive a map of the gross margin (GM) derived from grapegrowing. As in (a), an ECa map was also
available. The clustering of these data suggests a likely association between poor returns and a soil constraint. Since simple comparison between the GM and ECa maps
Anecdotal commentary from SPAA suggests a slow but steady uptake of VRA for application of phosphorus (P) fertilizer, but much less use of VRA for nitrogen (N). The low use of VRA for N is considered due to the comparatively low rates of N used and consequent low level of variation in N rates used. It is also the case that whilst there are several companies pushing the use of cheap remotely sensed imagery with a view to assisting with mid-season N fertilizer decisions, the adoption of this, and especially on-the-go proximal crop sensing, has been low due to the perception that, even when VRA N is profitable, the additional cost of using such technologies over and above that of yield mapping and high resolution soil survey is not justified. Furthermore, on-the-go sensing of grain protein, whether to assist in the management of N agronomy or in support of selective harvesting (see below), has not proven reliable to date (BRAMLEY et al., 2012c) and so accurate estimation of N removal in crops has not been possible.
WINE
It is now 13 years since the publication of the first winegrape yield map (BRAMLEY & PROFFITT, 1999). In the intervening period, Australian grapegrowers and winemakers have adopted elements of Precision Viticulture (PV) in support of goals around business profitability and the sustainability of the natural resources which underpin the vineyard (e.g. Figure 1b; PROFFITT et al., 2006; BRAMLEY 2010). Wine quality, and its management through selective harvesting, have been of particular focus and have been shown to be highly profitable (BRAMLEY et al., 2005, 2011c). Remotely sensed imagery (in contrast to the grains industry) and high resolution (EM38) soil survey have been the predominant technologies used, with somewhat less use of yield mapping. The latter is likely associated with the fact that there is presently only one commercial provider of winegrape yield monitor, with none of the grape harvester manufacturers yet providing a yield monitor as a standard feature on a new machine – in marked contrast to the situation in grains.
The perennial nature of grapevines arguably makes PA easier than in broadacre annual crops such as wheat or barley and, because of this, it certainly appears feasible to delineate management zones using fewer data layers than would be considered necessary in grains (e.g. Figure 1). However, and in spite of the demonstrated profitability of PV, adoption rates remain low, with most adoption confined to wine companies or regions in which a leading viticulturist has taken on the
role of ‘local champion’ for PV. The main reason for this has been the same dearth of consultant
support to assist with data processing and spatial analysis as affects the grains industry (see above); along with a perception that the stability of vineyard zones over time means that less frequent data acquisition is required. Further, yield monitoring is perceived as expensive by comparison with remote sensing (~$30/ha) which can be purchased when required. A recent downturn in the wine industry, associated initially with drought and then more substantially, an oversupplied international market, has also conspired against PV adoption due to the tightening of budgets - a somewhat counter-intuitive response given the enhanced efficiency of resource use which PV promotes and the opportunities to be more profitable (PROFFITT et al., 2006; BRAMLEY, 2010). There have however, been some important recent advances in Precision Viticulture relating to selective harvesting (BRAMLEY et al., 2011c) which should promote more widespread adoption. Recent work on spatial variation in crop phenology, on-the-go sensing of fruit quality and viticultural experimentation (see below), may also assist.
SUGARCANE
The state of PA in the sugar industries of the world is considered in some detail by BRAMLEY (2009). Following the development of a sugarcane yield monitor (COX et al., 1997), exploratory work on sugarcane PA took place in the late 1990s (BRAMLEY & QUABBA, 2001). However, aside from intensive activity on just one or two farms (see for example
(1997) yield monitor. However, coupled to a booming world sugar market, much of the present interest has been inspired by the recent availability to Australian cane farmers of grants which support adoption of farming methods which are perceived to reduce the impact of agriculture on the Great Barrier Reef; PA, and VRA in particular, is such a technology (BRAMLEY et al., 2008). There are two significant problems with this. First, the inaccuracy of the fertilizer delivery mechanisms used by Australian sugarcane growers (Dr Bernard Schroeder and John Panitz, BSES Ltd - pers. comm) raise serious questions about the merits of retro-fitting these with VRA controllers. Second, and arguably of more immediate importance, the present lack of a robust, commercially available sugarcane yield monitoring system in Australia (JENSEN et al., 2010) casts doubt on the basis for delineating management zones in sugar fields and thus, VRA. A major research effort which addresses these issues and the means by which sugar growers might adopt PA is presently underway. Nevertheless, auto-steer technology is being rapidly adopted in the Australian sugar industry and, as has been the case with grains (see above); this is expected to increase interest and adoption, which is otherwise lagging behind other major cropping industries.
JENSEN et al. (2012) have recently demonstrated the viability of a range of approaches to sugarcane yield monitoring. Constraints to the robustness of sugarcane yield monitoring in Australia therefore now appear largely confined to issues associated with the consignment of sugarcane to the Mill and the consequences of inaccuracies and errors in this process for yield monitor calibration. Meanwhile, the merits of developing an on-the-go sensor for commercial cane sugar (CCS) content seem clear (BRAMLEY et al., 2012d; see also below), whilst high resolution soil sensing technologies have been demonstrated to have the same utility in sugarcane PA production as in other cropping systems (COVENTRY et al., 2009). Indeed, the adoption of such technologies in the conservative Australian sugar industry has arguably been delayed by a perceived need to check that technologies that have been used in other cropping systems can also be of use to canegrowers (BRAMLEY et al., 2012a).
ROBSON et al. (2012a) have recently demonstrated the utility of satellite remote sensing as a sugarcane yield prediction tool, and whilst the application of this technology is presently more focussed on whole-of-harvest management at the regional scale (ROBSON et al., 2012b), the prospects for using it as an aid to mid-season management appear limited only by issues associated with cloud cover interference. Airborne alternatives are currently being considered as a possible solution to this problem (Dr Andrew Robson, Queensland Department of Agriculture, Fisheries and Food, Prof. David Lamb, University of New England – pers. comm).
SOME RECENT DEVELOPMENTS IN AUSTRALIAN PA
SPAA-Precision Agriculture Australia (www.spaa.com.au) and the role of grower groups
SPAA is a non-profit and independent membership-based group which was formed in 2002 to promote the development and adoption of PA. It aims to be the leading advocate for PA in Australia and through the facilitation of research, extension and adoption of PA, seeks to improve the profitability and sustainability of Australian agricultural production systems. Initially established by a small group of South Australian-based grain growers, farm consultants and researchers, by the end of June 2012, there were 397 fully subscribed members plus four corporate members. SPAA members are involved in the production of grains, winegrapes, sugarcane and horticultural crops throughout Australia and comprise growers, consultants, equipment manufacturers, contractors and researchers; a recent development has been the emergence of a sub-branch in New Zealand. The wide membership base is a reflection of the potential that is offered by PA and of the determination of SPAA to canvass membership across industries, given the generic nature of the application of PA to crop production.
Key elements of SPAA’s activities have been the hosting of industry ‘expos’ and research
These were first initiated in 2007 and have been maintained in various forms for the past 6 years through competitively obtained project funding from various sources, including the Australian Department of Agriculture Fisheries and Food, the South Australian Grains Industry Trust, the Grains Research and Development Corporation (GRDC), the Sugar Research and Development Corporation, the National Landcare Program and local Natural Resource Management boards. When first initiated, the groups were run and managed by SPAA as discrete ‘SPAA groups’, but following funding from GRDC, SPAA has moved to link with existing farming systems groups that operate in various grain growing regions, utilising their personnel, resources and networks to give the activities greater exposure. With funding obtained from GRDC in 2009, the eight South Australian groups were expanded to 16 groups in south eastern Australia (South Australia, Victoria and New South Wales). Three similar groups have recently been established in the wine industries of South Australia (Coonawarra region) and Victoria (Yarra Valley, Grampians).
The groups typically meet three times per year, with meeting topics relevant to the time of year and the impending seasonal tasks. Issues covered have included yield mapping, data management, on farm trials, crop sensors/imagery, soil sensors, weed seeking and mapping, auto-steer and machine control. The groups have been a mechanism for growers to learn from each other, with many shared experiences; they have been highly valued by participants. SPAA has also brought in experts and farmers from other regions to share their knowledge and experience, something which would not have occurred without the groups and the associated funding support. In many regions there has been a consequent noticeable improvement in the knowledge and support from commercial dealerships over the six years that the groups have been in operation, although some areas remain poorly serviced. Consistent with the work of ROBERTSON et al (2011), the poorer the access to service, the more important has been the role of SPAA in providing advice on how best growers should use the PA hardware and software that they have purchased.
As might be expected, the grower groups are ‘fluid’ with some turnover of members
attending. As some growers reach their PA goals they may have less need for ongoing information, but many growers remain at the early stages of adoption. As a consequence, most groups comprise a range of skills, which can present difficulties in coordinating training to cater for the needs of all. Partly in response to this, SPAA has run a number of more advanced training workshops in Adelaide, at which more experienced/keen practitioners from each group have been brought together to provide more extensive training, with the intention that they act as agents for transferring information back to the regions. As might be expected, given the information technology-dependence of PA, younger farmers have been observed to pick up the software and data management skills much quicker than their parents. Thus, some PA adoption issues are expected to be overcome through generational change.
A focus on crop quality
As indicated, rather than a focus on variable rate application of inputs such as fertilizers, the wine sector interest in PA has been much more focussed on selective harvesting; that is, the targeted management of outputs. Selective harvesting is defined as the split picking of fruit at harvest according to different yield / quality criteria, in order to exploit the observed variation (BRAMLEY et al. 2005). Early Australian work demonstrated that very significant increases in the value of production could be achieved through this strategy, with benefits accruing to both grapegrowers and especially winemakers. In an example from Western Australia, the retail value of wine production was increased by over $40,000/ha (BRAMLEY et al., 2005). However, there has been a strong perception, especially amongst producers in the hot inland irrigated wine regions (RIVERLAND, Murray Valley, Murrumbidgee), whose production is geared towards high-volume, low-priced table wines, that these benefits were not available to them. Rather, it was perceived that selective harvesting was only available to either small boutique producers who, through the use of small tanks, could take advantage of differences between small parcels of fruit, or the large multinational companies whose wineries typically have a range of different tank sizes and more than one crusher. However, in work conducted at a site in the Murray Valley, at which the smallest tank size is 75 t, and where only one crusher is available, BRAMLEY et al (2011c) have demonstrated that selective harvesting may be profitable even when production is geared towards large fermentation volumes. This work indicated that the benefit of selective harvesting to the winemaker was an increase in the wholesale value of production of around 2-12%, depending on whether the price differential between the higher value wine and the other was $1 or $5/bottle. The benefit to the grower in this example was much less and dependent on the different prices payable for different grades of fruit, but was nevertheless quite achievable.
This early research and adoption of selective harvesting was based on the idea of segregating a vineyard block into two or three zones using a range of spatial data (e.g. Figure 1b), and then harvesting these into separate product streams using two or three chaser bins during a single harvest event. In the absence of a fruit quality sensor, the spatial data used for zone delineation would typically relate to vine vigour (remote or proximal sensing), yield (if yield monitoring were being used), and EM38 soil survey. Recent work aimed at development of an on-the-go sensor for grape anthocyanin content (BRAMLEY et al., 2011b) gave promising results, albeit confined in its application to the harvest of red winegrapes. However, grape and wine quality is highly complex, given its dependence on a large number of chemical and sensory attributes, some of which in grapes, may be markedly altered, synthesised or metabolised in the process of making wine. Anthocyanins are an important quality marker in red grapes, but are irrelevant to whites, and their content, like that of other grape metabolites, is also markedly affected by crop maturation processes. This leads to the idea that in addition to knowing about spatial variation in fruit yield and attributes of quality, for selective harvesting decisions to be optimised, the question of when to harvest different zones also needs to be addressed in addition to their spatial delineation. Trought and BRAMLEY (2011) have recently shown that by using proximally sensed imagery acquired using a Crop Circle™ sensor, along with a 'juice scoring system' and some simple models of vine phenology, both zone delineation and harvest date decisions could be optimized (Figure 2). Questions of harvest date also have resonance in the sugar industry (HIGGINS et al., 1998). Calculations based on maps of yield and CCS variation in a 6.8 ha sugarcane field in the Bundaberg district characterised by limited soil variation, suggest that in 2011 at this site, 23% of the within-field variation in farmer income was due to CCS variation (Figure 3). The effect of harvest date on this figure is unknown and warrants investigation.
of the protein sensors. On-the-go yield and protein sensing was undertaken during harvest of barley over three seasons (2009-11) on three South Australian farms. Yield data were integrated with high resolution (EM38 and gamma radiometric) soil survey data and remote and proximally sensed crop imagery (gs31) to identify zones for which selective harvesting might be appropriate (e.g. Figure 1a). However, these zones did not always align well with variation identified in the protein maps. Furthermore, whilst the protein sensor data clearly demonstrated that grain protein is spatially structured, problems with sensor calibration and operation presented severe constraints to the robust use of these sensors.
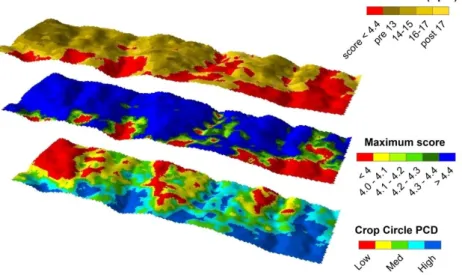
FIGURE 2. Variation in vine vigour assessed on the basis of the plant cell density (PCD) or simple index (the ratio of infrared: red reflectance) and its use as a predictor of fruit quality in a 5.9 ha vineyard in Marlborough, New Zealand. A juice score was constructed from juice pH, brix and titratable acidity values predicted on a weekly basis from PCD data collected at veraison, and using knowledge of winemaker preferences for these attributes. See Trought and Bramley (2011) for further explanation.
Additional problems arose as a consequence of the mode of protein sensor operation. Because the currently available sensors depend on NIR transmission rather than reflectance, they require the separate filling of a ‘sample chamber’ for each point measurement, rather than continuous sensing. An important consequence of this is that each analysis may take 7-22 seconds. As a result, the spatial density of sensor data is low, by comparison with that provided by a yield monitor for example, which typically logs at 1 or 2 seconds. As a result, the confidence interval used to test the significance of between-zone differences (TAYLOR et al., 2007) in protein is relatively high. For obvious reasons, this greatly reduces the confidence that can be attached to the delineation of protein zones (BRAMLEY et al., 2012c). It is to be hoped that protein sensing technology will be further developed since selective harvesting remains a philosophically sound idea for the grains industry to pursue. Robust protein sensing also offers benefits for the optimisation of crop N management.
Spatially distributed experimentation for production optimisation and food security
CARBERRY et al. (2011) have identified PA as a potentially important technology in addressing the issue of food security, especially given its potential role in enabling agricultural output to be maintained whilst reducing the risk associated with that output. They key to success in this area is that in addition to knowing that different parts of a farm are different, knowledge of how they should be managed differently is also required. Much of the PA literature presumes that this knowledge is available, but given differences in the nature and extent of site-specific variation, and the broader, more generalised, regional variation that may be canvassed by a district agronomist or farm adviser, the knowledge base required for fine-tuning of site-specific management is often not, in fact, available. A possible solution to this problem is to do some experiments on-farm.
FIGURE 4. Crop performance in a 35 ha field growing malting barley in 2011 as measured by NDVI (proximal sensing at gs31), yield monitoring and grain protein measured using either laboratory analysis of samples collected by hand, or on-the-go sensing using a Zeltex 'Accuharvest' sensor. In each map, the data have been classified on the basis of 20th percentiles. When the yield and protein data are clustered together (2 zone solution – not shown), their patterns of variation are very similar to those in zones derived from 6 years of yield data and high resolution (EM38) soil survey – but only when the hand-sampled protein data are used (BRAMLEY et al., 2012c).
often paramount), their experiments are consequently often scorned by researchers. By contrast, researchers tend to employ randomised designs coupled with rigorous statistical analysis, either in an attempt to remove the effects of underlying variation and/or under the assumption that such variation has no impact on the results, or even that there is none. However, if PA teaches us nothing else, it illustrates very clearly that assumptions of homogeneity are unlikely to hold true (Figure 5a) and that consequently, attempts at removing its effects may not be successful. Meanwhile, farmers often regard the experiments of researchers with circumspection as their plots are perceived as unrealistically small and because treatments are often applied by hand rather than using machinery that is similar (and of similar size) to their own; this is a particular problem for experiments involving sprays.
A solution to this impasse, which may be attractive to both farmers and researchers, is to use a spatially distributed approach coupled with spatial analysis of treatment responses (BISHOP & LARK, 2006, 2007). In this approach, experiments are laid down either in single strips (e.g. LAWES & BRAMLEY, 2012), spatially distributed plots (WHELAN et al., 2003) or using highly replicated designs (e.g. PANTEN et al., 2010; BRAMLEY et al., 2011a) covering the entire management unit (Figure 5b) using the tools of PA for their design and establishment. Whichever approach is used, the underlying variation in the trial site is used as an experimental tool such that when the experiment is analysed using appropriate spatial analysis, spatial variability in the treatment response and in the statistical significance of treatment effects can be determined. The latter keeps researchers happy, while the fact that the experiment is conducted at the same scale as normal farm operations means that the results are also relevant to the farmer. Importantly, whereas the plot-based approach (Figure 5a) addresses the question as to whether treatment A is better than treatment B, the spatial approach (Figure 5b) recognises that either may be beneficial, albeit in different parts of the same field.
a. b.
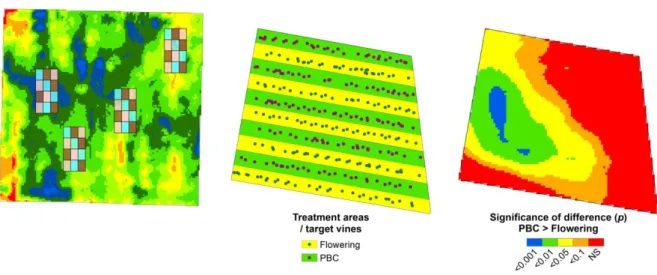
FIGURE 5. Problems posed for experimentation by spatial variation and a possible solution. Part (a), which shows a 7 ha vineyard, seeks to illustrate how the results of a small plot trial could be compromised by the underlying variation – illustrated here by a yield map. A potential solution to this is shown in (b) which shows an experiment conducted over an entire 2.4 ha vineyard (Bramley et al., 2011a). The objective was to assess the effects of the timing of spray application (either flowering or pre-bunch closure; PBC) on the incidence of botrytis. As can be seen, the statistical significance of the difference between the effects of these treatments, and therefore their relative efficacy, was highly spatially variable.
recent work suggests that it offers a positive way forward which will assist with the adoption of PA. A particular attraction arises from the fact that, just as the successful implementation of PA is probably dependent on experimentation, so too does PA enable the required experimentation to be carried out.
ACKNOWLEDGMENTS
Preparation of this paper was funded by CSIRO under the aegis of its Sustainable Agriculture Flagship. It draws on research funded by CSIRO in partnership with the Australian grains, wine and sugar industries through their investment bodies the Grains Research and Development Corporation, the Sugar Research and Development Corporation and the Grape and Wine Research and Development Corporation. These bodies are supported by levies paid by growers and processors with matching funding from the Federal Government. The assistance and input of Randall Wilksch and Nicole Dimos (SPAA-Precision Agriculture Australia) in preparing this paper has been much appreciated, as has that of Dr Marta Monjardino (CSIRO Ecosystem Sciences) who kindly translated the abstract into Portuguese.
REFERENCES
BISHOP, T.F.A.; LARK, R.M. The geostatistical analysis of experiments at the landscape-scale. Geoderma, Amsterdam, v.13, p. 87-106, 2006.
BISHOP, T.F.A.; LARK, R.M. A landscape scale experiment on the changes in available potassium over a winter wheat cropping season. Geoderma, Amstedam, v.141, p. 384-396, 2007.
BRAMLEY, R.G.V. Lessons from nearly 20 years of Precision Agriculture research, development and adoption as a guide to its appropriate application. Crop and Pasture Science, Vietnam, v. 60, p. 197-217, 2009.
BRAMLEY, R.G.V. Precision Viticulture: Managing vineyard variability for improved quality outcomes. In: REYNOLDS, A.G. (Ed) Managing wine quality. Viticulture and wine quality. Woodhead Publishing, Cambridge, 2010. p. 445-480.
BRAMLEY, R.G.V.; JANIK, L.J. Precision agriculture demands a new approach to soil and plant sampling and analysis – Examples from Australia. Communications in Soil Science and Plant Analysis, New York, v. 36, p. 9-22, 2005.
BRAMLEY, R,G,V.; PROFFITT, A.P.B. Managing variability in viticultural production. The Australian Grapegrower and Winemaker, v. 427, p.11-16, 1999.
BRAMLEY, R.G.V.; QUABBA, R.P. Opportunities for improving the management of sugarcane production through the adoption of precision agriculture – An Australian perspective. Proceedings of the International Society of Sugar Cane Technologists, v. 24, p. 38-46, 2001.
BRAMLEY, R.G.V; PROFFITT, A.P.B.; HINZE, C.J.; PEARSE, B.; HAMILTON, R.P. Generating benefits from Precision Viticulture through selective harvesting. In: EUROPEAN CONFERENCE ON PRECISION AGRICULTURE, 5., 2005, Wageningen. Proceedings... p. 891– 898.
BRAMLEY, R.G.V.; HILL, P.A.; THORBURN, P.J.; KROON, F.J.; PANTEN, K. Precision Agriculture for improved environmental outcomes: Some Australian perspectives.
Landbauforschung, Braunschweig, v. 58, p. 161-178, 2008.
BRAMLEY, R.G.V.; EVANS, K.J.; DUNNE, K.J.; GOBBETT, D.L. Spatial variation in response
to ‘reduced input’ spray programs for powdery mildew and botrytis identified through whole
BRAMLEY, R.G.V.; LE MOIGNE, M.; EVAIN. S.; OUZMAN, J.; FLORIN, L.; FADAILI, E.M.; HINZE, C.J.; CEROVIC, Z.G. On-the-go sensing of grape berry anthocyanins during commercial harvest – Development and prospects. Australian Journal of Grape and Wine Research, Adelaide, v. 17, p. 316-326, 2011b.
BRAMLEY, R.G.V.; OUZMAN, J.; THORNTON, C. Selective harvesting is a feasible and profitable strategy even when grape and wine production is geared towards large fermentation volumes. Australian Journal of Grape and Wine Research, Adelaide, v.17, p. 298-305, 2011c.
BRAMLEY, R.G.V.; GOBBETT, D.L.; PANITZ, J.H.; WEBSTER, A.J.; MCDONNELL, P. Soil sensing at high spatial resolution – broadening the options available to the sugar industry. In: Conference of The Australian Society of Sugar Cane Technologists, 34., Cairns. Proceedings... 8 p.
BRAMLEY, R.G.V.; LAWES, R.A.; COOK, S.E. Spatially distributed experimentation: tools for the optimisation of targeted management. In: OLIVER, M.A.; BISHOP, T.S.; MARCHANT, B.M. (Ed). Precision agriculture for sustainability and environmental protection. London: Earthscan, 2012a. In press.
BRAMLEY, R.; MOWAT, D.; GOBBETT, D.; BRANSON, M.; WAKEFIELD, A.; WILKSCH, R. Mixing grapes and grain – Scoping the opportunity for selective harvesting in cereals. In: YANUSA I. (Ed.) Captuaring opportunities and overcoming obstacles in Australian Agronomy. In:
AUSTRALIAN SOCIETY OF AGRONOMY CONFERENCE, 16., 2012, Armidale. Proceedings... Disponível em: <www.agronomy.org.au>.
BRAMLEY, R.G.V.; PANITZ, J.H.; JENSEN, T.A.; BAILLIE, C.P. Within block spatial variation in CCS – Another potentially important consideration in the application of Precision Agriculture to sugarcane production. CONFERENCE OF THE AUSTRALIAN SOCIETY SUGAR CANE TECHNOLOGISTS, 34., Cairns. Proceedings... 8p.
CARBERRY, P.S.; BRUCE, S.E.; WALCOTT, J.J.; KEATING, B.A. Innovation and productivity in dryland agriculture: a return-risk analysis for Australia. Journal of Agricultural Science, New Delhi, v. 149, p. 77-89, 2011.
COOK, S.E.; BRAMLEY, R.G.V. Precision agriculture - Opportunities, benefits and pitfalls. Australian Journal of Experimental Agriculture, Melbourne, v. 38, p. 753-763, 2011.
COOK, S.E.; BRAMLEY, R.G.V. Is agronomy being left behind by precision agriculture? In AUSTRALIAN AGRONOMY CONFERENCE, 10., 2001. Proceedings... Disponível em: <www.regional.org.au/au/asa/2001/plenary/2/cook.htm>.
COOK, S.E.; ADAMS, M.L.; BRAMLEY, R.G.V. What is obstructing the wider adoption of precision agriculture technology? In: INTERNATIONAL CONFERENCE ON PRECISION AGRICULTURE, 5., 2000. Madison. Proceedings...
COOK, S.E.; ADAMS, M.L.; BRAMLEY, R.G.V.; WHELAN, B.R. Australia. In: Srinivasan, A. (Ed). Handbook of precision agriculture: principles and applications. New York: The Haworth Press, 2006. Chap. 19.
COVENTRY, R.J.; POLLOCK, D.C.; HUGHES, J.R.; DI BELLA, L.P. A role for soil EM
mapping in precision agricultural practices for sugarcane production. Proceedings of the Australian Society of Sugar Cane Technologists, v. 31, p. 265-273, 2009.
COX, G.J.; HARRIS, H.D.; PAX, R. Development and testing of a prototype yield mapping system. Proceedings of the Australian Society of Sugar Cane Technologists, v. 19, p. 38-43, 2009.
GRIFFIN, T.W.; LOWENBERG-DEBOER, J. Worldwide adoption and profitability of precision agriculture. Revista de Politica Agricola, v.14, p. 20-38, 2005.
HANDCOCK, R.N.; SWAIN, D.L.; BISHOP-HURLEY, G.J.; PATISON, K.P.; WARK, T.;
VALENCIA, P.; CORKE, P.; O’NEILL, C.J. Monitoring animal behaviour and environmental
interactions using wireless sensor networks, GPS collars and satellite remote sensing. Sensors, Lausanne, v. 9, p. 3.586-3.603, 2009.
HANEKLAUS, S.; LAMP, J.; SCHNUG, E. Erfassung der räumlichen Variabilität von Rapserntemengen in Ertragskarten. Raps, v. 9, p. 142-143, 1991.
HIGGINS, A.J.; MUCHOW, R.C.; RUDD, A.V.; FORD, A.W. Optimising harvest date in sugar production: a case study for the Mossman Mill region in Australia. I. Development of operations research model and solution. Field Crops Research, Amsterdam, v. 57, p. 153-162, 1998.
HOGAN, L., MORRIS, P. Agricultural and food policy choices in Australia. 2010. Disponível em: <http://adl.brs.gov.au/data/warehouse/pe_abarebrs99001749/CP10.15_Agric_food_policy_CONFE RENCE_PAPER.pdf>.
JENSEN, T.; BAILLIE, C.; BRAMLEY, R.; DIBELLA, L.; WHITEING, C.; DAVIS, R.
Assessment of sugarcane yield monitoring technology for precision agriculture. Proceedings of the Australian Society of Sugar Cane Technologists, v. 32, p. 410-423, 2010.
JENSEN, T.A.; BAILLIE, C.; BRAMLEY, R.G.V.; PANITZ, J.H. An assessment of sugarcane yield monitoring concepts and techniques from commercial yield monitoring systems. In:
CONFERENCE OF THE AUSTRALIAN SOCIETY OF SUGAR CANE TECHNOLOGISTS, 34., 2012, Cairns. Proceedings... 7p.
LAWES, R.A.; BRAMLEY, R.G.V. A simple method for the analysis of on-farm strip trials. Agronomy Journal, v. 104, p. 371-377, 2011.
PANTEN, K.; BRAMLEY, R.G.V.; LARK, R.M.; BISHOP, T.F.A. Enhancing the value of field experimentation through whole-of-block designs. Precision Agriculture, Dordrecth, v. 11, p. 198-213, 2010a.
PROFFITT, T.; BRAMLEY, R.; LAMB, D.; WINTER, E. Precision Viticulture – A new era in vineyard management and wine production. Adelaide Winetitles, 2006.
ROBERTSON, M.J.; CARBERRY, P.S.; BRENNAN, L.E. Economic benefits of variable rate technology: case studies from Australian grain farms. Crop and Pasture Science, Victoria, v. 9, p. 799-807, 2009..
ROBERTSON, M.J.; LLEWELLYN, R.S.; MANDEL, R.; LAWES, R.; BRAMLEY, R.G.V.;
SWIFT, L.; METZ, N.; O’CALLAGHAN, C. Adoption of variable rate technology in the
Australian grains industry: status, issues and prospects. Precision Agriculture, Dordrecth, v. 13, p. 181-199, 2011.
ROBSON, R.; ABBOTT, C.; LAMB, D.; BRAMLEY, R. Developing sugar cane yield prediction algorithms from satellite imagery. In: CONFERENCE OF THE AUSTRALIAN SOCIETY OF SUGAR CANE TECHNOLOGISTS, 34., 2012a, Cairns. Proceedings... 11 pp.
ROBSON, R.; ABBOTT, C.; LAMB, D.; BRAMLEY, R. Deriving Sugarcane Yield Maps from SPOT 5 Satellite Imagery at a Regional Scale. In: Gilbert RA (Ed.). Sustainable sugarcane production. Proceedings of the ISSCT agronomy and agricultural engineering workshop, p. 9-14 September, Townsville. In press.
SCHNUG, E.; HANEKLAUS, S.; LAMP, J. Continuous large scale yield mapping in oilseed rape fields and application of yield maps to CAF. Oilseeds, Washington, v. 9, p. 13-14, 1991.
SPAA. PA in Practice –grain growers’ experience of using variable rate and other PA technologies. SPAA-Precision Agriculture Australia. 2008. Disponívem em:
<www.spaa.com.au/pdf/5721_pa_in_practice_final.pdf>
SRINIVASAN, A. Handbook of Precision Agriculture: Principles and Applications. New York: The Haworth Pres, 2006.
TAYLOR, J.A.; MCBRATNEY, A.B.; WHELAN, B.M. Establishing management classes for broadacre agricultural production. Agronomy Journal, Madison, v. 99, p.1.366–1.376, 2007.
TROUGHT, M.C.T.; BRAMLEY, R.G.V. Vineyard variability in Marlborough, New Zealand: Characterising spatial and temporal changes in fruit composition and juice quality in the vineyard. Australian Journal of Grape and Wine Research, Adelainde, v. 17, p. 79-89, 2011.
TROTTER, M.G. Precision agriculture in grazing systems. 2011. In: PRECISION AGRICULTURE ANNUAL CONFERENCE. Disponível em:
<www.spaa.com.au/pdf/87_2011Conference_No_adverts.pdf.>
WHELAN, B.M. A review of the history of Precision Agriculture in Australia and some future opportunities. 2011. p. 5-10. Disponível em:
<http://sydney.edu.au/agriculture/pal/documents/Brief%20History%20of%20PA%20in%20Australi a.pdf>.
WHELAN, B.M.; MCBRATNEY, A.B. The “Null Hypothesis” of Precision Agriculture management. Precision Agriculture, Dordretch, v. 2, p. 265-279, 2000.